Leeds Airbnb Market Analysis 2026: Short Term Rental Data & Vacation Rental Statistics in Utah, United States
Is Airbnb profitable in Leeds in 2026? Explore comprehensive Airbnb analytics for Leeds, Utah, United States to uncover income potential. This 2026 STR market report for Leeds, based on AirROI data from February 2025 to January 2026, reveals key trends in the niche market of 28 active listings.
Whether you're considering an Airbnb investment in Leeds, optimizing your existing vacation rental, or exploring rental arbitrage opportunities, understanding the Leeds Airbnb data is crucial. Leveraging the low regulation environment is key to maximizing your short term rental income potential. Let's dive into the specifics.
Key Leeds Airbnb Performance Metrics Overview
Monthly Airbnb Revenue Variations & Income Potential in Leeds (2026)
Understanding the monthly revenue variations for Airbnb listings in Leeds is key to maximizing your short term rental income potential. Seasonality significantly impacts earnings. Our analysis, based on data from the past 12 months, shows that the peak revenue month for STRs in Leeds is typically October, while January often presents the lowest earnings, highlighting opportunities for strategic pricing adjustments during shoulder and low seasons. Explore the typical Airbnb income in Leeds across different performance tiers:
- Best-in-class properties (Top 10%) achieve $3,908+ monthly, often utilizing dynamic pricing and superior guest experiences.
- Strong performing properties (Top 25%) earn $2,240 or more, indicating effective management and desirable locations/amenities.
- Typical properties (Median) generate around $1,333 per month, representing the average market performance.
- Entry-level properties (Bottom 25%) see earnings around $762, often with potential for optimization.
Average Monthly Airbnb Earnings Trend in Leeds
Leeds Airbnb Occupancy Rate Trends (2026)
Maximize your bookings by understanding the Leeds STR occupancy trends. Seasonal demand shifts significantly influence how often properties are booked. Typically, Aprilsees the highest demand (peak season occupancy), while January experiences the lowest (low season). Effective strategies, like adjusting minimum stays or offering promotions, can boost occupancy during slower periods. Here's how different property tiers perform in Leeds:
- Best-in-class properties (Top 10%) achieve 83%+ occupancy, indicating high desirability and potentially optimized availability.
- Strong performing properties (Top 25%) maintain 66% or higher occupancy, suggesting good market fit and guest satisfaction.
- Typical properties (Median) have an occupancy rate around 46%.
- Entry-level properties (Bottom 25%) average 27% occupancy, potentially facing higher vacancy.
Average Monthly Occupancy Rate Trend in Leeds
Average Daily Rate (ADR) Airbnb Trends in Leeds (2026)
Effective short term rental pricing strategy in Leeds involves understanding monthly ADR fluctuations. The Average Daily Rate (ADR) for Airbnb in Leeds typically peaks in June and dips lowest during January. Leveraging Airbnb dynamic pricing tools or strategies based on this seasonality can significantly boost revenue. Here's a look at the typical nightly rates achieved:
- Best-in-class properties (Top 10%) command rates of $217+ per night, often due to premium features or locations.
- Strong performing properties (Top 25%) achieve nightly rates of $139 or more.
- Typical properties (Median) charge around $101 per night.
- Entry-level properties (Bottom 25%) earn around $73 per night.
Average Daily Rate (ADR) Trend by Month in Leeds
Get Live Leeds Market Intelligence 👇

Explore Real-time Analytics
Airbnb Seasonality Analysis & Trends in Leeds (2026)
Peak Season (October, August, September)
- Revenue averages $2,468 per month
- Occupancy rates average 54.9%
- Daily rates average $138
Shoulder Season
- Revenue averages $2,147 per month
- Occupancy maintains around 51.1%
- Daily rates hold near $138
Low Season (January, February, December)
- Revenue drops to average $1,242 per month
- Occupancy decreases to average 33.0%
- Daily rates adjust to average $129
Seasonality Insights for Leeds
- The Airbnb seasonality in Leeds shows highly seasonal trends requiring careful strategy. While the sections above show seasonal averages, it's also insightful to look at the extremes:
- During the high season, the absolute peak month showcases Leeds's highest earning potential, with monthly revenues capable of climbing to $2,634, occupancy reaching a high of 61.5%, and ADRs peaking at $145.
- Conversely, the slowest single month of the year, typically falling within the low season, marks the market's lowest point. In this month, revenue might dip to $1,099, occupancy could drop to 29.9%, and ADRs may adjust down to $127.
- Understanding both the seasonal averages and these monthly peaks and troughs in revenue, occupancy, and ADR is crucial for maximizing your Airbnb profit potential in Leeds.
Seasonal Strategies for Maximizing Profit
- Peak Season: Maximize revenue through premium pricing and potentially longer minimum stays. Ensure high availability.
- Low Season: Offer competitive pricing, special promotions (e.g., extended stay discounts), and flexible cancellation policies. Target off-season travelers like remote workers or budget-conscious guests.
- Shoulder Seasons: Implement dynamic pricing that balances peak and low rates. Target weekend travelers or specific events. Offer slightly more flexible terms than peak season.
- Regularly analyze your own performance against these Leeds seasonality benchmarks and adjust your pricing and availability strategy accordingly.
Best Areas for Airbnb Investment in Leeds (2026)
Exploring the top neighborhoods for short-term rentals in Leeds? This section highlights key areas, outlining why they are attractive for hosts and guests, along with notable local attractions. Consider these locations based on your target guest profile and investment strategy.
| Neighborhood / Area | Why Host Here? (Target Guests & Appeal) | Key Attractions & Landmarks |
|---|---|---|
| Downtown Leeds | The bustling heart of the city with a mix of cultural attractions, shopping, and nightlife. Ideal for both business and leisure travelers looking for convenience and amenities. | Leeds Art Gallery, Royal Armouries Museum, Trinity Leeds, Victoria Quarter, Leeds Town Hall |
| Headingley | A vibrant area known for its university presence and youthful atmosphere, perfect for hosting students and young professionals, close to parks and local eateries. | Headingley Stadium, Cardigan Fields, Leeds Beckett University, The Otley Road, Hyde Park |
| Leeds City Centre | Offers a variety of dining, shopping, and entertainment options, attracting tourists and business visitors, making it a prime location for short-term rentals. | The Corn Exchange, Odeon Luxe Leeds, First Direct Arena, Leeds City Museum, The Majestic |
| Horsforth | A suburban area with charming parks and a family-friendly environment, attracting long-term stays and family vacations. | Horsforth Hall Park, The Greenhouse, Horsforth Arts Festival, Local cafes and shops |
| Chapel Allerton | A trendy neighborhood known for its diverse range of bars and restaurants, appealing to young professionals and a vibrant community. | Chapel Allerton Park, Local boutiques, Bars and restaurants on Street Lane, The Chapel Allerton Festival |
| Roundhay | Home to one of the largest city parks in Europe, Roundhay Park, attracting visitors for outdoor activities and family gatherings. | Roundhay Park, Tropical World, Local pubs and restaurants, Leeds Golf Club |
| Meanwood | An up-and-coming area with a blend of urban and suburban vibes. Ideal for families and young professionals seeking a quieter stay near Leeds city. | Meanwood Valley Trail, Local parks, Meanwood Urban Farm, Restaurants and cafes |
| Woodhouse | Close to the university and popular with students, Woodhouse offers a lively community atmosphere and easy access to city attractions. | Woodhouse Moor, Leeds University, Local pubs and shops, St. Mark's Church |
Understanding Airbnb License Requirements & STR Laws in Leeds (2026)
While Leeds, Utah, United States currently shows low STR regulations, specific Airbnb license requirements might still exist or change. Always verify the latest short term rental regulations and Airbnb license requirements directly with local government authorities for Leeds to ensure full compliance before hosting.
(Source: AirROI data, 2026, finding no licensed listings among those analyzed)
Top Performing Airbnb Properties in Leeds (2026)
Benchmark your potential! Explore examples of top-performing Airbnb properties in Leedsbased on Trailing Twelve Month (TTM) revenue. Analyze their characteristics, revenue, occupancy rate, and ADR to understand what drives success in this market.
Pickleball Palace B&B
Entire Place • 3 bedrooms

Amazing Stay Near Zion. Breakfast Included
Entire Place • 3 bedrooms
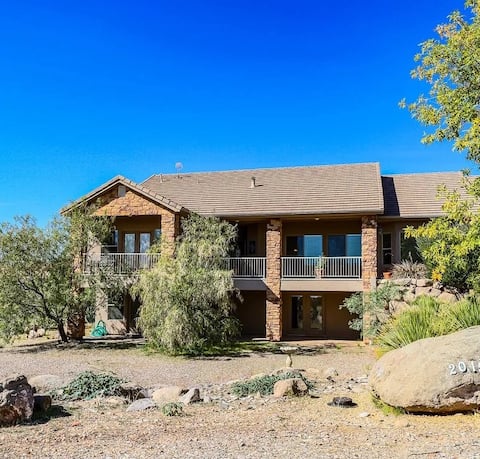
Lower-Level Beauty & Privacy. Full Kitchen, King
Entire Place • 3 bedrooms

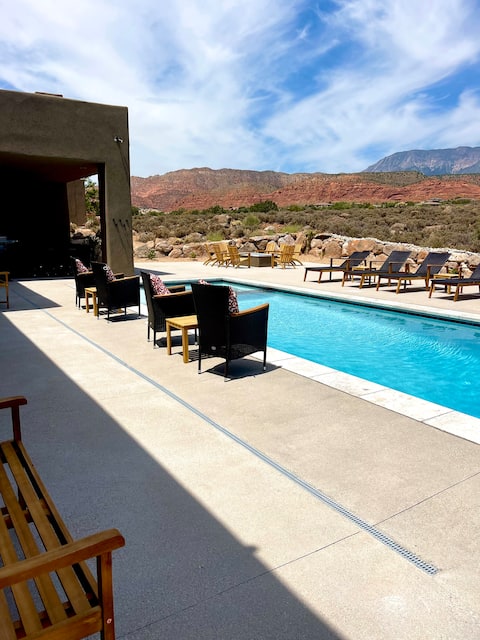
Modern Red Cliff Home | Private Pool w/ a View
Entire Place • 4 bedrooms

Luxury Tiny House on 1 acre near Zion & St George
Entire Place • N/A
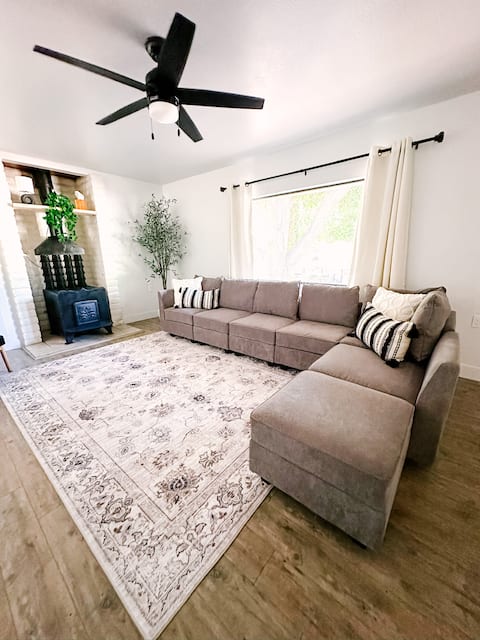
Cozy Cottage Near Zion!
Entire Place • 3 bedrooms
Note: Performance varies based on location, size, amenities, seasonality, and management quality. Data reflects the past 12 months.
Top Performing Airbnb Hosts in Leeds (2026)
Learn from the best! This table showcases top-performing Airbnb hosts in Leeds based on the number of properties managed and estimated total revenue over the past year. Analyze their scale and performance metrics.
| Host Name | Properties | Grossing Revenue | Stay Reviews | Avg Rating |
|---|---|---|---|---|
| Abigail | 1 | $121,744 | 24 | 5.00/5.0 |
| Kristen | 6 | $74,473 | 668 | 4.79/5.0 |
| Shelly | 1 | $50,138 | 106 | 4.92/5.0 |
| MichelleandJustin | 4 | $47,730 | 2241 | 4.83/5.0 |
| Chantelle | 2 | $45,703 | 325 | 4.93/5.0 |
| Jean | 1 | $42,583 | 13 | 5.00/5.0 |
| Southern Utah Luxury | 1 | $39,980 | 2 | Not Rated |
| Lindsay | 1 | $27,841 | 477 | 4.99/5.0 |
| Todd | 1 | $26,567 | 70 | 4.91/5.0 |
| Natalie | 1 | $20,129 | 44 | 5.00/5.0 |
Analyzing the strategies of top hosts, such as their property selection, pricing, and guest communication, can offer valuable lessons for optimizing your own Airbnb operations in Leeds.
Dive Deeper: Advanced Leeds STR Market Data (2026)
Ready to unlock more insights? AirROI provides access to advanced metrics and comprehensive Airbnb data for Leeds. Explore detailed analytics beyond this report to refine your investment strategy, optimize pricing, and maximize your vacation rental profits.
Explore Advanced MetricsLeeds Short-Term Rental Market Composition (2026): Property & Room Types
Room Type Distribution
Property Type Distribution
Market Composition Insights for Leeds
- The Leeds Airbnb market composition is heavily skewed towards Entire Home/Apt listings, which make up 89.3% of the 28 active rentals. This indicates strong guest preference for privacy and space.
- Looking at the property type distribution in Leeds, Outdoor/Unique properties are the most common (46.4%), reflecting the local real estate landscape.
- Houses represent a significant 35.7% portion, catering likely to families or larger groups.
- The presence of 7.1% Hotel/Boutique listings indicates integration with traditional hospitality.
- Smaller segments like others (combined 3.6%) offer potential for unique stay experiences.
Leeds Airbnb Room Capacity Analysis (2026): Bedroom Distribution
Distribution of Listings by Number of Bedrooms
Room Capacity Insights for Leeds
- The dominant room capacity in Leeds is 1 bedroom listings, making up 64.3% of the market. This suggests a strong demand for properties suitable for couples or solo travelers.
- Together, 1 bedroom and 3 bedrooms properties represent 82.2% of the active Airbnb listings in Leeds, indicating a high concentration in these sizes.
- With over half the market (64.3%) consisting of studios or 1-bedroom units, Leeds is particularly well-suited for individuals or couples.
- A significant 25.0% of listings offer 3+ bedrooms, catering to larger groups and families seeking more space in Leeds.
Leeds Vacation Rental Guest Capacity Trends (2026)
Distribution of Listings by Guest Capacity
Guest Capacity Insights for Leeds
- The most common guest capacity trend in Leeds vacation rentals is listings accommodating 2 guests (25%). This suggests the primary traveler segment is likely couples or solo travelers.
- Properties designed for 2 guests and 8+ guests dominate the Leeds STR market, accounting for 46.4% of listings.
- 35.7% of properties accommodate 6+ guests, serving the market segment for larger families or group travel in Leeds.
- On average, properties in Leeds are equipped to host 4.4 guests.
Leeds Airbnb Booking Patterns (2026): Available vs. Booked Days
Available Days Distribution
Booked Days Distribution
Booking Pattern Insights for Leeds
- The most common availability pattern in Leeds falls within the 91-180 days range, representing 32.1% of listings. This suggests many properties have significant open periods on their calendars.
- Approximately 64.2% of listings show high availability (181+ days open annually), indicating potential for increased bookings or specific owner usage patterns.
- For booked days, the 181-270 days range is most frequent in Leeds (35.7%), reflecting common guest stay durations or potential owner blocking patterns.
- A notable 39.3% of properties secure long booking periods (181+ days booked per year), highlighting successful long-term rental strategies or significant owner usage.
Leeds Airbnb Minimum Stay Requirements Analysis
Distribution of Listings by Minimum Night Requirement
1 Night
15 listings
53.6% of total
2 Nights
3 listings
10.7% of total
3 Nights
1 listings
3.6% of total
4-6 Nights
1 listings
3.6% of total
30+ Nights
8 listings
28.6% of total
Key Insights
- The most prevalent minimum stay requirement in Leeds is 1 Night, adopted by 53.6% of listings. This highlights the market's preference for shorter, flexible bookings.
- A strong majority (64.3%) of the Leeds Airbnb data shows acceptance of very short stays (1-2 nights), indicating a dynamic, high-turnover market.
- A significant segment (28.6%) caters to monthly stays (30+ nights) in Leeds, pointing to opportunities in the extended-stay market.
Recommendations
- Align with the market by considering a 1 Night minimum stay, as 53.6% of Leeds hosts use this setting.
- Explore offering discounts for stays of 30+ nights to attract the 28.6% of the market seeking extended stays.
- Adjust minimum nights based on seasonality – potentially shorter during low season and longer during peak demand periods in Leeds.
Leeds Airbnb Cancellation Policy Trends Analysis (2026)
Super Strict 30 Days
1 listings
3.6% of total
Flexible
10 listings
35.7% of total
Moderate
13 listings
46.4% of total
Firm
4 listings
14.3% of total
Cancellation Policy Insights for Leeds
- The prevailing Airbnb cancellation policy trend in Leeds is Moderate, used by 46.4% of listings.
- The market strongly favors guest-friendly terms, with 82.1% of listings offering Flexible or Moderate policies. This suggests guests in Leeds may expect booking flexibility.
Recommendations for Hosts
- Consider adopting a Moderate policy to align with the 46.4% market standard in Leeds.
- Regularly review your cancellation policy against competitors and market demand shifts in Leeds.
Leeds STR Booking Lead Time Analysis (2026)
Average Booking Lead Time by Month
Booking Lead Time Insights for Leeds
- The overall average booking lead time for vacation rentals in Leeds is 39 days.
- Guests book furthest in advance for stays during October (average 60 days), likely coinciding with peak travel demand or local events.
- The shortest booking windows occur for stays in January (average 26 days), indicating more last-minute travel plans during this time.
- Seasonally, Summer (48 days avg.) sees the longest lead times, while Winter (32 days avg.) has the shortest, reflecting typical travel planning cycles.
Recommendations for Hosts
- Use the overall average lead time (39 days) as a baseline for your pricing and availability strategy in Leeds.
- For October stays, consider implementing length-of-stay discounts or slightly higher rates for bookings made less than 60 days out to capitalize on advance planning.
- Target marketing efforts for the Summer season well in advance (at least 48 days) to capture early planners.
- Monitor your own booking lead times against these Leeds averages to identify opportunities for dynamic pricing adjustments.
Popular & Essential Airbnb Amenities in Leeds (2026)
Amenity Prevalence
Amenity Insights for Leeds
- Essential amenities in Leeds that guests expect include: Wifi, Air conditioning, Free parking on premises, Hot water. Lacking these (any) could significantly impact bookings.
- Popular amenities like Bed linens, Shampoo, Fire extinguisher are common but not universal. Offering these can provide a competitive edge.
Recommendations for Hosts
- Ensure your listing includes all essential amenities for Leeds: Wifi, Air conditioning, Free parking on premises, Hot water.
- Prioritize adding missing essentials: Hot water.
- Consider adding popular differentiators like Bed linens or Shampoo to increase appeal.
- Highlight unique or less common amenities you offer (e.g., hot tub, dedicated workspace, EV charger) in your listing description and photos.
- Regularly check competitor amenities in Leeds to stay competitive.
Leeds Airbnb Guest Demographics & Profile Analysis (2026)
Guest Profile Summary for Leeds
- The typical guest profile for Airbnb in Leeds consists of primarily domestic travelers (95%), often arriving from nearby Los Angeles, typically belonging to the Post-2000s (Gen Z/Alpha) group (50%), primarily speaking English or Spanish.
- Domestic travelers account for 94.6% of guests.
- Key international markets include United States (94.6%) and Canada (2%).
- Top languages spoken are English (66.7%) followed by Spanish (13.6%).
- A significant demographic segment is the Post-2000s (Gen Z/Alpha) group, representing 50% of guests.
Recommendations for Hosts
- Target domestic marketing efforts towards travelers from Los Angeles and Salt Lake City.
- Tailor amenities and listing descriptions to appeal to the dominant Post-2000s (Gen Z/Alpha) demographic (e.g., highlight fast WiFi, smart home features, local guides).
- Highlight unique local experiences or amenities relevant to the primary guest profile.
- Consider seasonal promotions aligned with peak travel times for key origin markets.
Nearby Short-Term Rental Market Comparison
How does the Leeds Airbnb market stack up against its neighbors? Compare key performance metrics like average monthly revenue, ADR, and occupancy rates in surrounding areas to understand the broader regional STR landscape.
| Market | Active Properties | Monthly Revenue | Daily Rate | Avg. Occupancy |
|---|---|---|---|---|
| Springdale | 135 | $5,417 | $457.31 | 46% |
| Rockville | 22 | $4,535 | $488.30 | 33% |
| Hurricane | 730 | $3,797 | $329.21 | 45% |
| Santa Clara | 279 | $3,789 | $427.47 | 36% |
| Orderville | 256 | $3,275 | $321.28 | 38% |
| Alton | 45 | $3,237 | $279.82 | 45% |
| Washington | 727 | $3,087 | $298.55 | 40% |
| Virgin | 112 | $2,969 | $294.50 | 39% |
| La Verkin | 191 | $2,946 | $206.59 | 51% |
| Mesquite | 138 | $2,891 | $250.63 | 46% |