Kane County Airbnb Market Analysis 2026: Short Term Rental Data & Vacation Rental Statistics in Utah, United States
Is Airbnb profitable in Kane County in 2026? Explore comprehensive Airbnb analytics for Kane County, Utah, United States to uncover income potential. This 2026 STR market report for Kane County, based on AirROI data from February 2025 to January 2026, reveals key trends in the niche market of 29 active listings.
Whether you're considering an Airbnb investment in Kane County, optimizing your existing vacation rental, or exploring rental arbitrage opportunities, understanding the Kane County Airbnb data is crucial. Leveraging the low regulation environment is key to maximizing your short term rental income potential. Let's dive into the specifics.
Key Kane County Airbnb Performance Metrics Overview
Monthly Airbnb Revenue Variations & Income Potential in Kane County (2026)
Understanding the monthly revenue variations for Airbnb listings in Kane County is key to maximizing your short term rental income potential. Seasonality significantly impacts earnings. Our analysis, based on data from the past 12 months, shows that the peak revenue month for STRs in Kane County is typically December, while February often presents the lowest earnings, highlighting opportunities for strategic pricing adjustments during shoulder and low seasons. Explore the typical Airbnb income in Kane County across different performance tiers:
- Best-in-class properties (Top 10%) achieve $6,611+ monthly, often utilizing dynamic pricing and superior guest experiences.
- Strong performing properties (Top 25%) earn $4,029 or more, indicating effective management and desirable locations/amenities.
- Typical properties (Median) generate around $2,530 per month, representing the average market performance.
- Entry-level properties (Bottom 25%) see earnings around $1,172, often with potential for optimization.
Average Monthly Airbnb Earnings Trend in Kane County
Kane County Airbnb Occupancy Rate Trends (2026)
Maximize your bookings by understanding the Kane County STR occupancy trends. Seasonal demand shifts significantly influence how often properties are booked. Typically, Aprilsees the highest demand (peak season occupancy), while February experiences the lowest (low season). Effective strategies, like adjusting minimum stays or offering promotions, can boost occupancy during slower periods. Here's how different property tiers perform in Kane County:
- Best-in-class properties (Top 10%) achieve 75%+ occupancy, indicating high desirability and potentially optimized availability.
- Strong performing properties (Top 25%) maintain 53% or higher occupancy, suggesting good market fit and guest satisfaction.
- Typical properties (Median) have an occupancy rate around 31%.
- Entry-level properties (Bottom 25%) average 14% occupancy, potentially facing higher vacancy.
Average Monthly Occupancy Rate Trend in Kane County
Average Daily Rate (ADR) Airbnb Trends in Kane County (2026)
Effective short term rental pricing strategy in Kane County involves understanding monthly ADR fluctuations. The Average Daily Rate (ADR) for Airbnb in Kane County typically peaks in December and dips lowest during August. Leveraging Airbnb dynamic pricing tools or strategies based on this seasonality can significantly boost revenue. Here's a look at the typical nightly rates achieved:
- Best-in-class properties (Top 10%) command rates of $509+ per night, often due to premium features or locations.
- Strong performing properties (Top 25%) achieve nightly rates of $348 or more.
- Typical properties (Median) charge around $224 per night.
- Entry-level properties (Bottom 25%) earn around $180 per night.
Average Daily Rate (ADR) Trend by Month in Kane County
Get Live Kane County Market Intelligence 👇

Explore Real-time Analytics
Airbnb Seasonality Analysis & Trends in Kane County (2026)
Peak Season (December, May, January)
- Revenue averages $4,038 per month
- Occupancy rates average 38.4%
- Daily rates average $312
Shoulder Season
- Revenue averages $3,273 per month
- Occupancy maintains around 42.3%
- Daily rates hold near $295
Low Season (February, March, September)
- Revenue drops to average $2,220 per month
- Occupancy decreases to average 24.0%
- Daily rates adjust to average $289
Seasonality Insights for Kane County
- The Airbnb seasonality in Kane County shows highly seasonal trends requiring careful strategy. While the sections above show seasonal averages, it's also insightful to look at the extremes:
- During the high season, the absolute peak month showcases Kane County's highest earning potential, with monthly revenues capable of climbing to $4,867, occupancy reaching a high of 52.2%, and ADRs peaking at $331.
- Conversely, the slowest single month of the year, typically falling within the low season, marks the market's lowest point. In this month, revenue might dip to $1,628, occupancy could drop to 12.9%, and ADRs may adjust down to $273.
- Understanding both the seasonal averages and these monthly peaks and troughs in revenue, occupancy, and ADR is crucial for maximizing your Airbnb profit potential in Kane County.
Seasonal Strategies for Maximizing Profit
- Peak Season: Maximize revenue through premium pricing and potentially longer minimum stays. Ensure high availability.
- Low Season: Offer competitive pricing, special promotions (e.g., extended stay discounts), and flexible cancellation policies. Target off-season travelers like remote workers or budget-conscious guests.
- Shoulder Seasons: Implement dynamic pricing that balances peak and low rates. Target weekend travelers or specific events. Offer slightly more flexible terms than peak season.
- Regularly analyze your own performance against these Kane County seasonality benchmarks and adjust your pricing and availability strategy accordingly.
Best Areas for Airbnb Investment in Kane County (2026)
Exploring the top neighborhoods for short-term rentals in Kane County? This section highlights key areas, outlining why they are attractive for hosts and guests, along with notable local attractions. Consider these locations based on your target guest profile and investment strategy.
| Neighborhood / Area | Why Host Here? (Target Guests & Appeal) | Key Attractions & Landmarks |
|---|---|---|
| Park City | Famous ski resort town known for its world-class slopes and vibrant downtown. Ideal for both winter and summer tourism, attracting visitors year-round seeking outdoor adventures and festivals. | Park City Mountain Resort, Deer Valley Resort, Main Street, Sundance Film Festival, Park City Golf Club, Utah Olympic Park |
| Springdale | Gateway to Zion National Park, offering stunning views and outdoor activities. Attracts nature lovers and adventure seekers looking to explore the park's unique red rock landscape and trails. | Zion National Park, Zion Canyon Scenic Drive, Emerald Pools Trail, Angels Landing, Zion Human History Museum |
| St. George | Rapidly growing city with a warm climate and plenty of recreational opportunities. Popular for golfing, hiking, and proximity to several national parks, making it attractive to tourists and retirees alike. | Snow Canyon State Park, Red Cliffs Desert Reserve, St. George Historic District, Tuacahn Amphitheatre, Dixie State University |
| Hurricane | Close to Zion National Park and surrounded by beautiful scenery. It's an affordable option for visitors looking to explore the outdoor offerings of southern Utah. | Zion National Park, Sand Hollow State Park, Hurricane Canal Trail, Shooting Star Trail, The JEM Trail |
| Brian Head | A charming ski resort town known for its winter sports and mountain biking in summer. Ideal for visitors seeking adventure and a cozy mountain getaway. | Brian Head Resort, Cedar Breaks National Monument, Navajo Lake, Bike park trails, Alpine skiing |
| Fish Springs | A hidden gem for those seeking solitude and a unique experience in nature. Attracts nature lovers who enjoy off-the-beaten-path destinations. | Fish Springs National Wildlife Refuge, Great Salt Lake, Wildlife watching, Photography opportunities, Outdoor exploration |
| Tooele | A growing city with access to several recreational areas and national parks. It offers a more affordable stay while still being close to major attractions in the region. | Stansbury Island, Deseret Peak Wilderness, Tooele Valley Railroad Museum, Great Salt Lake State Park, Big Rock Candy Mountain |
| Sandy | Located near Salt Lake City, providing easy access to both urban and outdoor experiences. A family-friendly area with parks and recreational facilities. | Little Cottonwood Canyon, Snowbird Ski Resort, Wasatch Mountains, South Towne Center, Sandy Amphitheater |
Understanding Airbnb License Requirements & STR Laws in Kane County (2026)
While Kane County, Utah, United States currently shows low STR regulations, specific Airbnb license requirements might still exist or change. Always verify the latest short term rental regulations and Airbnb license requirements directly with local government authorities for Kane County to ensure full compliance before hosting.
(Source: AirROI data, 2026, finding no licensed listings among those analyzed)
Top Performing Airbnb Properties in Kane County (2026)
Benchmark your potential! Explore examples of top-performing Airbnb properties in Kane Countybased on Trailing Twelve Month (TTM) revenue. Analyze their characteristics, revenue, occupancy rate, and ADR to understand what drives success in this market.
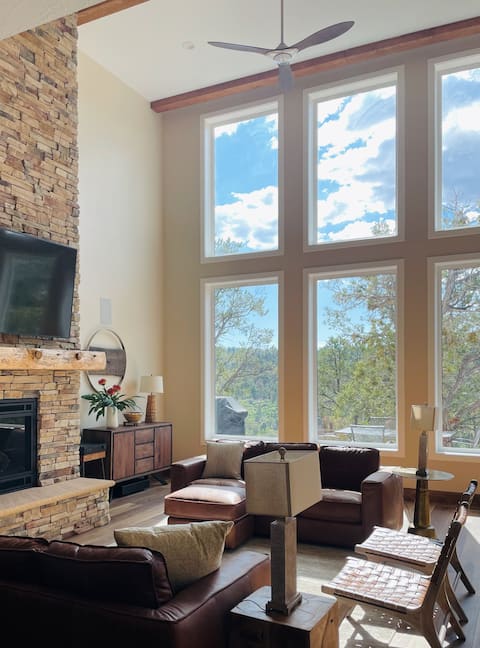
Zion Escape – Hot Tub, Wildlife & Canyon Views
Entire Place • 5 bedrooms

2 Lodges for Families, Friends & Weddings
Entire Place • 6 bedrooms

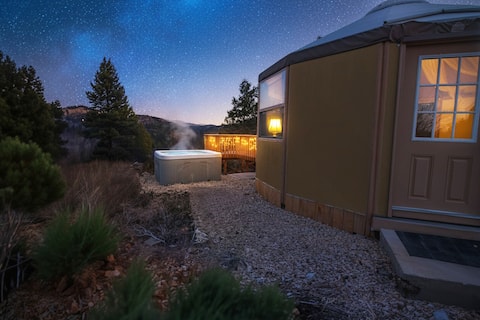
#2 Clifftop View Yurt HOT TUB Between Zion/Bryce
Entire Place • 1 bedroom

#6 Clifftop View Yurt HOT TUB Between Zion/Bryce
Entire Place • 1 bedroom
#4 Clifftop View Yurt HOT TUB Between Zion/Bryce
Entire Place • 1 bedroom
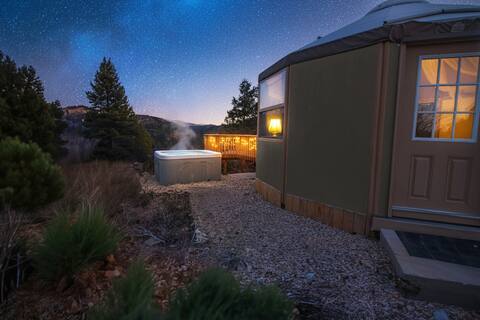
#3 Clifftop View Yurt HOT TUB Between Zion/Bryce
Entire Place • 1 bedroom
Note: Performance varies based on location, size, amenities, seasonality, and management quality. Data reflects the past 12 months.
Top Performing Airbnb Hosts in Kane County (2026)
Learn from the best! This table showcases top-performing Airbnb hosts in Kane County based on the number of properties managed and estimated total revenue over the past year. Analyze their scale and performance metrics.
| Host Name | Properties | Grossing Revenue | Stay Reviews | Avg Rating |
|---|---|---|---|---|
| James | 6 | $211,330 | 1317 | 4.96/5.0 |
| Jake | 10 | $144,483 | 603 | 4.62/5.0 |
| Robert | 6 | $99,719 | 189 | 4.99/5.0 |
| Nick & Ciera | 2 | $93,046 | 13 | 5.00/5.0 |
| Patricia | 1 | $81,966 | 17 | 5.00/5.0 |
| DeAnn | 1 | $23,000 | 192 | 4.91/5.0 |
| Duck Creek Management | 2 | $19,425 | 25 | 4.93/5.0 |
| Mark | 1 | $7,314 | 9 | 5.00/5.0 |
Analyzing the strategies of top hosts, such as their property selection, pricing, and guest communication, can offer valuable lessons for optimizing your own Airbnb operations in Kane County.
Dive Deeper: Advanced Kane County STR Market Data (2026)
Ready to unlock more insights? AirROI provides access to advanced metrics and comprehensive Airbnb data for Kane County. Explore detailed analytics beyond this report to refine your investment strategy, optimize pricing, and maximize your vacation rental profits.
Explore Advanced MetricsKane County Short-Term Rental Market Composition (2026): Property & Room Types
Room Type Distribution
Property Type Distribution
Market Composition Insights for Kane County
- The Kane County Airbnb market composition is heavily skewed towards Entire Home/Apt listings, which make up 82.8% of the 29 active rentals. This indicates strong guest preference for privacy and space.
- Looking at the property type distribution in Kane County, Outdoor/Unique properties are the most common (96.6%), reflecting the local real estate landscape.
- Smaller segments like house (combined 3.4%) offer potential for unique stay experiences.
Kane County Airbnb Room Capacity Analysis (2026): Bedroom Distribution
Distribution of Listings by Number of Bedrooms
Room Capacity Insights for Kane County
- The dominant room capacity in Kane County is 1 bedroom listings, making up 48.3% of the market. This suggests a strong demand for properties suitable for couples or solo travelers.
- Together, 1 bedroom and 2 bedrooms properties represent 72.4% of the active Airbnb listings in Kane County, indicating a high concentration in these sizes.
Kane County Vacation Rental Guest Capacity Trends (2026)
Distribution of Listings by Guest Capacity
Guest Capacity Insights for Kane County
- The most common guest capacity trend in Kane County vacation rentals is listings accommodating 8+ guests (34.5%). This suggests the primary traveler segment is likely larger groups.
- Properties designed for 8+ guests and 6 guests dominate the Kane County STR market, accounting for 62.1% of listings.
- 62.1% of properties accommodate 6+ guests, serving the market segment for larger families or group travel in Kane County.
- On average, properties in Kane County are equipped to host 5.7 guests.
Kane County Airbnb Booking Patterns (2026): Available vs. Booked Days
Available Days Distribution
Booked Days Distribution
Booking Pattern Insights for Kane County
- The most common availability pattern in Kane County falls within the 271-366 days range, representing 55.2% of listings. This suggests many properties have significant open periods on their calendars.
- Approximately 96.6% of listings show high availability (181+ days open annually), indicating potential for increased bookings or specific owner usage patterns.
- For booked days, the 91-180 days range is most frequent in Kane County (37.9%), reflecting common guest stay durations or potential owner blocking patterns.
- A notable 6.9% of properties secure long booking periods (181+ days booked per year), highlighting successful long-term rental strategies or significant owner usage.
Kane County Airbnb Minimum Stay Requirements Analysis
Distribution of Listings by Minimum Night Requirement
1 Night
13 listings
44.8% of total
2 Nights
8 listings
27.6% of total
3 Nights
3 listings
10.3% of total
30+ Nights
5 listings
17.2% of total
Key Insights
- The most prevalent minimum stay requirement in Kane County is 1 Night, adopted by 44.8% of listings. This highlights the market's preference for shorter, flexible bookings.
- A strong majority (72.4%) of the Kane County Airbnb data shows acceptance of very short stays (1-2 nights), indicating a dynamic, high-turnover market.
- A significant segment (17.2%) caters to monthly stays (30+ nights) in Kane County, pointing to opportunities in the extended-stay market.
Recommendations
- Align with the market by considering a 1 Night minimum stay, as 44.8% of Kane County hosts use this setting.
- Explore offering discounts for stays of 30+ nights to attract the 17.2% of the market seeking extended stays.
- Adjust minimum nights based on seasonality – potentially shorter during low season and longer during peak demand periods in Kane County.
Kane County Airbnb Cancellation Policy Trends Analysis (2026)
Super Strict 30 Days
2 listings
6.9% of total
Limited
1 listings
3.4% of total
Flexible
1 listings
3.4% of total
Moderate
15 listings
51.7% of total
Firm
8 listings
27.6% of total
Strict
2 listings
6.9% of total
Cancellation Policy Insights for Kane County
- The prevailing Airbnb cancellation policy trend in Kane County is Moderate, used by 51.7% of listings.
- There's a relatively balanced mix between guest-friendly (55.1%) and stricter (34.5%) policies, offering choices for different guest needs.
- Strict cancellation policies are quite rare (6.9%), potentially making listings with this policy less competitive unless justified by high demand or property type.
Recommendations for Hosts
- Consider adopting a Moderate policy to align with the 51.7% market standard in Kane County.
- Using a Strict policy might deter some guests, as only 6.9% of listings use it. Evaluate if potential revenue protection outweighs possible lower booking rates.
- Regularly review your cancellation policy against competitors and market demand shifts in Kane County.
Kane County STR Booking Lead Time Analysis (2026)
Average Booking Lead Time by Month
Booking Lead Time Insights for Kane County
- The overall average booking lead time for vacation rentals in Kane County is 83 days.
- Guests book furthest in advance for stays during May (average 125 days), likely coinciding with peak travel demand or local events.
- The shortest booking windows occur for stays in January (average 24 days), indicating more last-minute travel plans during this time.
- Seasonally, Spring (108 days avg.) sees the longest lead times, while Winter (32 days avg.) has the shortest, reflecting typical travel planning cycles.
Recommendations for Hosts
- Use the overall average lead time (83 days) as a baseline for your pricing and availability strategy in Kane County.
- For May stays, consider implementing length-of-stay discounts or slightly higher rates for bookings made less than 125 days out to capitalize on advance planning.
- Target marketing efforts for the Spring season well in advance (at least 108 days) to capture early planners.
- Monitor your own booking lead times against these Kane County averages to identify opportunities for dynamic pricing adjustments.
Popular & Essential Airbnb Amenities in Kane County (2026)
Amenity Prevalence
Amenity Insights for Kane County
- Essential amenities in Kane County that guests expect include: Heating, Free parking on premises. Lacking these (any) could significantly impact bookings.
- Popular amenities like Bed linens, Wifi, BBQ grill are common but not universal. Offering these can provide a competitive edge.
- Warning: Wifi is not universally provided but is considered essential globally. Ensure reliable Wifi is offered.
Recommendations for Hosts
- Ensure your listing includes all essential amenities for Kane County: Heating, Free parking on premises.
- Consider adding popular differentiators like Bed linens or Wifi to increase appeal.
- Highlight unique or less common amenities you offer (e.g., hot tub, dedicated workspace, EV charger) in your listing description and photos.
- Regularly check competitor amenities in Kane County to stay competitive.
Kane County Airbnb Guest Demographics & Profile Analysis (2026)
Guest Profile Summary for Kane County
- The typical guest profile for Airbnb in Kane County consists of primarily domestic travelers (93%), often arriving from nearby Las Vegas, typically belonging to the Post-2000s (Gen Z/Alpha) group (50%), primarily speaking English or Spanish.
- Domestic travelers account for 92.9% of guests.
- Key international markets include United States (92.9%) and Canada (0.8%).
- Top languages spoken are English (68.5%) followed by Spanish (13.1%).
- A significant demographic segment is the Post-2000s (Gen Z/Alpha) group, representing 50% of guests.
Recommendations for Hosts
- Target domestic marketing efforts towards travelers from Las Vegas and New York.
- Tailor amenities and listing descriptions to appeal to the dominant Post-2000s (Gen Z/Alpha) demographic (e.g., highlight fast WiFi, smart home features, local guides).
- Highlight unique local experiences or amenities relevant to the primary guest profile.
- Consider seasonal promotions aligned with peak travel times for key origin markets.
Nearby Short-Term Rental Market Comparison
How does the Kane County Airbnb market stack up against its neighbors? Compare key performance metrics like average monthly revenue, ADR, and occupancy rates in surrounding areas to understand the broader regional STR landscape.
| Market | Active Properties | Monthly Revenue | Daily Rate | Avg. Occupancy |
|---|---|---|---|---|
| Springdale | 135 | $5,417 | $457.31 | 46% |
| Rockville | 22 | $4,535 | $488.30 | 33% |
| Hurricane | 730 | $3,797 | $329.21 | 45% |
| Santa Clara | 279 | $3,789 | $427.47 | 36% |
| Greenehaven | 48 | $3,740 | $333.15 | 44% |
| Teasdale | 34 | $3,558 | $266.71 | 50% |
| Orderville | 256 | $3,275 | $321.28 | 38% |
| Alton | 45 | $3,237 | $279.82 | 45% |
| Washington | 727 | $3,087 | $298.55 | 40% |
| Virgin | 112 | $2,969 | $294.50 | 39% |