Hatch Airbnb Market Analysis 2026: Short Term Rental Data & Vacation Rental Statistics in Utah, United States
Is Airbnb profitable in Hatch in 2026? Explore comprehensive Airbnb analytics for Hatch, Utah, United States to uncover income potential. This 2026 STR market report for Hatch, based on AirROI data from February 2025 to January 2026, reveals key trends in the niche market of 62 active listings.
Whether you're considering an Airbnb investment in Hatch, optimizing your existing vacation rental, or exploring rental arbitrage opportunities, understanding the Hatch Airbnb data is crucial. Leveraging the low regulation environment is key to maximizing your short term rental income potential. Let's dive into the specifics.
Key Hatch Airbnb Performance Metrics Overview
Monthly Airbnb Revenue Variations & Income Potential in Hatch (2026)
Understanding the monthly revenue variations for Airbnb listings in Hatch is key to maximizing your short term rental income potential. Seasonality significantly impacts earnings. Our analysis, based on data from the past 12 months, shows that the peak revenue month for STRs in Hatch is typically October, while February often presents the lowest earnings, highlighting opportunities for strategic pricing adjustments during shoulder and low seasons. Explore the typical Airbnb income in Hatch across different performance tiers:
- Best-in-class properties (Top 10%) achieve $5,585+ monthly, often utilizing dynamic pricing and superior guest experiences.
- Strong performing properties (Top 25%) earn $3,956 or more, indicating effective management and desirable locations/amenities.
- Typical properties (Median) generate around $2,477 per month, representing the average market performance.
- Entry-level properties (Bottom 25%) see earnings around $1,213, often with potential for optimization.
Average Monthly Airbnb Earnings Trend in Hatch
Hatch Airbnb Occupancy Rate Trends (2026)
Maximize your bookings by understanding the Hatch STR occupancy trends. Seasonal demand shifts significantly influence how often properties are booked. Typically, Septembersees the highest demand (peak season occupancy), while January experiences the lowest (low season). Effective strategies, like adjusting minimum stays or offering promotions, can boost occupancy during slower periods. Here's how different property tiers perform in Hatch:
- Best-in-class properties (Top 10%) achieve 74%+ occupancy, indicating high desirability and potentially optimized availability.
- Strong performing properties (Top 25%) maintain 62% or higher occupancy, suggesting good market fit and guest satisfaction.
- Typical properties (Median) have an occupancy rate around 43%.
- Entry-level properties (Bottom 25%) average 22% occupancy, potentially facing higher vacancy.
Average Monthly Occupancy Rate Trend in Hatch
Average Daily Rate (ADR) Airbnb Trends in Hatch (2026)
Effective short term rental pricing strategy in Hatch involves understanding monthly ADR fluctuations. The Average Daily Rate (ADR) for Airbnb in Hatch typically peaks in September and dips lowest during February. Leveraging Airbnb dynamic pricing tools or strategies based on this seasonality can significantly boost revenue. Here's a look at the typical nightly rates achieved:
- Best-in-class properties (Top 10%) command rates of $388+ per night, often due to premium features or locations.
- Strong performing properties (Top 25%) achieve nightly rates of $247 or more.
- Typical properties (Median) charge around $167 per night.
- Entry-level properties (Bottom 25%) earn around $135 per night.
Average Daily Rate (ADR) Trend by Month in Hatch
Get Live Hatch Market Intelligence 👇

Explore Real-time Analytics
Airbnb Seasonality Analysis & Trends in Hatch (2026)
Peak Season (October, September, June)
- Revenue averages $3,813 per month
- Occupancy rates average 56.4%
- Daily rates average $244
Shoulder Season
- Revenue averages $2,880 per month
- Occupancy maintains around 43.6%
- Daily rates hold near $224
Low Season (January, February, November)
- Revenue drops to average $1,854 per month
- Occupancy decreases to average 27.9%
- Daily rates adjust to average $227
Seasonality Insights for Hatch
- The Airbnb seasonality in Hatch shows highly seasonal trends requiring careful strategy. While the sections above show seasonal averages, it's also insightful to look at the extremes:
- During the high season, the absolute peak month showcases Hatch's highest earning potential, with monthly revenues capable of climbing to $4,025, occupancy reaching a high of 59.8%, and ADRs peaking at $257.
- Conversely, the slowest single month of the year, typically falling within the low season, marks the market's lowest point. In this month, revenue might dip to $1,547, occupancy could drop to 20.7%, and ADRs may adjust down to $206.
- Understanding both the seasonal averages and these monthly peaks and troughs in revenue, occupancy, and ADR is crucial for maximizing your Airbnb profit potential in Hatch.
Seasonal Strategies for Maximizing Profit
- Peak Season: Maximize revenue through premium pricing and potentially longer minimum stays. Ensure high availability.
- Low Season: Offer competitive pricing, special promotions (e.g., extended stay discounts), and flexible cancellation policies. Target off-season travelers like remote workers or budget-conscious guests.
- Shoulder Seasons: Implement dynamic pricing that balances peak and low rates. Target weekend travelers or specific events. Offer slightly more flexible terms than peak season.
- Regularly analyze your own performance against these Hatch seasonality benchmarks and adjust your pricing and availability strategy accordingly.
Best Areas for Airbnb Investment in Hatch (2026)
Exploring the top neighborhoods for short-term rentals in Hatch? This section highlights key areas, outlining why they are attractive for hosts and guests, along with notable local attractions. Consider these locations based on your target guest profile and investment strategy.
| Neighborhood / Area | Why Host Here? (Target Guests & Appeal) | Key Attractions & Landmarks |
|---|---|---|
| Zion National Park | A world-renowned national park with stunning landscapes, hiking trails, and outdoor activities. It's a prime spot for tourists seeking adventure and natural beauty, making it ideal for Airbnb hosting. | Zion Canyon, Angels Landing, The Narrows, Zion-Mount Carmel Highway, Observation Point |
| Bryce Canyon National Park | Known for its unique rock formations and breathtaking vistas, Bryce Canyon attracts visitors from around the world. Investing in Airbnb here can cater to visitors looking to explore this geological wonder. | Bryce Amphitheater, Queen's Garden Trail, Sunset Point, Inspiration Point, Bryce Canyon Scenic Drive |
| Salt Lake City | The capital of Utah, offering cultural attractions, dining, and proximity to outdoor activities. Ideal for hosting travelers who want to experience urban life and natural adventures. | Temple Square, Red Butte Garden, Utah Museum of Fine Arts, Hogle Zoo, Salt Lake City Public Library |
| Park City | A famous ski resort town that attracts visitors year-round for its winter sports and summer outdoor activities. Appeals to both ski enthusiasts and those seeking luxury accommodations. | Park City Mountain Resort, Deer Valley Resort, Main Street, Utah Olympic Park, Jordanelle State Park |
| Antelope Island State Park | Located in the Great Salt Lake, this unique park offers stunning scenery and wildlife viewing. It attracts nature lovers and photographers, making it suitable for Airbnb stays. | Buffalo Point, Delicate Arch, Antelope Island Marina, Birdwatching, Hiking Trails |
| Provo | Home to Brigham Young University and a vibrant college town atmosphere. This area is perfect for hosting students and families visiting the campus or attending events. | BYU Museum of Paleontology, Provo City Center Temple, Bridal Veil Falls, Utah Lake State Park, Provo River Parkway |
| Ogden | Known for its historic 25th Street and proximity to outdoor activities in the Wasatch Mountains. Attracts tourists who enjoy a combination of culture and outdoor sports. | Ogden Canyon, Snowbasin Resort, Historic 25th Street, TreeHouse Museum, George S. Eccles Dinosaur Park |
| Moab | The gateway to Arches and Canyonlands National Parks, Moab is a hotspot for outdoor enthusiasts. It offers breathtaking views and activities like hiking, mountain biking, and off-roading. | Arches National Park, Canyonlands National Park, Dead Horse Point State Park, Moab Jeep Rentals, Fiery Furnace |
Understanding Airbnb License Requirements & STR Laws in Hatch (2026)
While Hatch, Utah, United States currently shows low STR regulations, specific Airbnb license requirements might still exist or change. Always verify the latest short term rental regulations and Airbnb license requirements directly with local government authorities for Hatch to ensure full compliance before hosting.
(Source: AirROI data, 2026, finding no licensed listings among those analyzed)
Top Performing Airbnb Properties in Hatch (2026)
Benchmark your potential! Explore examples of top-performing Airbnb properties in Hatchbased on Trailing Twelve Month (TTM) revenue. Analyze their characteristics, revenue, occupancy rate, and ADR to understand what drives success in this market.
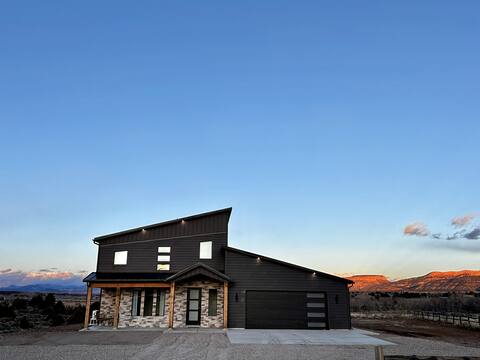
The Cliffs - Views, Zion NP & Bryce NP, Hot Tub
Entire Place • 3 bedrooms
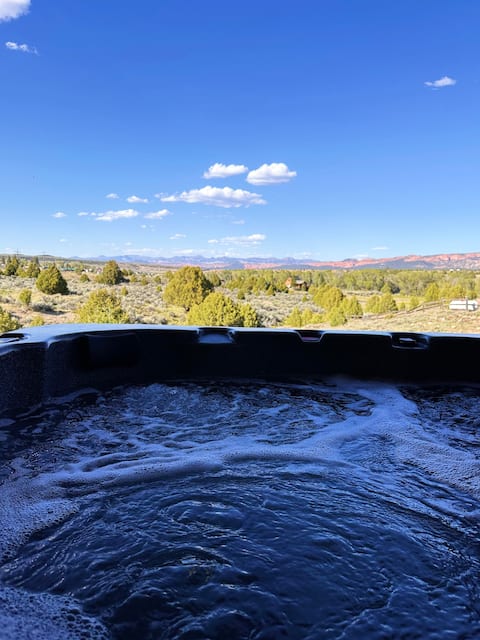
The Meadow - Secluded, Hot Tub, Views, Nat'l Parks
Entire Place • 3 bedrooms

Bryce, Zion, National and State Park Retreat
Entire Place • 3 bedrooms
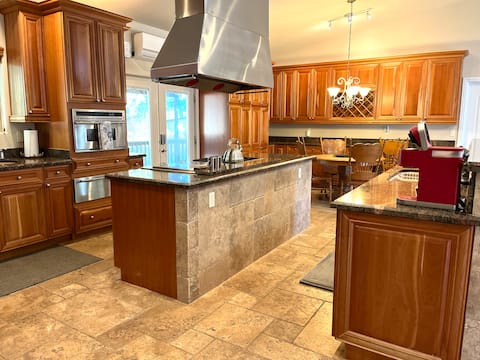
Lux River Retreat
Entire Place • 2 bedrooms
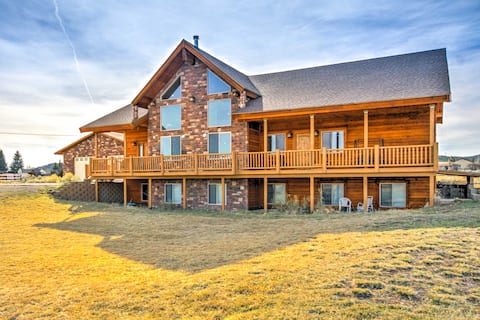
Rustic Bryce Canyon Home w/ Deck on Sevier River!
Entire Place • 3 bedrooms
Grand View Lodge - Spacious home w/ amazing views
Entire Place • 6 bedrooms
Note: Performance varies based on location, size, amenities, seasonality, and management quality. Data reflects the past 12 months.
Top Performing Airbnb Hosts in Hatch (2026)
Learn from the best! This table showcases top-performing Airbnb hosts in Hatch based on the number of properties managed and estimated total revenue over the past year. Analyze their scale and performance metrics.
| Host Name | Properties | Grossing Revenue | Stay Reviews | Avg Rating |
|---|---|---|---|---|
| Nolan | 9 | $252,833 | 971 | 4.91/5.0 |
| Cianna | 3 | $198,921 | 128 | 5.00/5.0 |
| Gordon | 6 | $185,967 | 2445 | 4.94/5.0 |
| Family Time | 4 | $100,326 | 171 | 4.83/5.0 |
| Jean | 2 | $84,504 | 289 | 4.95/5.0 |
| Evolve | 3 | $78,389 | 137 | 4.84/5.0 |
| Linda | 1 | $69,586 | 51 | 4.96/5.0 |
| Mark | 1 | $69,280 | 35 | 4.91/5.0 |
| Bill | 1 | $53,772 | 263 | 4.86/5.0 |
| Corbin | 1 | $53,313 | 36 | 4.92/5.0 |
Analyzing the strategies of top hosts, such as their property selection, pricing, and guest communication, can offer valuable lessons for optimizing your own Airbnb operations in Hatch.
Dive Deeper: Advanced Hatch STR Market Data (2026)
Ready to unlock more insights? AirROI provides access to advanced metrics and comprehensive Airbnb data for Hatch. Explore detailed analytics beyond this report to refine your investment strategy, optimize pricing, and maximize your vacation rental profits.
Explore Advanced MetricsHatch Short-Term Rental Market Composition (2026): Property & Room Types
Room Type Distribution
Property Type Distribution
Market Composition Insights for Hatch
- The Hatch Airbnb market composition is heavily skewed towards Entire Home/Apt listings, which make up 87.1% of the 62 active rentals. This indicates strong guest preference for privacy and space.
- Looking at the property type distribution in Hatch, House properties are the most common (43.5%), reflecting the local real estate landscape.
- Houses represent a significant 43.5% portion, catering likely to families or larger groups.
- The presence of 6.5% Hotel/Boutique listings indicates integration with traditional hospitality.
- Smaller segments like others, unique stays (combined 3.2%) offer potential for unique stay experiences.
Hatch Airbnb Room Capacity Analysis (2026): Bedroom Distribution
Distribution of Listings by Number of Bedrooms
Room Capacity Insights for Hatch
- The dominant room capacity in Hatch is 1 bedroom listings, making up 33.9% of the market. This suggests a strong demand for properties suitable for couples or solo travelers.
- Together, 1 bedroom and 3 bedrooms properties represent 56.5% of the active Airbnb listings in Hatch, indicating a high concentration in these sizes.
- A significant 37.2% of listings offer 3+ bedrooms, catering to larger groups and families seeking more space in Hatch.
Hatch Vacation Rental Guest Capacity Trends (2026)
Distribution of Listings by Guest Capacity
Guest Capacity Insights for Hatch
- The most common guest capacity trend in Hatch vacation rentals is listings accommodating 8+ guests (30.6%). This suggests the primary traveler segment is likely larger groups.
- Properties designed for 8+ guests and 4 guests dominate the Hatch STR market, accounting for 59.6% of listings.
- 51.5% of properties accommodate 6+ guests, serving the market segment for larger families or group travel in Hatch.
- On average, properties in Hatch are equipped to host 5.2 guests.
Hatch Airbnb Booking Patterns (2026): Available vs. Booked Days
Available Days Distribution
Booked Days Distribution
Booking Pattern Insights for Hatch
- The most common availability pattern in Hatch falls within the 181-270 days range, representing 45.2% of listings. This suggests many properties have significant open periods on their calendars.
- Approximately 75.8% of listings show high availability (181+ days open annually), indicating potential for increased bookings or specific owner usage patterns.
- For booked days, the 91-180 days range is most frequent in Hatch (43.5%), reflecting common guest stay durations or potential owner blocking patterns.
- A notable 25.8% of properties secure long booking periods (181+ days booked per year), highlighting successful long-term rental strategies or significant owner usage.
Hatch Airbnb Minimum Stay Requirements Analysis
Distribution of Listings by Minimum Night Requirement
1 Night
30 listings
48.4% of total
2 Nights
16 listings
25.8% of total
3 Nights
2 listings
3.2% of total
30+ Nights
14 listings
22.6% of total
Key Insights
- The most prevalent minimum stay requirement in Hatch is 1 Night, adopted by 48.4% of listings. This highlights the market's preference for shorter, flexible bookings.
- A strong majority (74.2%) of the Hatch Airbnb data shows acceptance of very short stays (1-2 nights), indicating a dynamic, high-turnover market.
- A significant segment (22.6%) caters to monthly stays (30+ nights) in Hatch, pointing to opportunities in the extended-stay market.
Recommendations
- Align with the market by considering a 1 Night minimum stay, as 48.4% of Hatch hosts use this setting.
- Explore offering discounts for stays of 30+ nights to attract the 22.6% of the market seeking extended stays.
- Adjust minimum nights based on seasonality – potentially shorter during low season and longer during peak demand periods in Hatch.
Hatch Airbnb Cancellation Policy Trends Analysis (2026)
Flexible
14 listings
22.6% of total
Moderate
29 listings
46.8% of total
Firm
13 listings
21% of total
Strict
6 listings
9.7% of total
Cancellation Policy Insights for Hatch
- The prevailing Airbnb cancellation policy trend in Hatch is Moderate, used by 46.8% of listings.
- There's a relatively balanced mix between guest-friendly (69.4%) and stricter (30.7%) policies, offering choices for different guest needs.
- Strict cancellation policies are quite rare (9.7%), potentially making listings with this policy less competitive unless justified by high demand or property type.
Recommendations for Hosts
- Consider adopting a Moderate policy to align with the 46.8% market standard in Hatch.
- Using a Strict policy might deter some guests, as only 9.7% of listings use it. Evaluate if potential revenue protection outweighs possible lower booking rates.
- Regularly review your cancellation policy against competitors and market demand shifts in Hatch.
Hatch STR Booking Lead Time Analysis (2026)
Average Booking Lead Time by Month
Booking Lead Time Insights for Hatch
- The overall average booking lead time for vacation rentals in Hatch is 56 days.
- Guests book furthest in advance for stays during April (average 82 days), likely coinciding with peak travel demand or local events.
- The shortest booking windows occur for stays in January (average 19 days), indicating more last-minute travel plans during this time.
- Seasonally, Summer (72 days avg.) sees the longest lead times, while Winter (37 days avg.) has the shortest, reflecting typical travel planning cycles.
Recommendations for Hosts
- Use the overall average lead time (56 days) as a baseline for your pricing and availability strategy in Hatch.
- For April stays, consider implementing length-of-stay discounts or slightly higher rates for bookings made less than 82 days out to capitalize on advance planning.
- Target marketing efforts for the Summer season well in advance (at least 72 days) to capture early planners.
- Monitor your own booking lead times against these Hatch averages to identify opportunities for dynamic pricing adjustments.
Popular & Essential Airbnb Amenities in Hatch (2026)
Amenity Prevalence
Amenity Insights for Hatch
- Essential amenities in Hatch that guests expect include: Smoke alarm, Free parking on premises, Wifi, TV, Heating, Coffee maker. Lacking these (any) could significantly impact bookings.
- Popular amenities like Microwave, Essentials, Bed linens are common but not universal. Offering these can provide a competitive edge.
Recommendations for Hosts
- Ensure your listing includes all essential amenities for Hatch: Smoke alarm, Free parking on premises, Wifi, TV, Heating, Coffee maker.
- Prioritize adding missing essentials: Free parking on premises, Wifi, TV, Heating, Coffee maker.
- Consider adding popular differentiators like Microwave or Essentials to increase appeal.
- Highlight unique or less common amenities you offer (e.g., hot tub, dedicated workspace, EV charger) in your listing description and photos.
- Regularly check competitor amenities in Hatch to stay competitive.
Hatch Airbnb Guest Demographics & Profile Analysis (2026)
Guest Profile Summary for Hatch
- The typical guest profile for Airbnb in Hatch consists of primarily domestic travelers (86%), often arriving from nearby Las Vegas, typically belonging to the Post-2000s (Gen Z/Alpha) group (50%), primarily speaking English or Spanish.
- Domestic travelers account for 86.2% of guests.
- Key international markets include United States (86.2%) and Germany (2.1%).
- Top languages spoken are English (61.8%) followed by Spanish (9.5%).
- A significant demographic segment is the Post-2000s (Gen Z/Alpha) group, representing 50% of guests.
Recommendations for Hosts
- Target domestic marketing efforts towards travelers from Las Vegas and Salt Lake City.
- Tailor amenities and listing descriptions to appeal to the dominant Post-2000s (Gen Z/Alpha) demographic (e.g., highlight fast WiFi, smart home features, local guides).
- Highlight unique local experiences or amenities relevant to the primary guest profile.
- Consider seasonal promotions aligned with peak travel times for key origin markets.
Nearby Short-Term Rental Market Comparison
How does the Hatch Airbnb market stack up against its neighbors? Compare key performance metrics like average monthly revenue, ADR, and occupancy rates in surrounding areas to understand the broader regional STR landscape.
| Market | Active Properties | Monthly Revenue | Daily Rate | Avg. Occupancy |
|---|---|---|---|---|
| Springdale | 135 | $5,417 | $457.31 | 46% |
| Rockville | 22 | $4,535 | $488.30 | 33% |
| Hurricane | 730 | $3,797 | $329.21 | 45% |
| Santa Clara | 279 | $3,789 | $427.47 | 36% |
| Greenehaven | 48 | $3,740 | $333.15 | 44% |
| Teasdale | 34 | $3,558 | $266.71 | 50% |
| Orderville | 256 | $3,275 | $321.28 | 38% |
| Alton | 45 | $3,237 | $279.82 | 45% |
| Washington | 727 | $3,087 | $298.55 | 40% |
| Virgin | 112 | $2,969 | $294.50 | 39% |