Glendale Airbnb Market Analysis 2026: Short Term Rental Data & Vacation Rental Statistics in Utah, United States
Is Airbnb profitable in Glendale in 2026? Explore comprehensive Airbnb analytics for Glendale, Utah, United States to uncover income potential. This 2026 STR market report for Glendale, based on AirROI data from February 2025 to January 2026, reveals key trends in the niche market of 60 active listings.
Whether you're considering an Airbnb investment in Glendale, optimizing your existing vacation rental, or exploring rental arbitrage opportunities, understanding the Glendale Airbnb data is crucial. Leveraging the low regulation environment is key to maximizing your short term rental income potential. Let's dive into the specifics.
Key Glendale Airbnb Performance Metrics Overview
Monthly Airbnb Revenue Variations & Income Potential in Glendale (2026)
Understanding the monthly revenue variations for Airbnb listings in Glendale is key to maximizing your short term rental income potential. Seasonality significantly impacts earnings. Our analysis, based on data from the past 12 months, shows that the peak revenue month for STRs in Glendale is typically May, while February often presents the lowest earnings, highlighting opportunities for strategic pricing adjustments during shoulder and low seasons. Explore the typical Airbnb income in Glendale across different performance tiers:
- Best-in-class properties (Top 10%) achieve $6,133+ monthly, often utilizing dynamic pricing and superior guest experiences.
- Strong performing properties (Top 25%) earn $4,230 or more, indicating effective management and desirable locations/amenities.
- Typical properties (Median) generate around $2,462 per month, representing the average market performance.
- Entry-level properties (Bottom 25%) see earnings around $1,287, often with potential for optimization.
Average Monthly Airbnb Earnings Trend in Glendale
Glendale Airbnb Occupancy Rate Trends (2026)
Maximize your bookings by understanding the Glendale STR occupancy trends. Seasonal demand shifts significantly influence how often properties are booked. Typically, Octobersees the highest demand (peak season occupancy), while February experiences the lowest (low season). Effective strategies, like adjusting minimum stays or offering promotions, can boost occupancy during slower periods. Here's how different property tiers perform in Glendale:
- Best-in-class properties (Top 10%) achieve 76%+ occupancy, indicating high desirability and potentially optimized availability.
- Strong performing properties (Top 25%) maintain 61% or higher occupancy, suggesting good market fit and guest satisfaction.
- Typical properties (Median) have an occupancy rate around 42%.
- Entry-level properties (Bottom 25%) average 27% occupancy, potentially facing higher vacancy.
Average Monthly Occupancy Rate Trend in Glendale
Average Daily Rate (ADR) Airbnb Trends in Glendale (2026)
Effective short term rental pricing strategy in Glendale involves understanding monthly ADR fluctuations. The Average Daily Rate (ADR) for Airbnb in Glendale typically peaks in October and dips lowest during February. Leveraging Airbnb dynamic pricing tools or strategies based on this seasonality can significantly boost revenue. Here's a look at the typical nightly rates achieved:
- Best-in-class properties (Top 10%) command rates of $331+ per night, often due to premium features or locations.
- Strong performing properties (Top 25%) achieve nightly rates of $246 or more.
- Typical properties (Median) charge around $183 per night.
- Entry-level properties (Bottom 25%) earn around $134 per night.
Average Daily Rate (ADR) Trend by Month in Glendale
Get Live Glendale Market Intelligence 👇

Explore Real-time Analytics
Airbnb Seasonality Analysis & Trends in Glendale (2026)
Peak Season (May, October, June)
- Revenue averages $3,902 per month
- Occupancy rates average 55.5%
- Daily rates average $217
Shoulder Season
- Revenue averages $3,116 per month
- Occupancy maintains around 45.8%
- Daily rates hold near $202
Low Season (January, February, November)
- Revenue drops to average $2,272 per month
- Occupancy decreases to average 32.7%
- Daily rates adjust to average $195
Seasonality Insights for Glendale
- The Airbnb seasonality in Glendale shows highly seasonal trends requiring careful strategy. While the sections above show seasonal averages, it's also insightful to look at the extremes:
- During the high season, the absolute peak month showcases Glendale's highest earning potential, with monthly revenues capable of climbing to $4,129, occupancy reaching a high of 58.7%, and ADRs peaking at $225.
- Conversely, the slowest single month of the year, typically falling within the low season, marks the market's lowest point. In this month, revenue might dip to $1,897, occupancy could drop to 27.8%, and ADRs may adjust down to $178.
- Understanding both the seasonal averages and these monthly peaks and troughs in revenue, occupancy, and ADR is crucial for maximizing your Airbnb profit potential in Glendale.
Seasonal Strategies for Maximizing Profit
- Peak Season: Maximize revenue through premium pricing and potentially longer minimum stays. Ensure high availability.
- Low Season: Offer competitive pricing, special promotions (e.g., extended stay discounts), and flexible cancellation policies. Target off-season travelers like remote workers or budget-conscious guests.
- Shoulder Seasons: Implement dynamic pricing that balances peak and low rates. Target weekend travelers or specific events. Offer slightly more flexible terms than peak season.
- Regularly analyze your own performance against these Glendale seasonality benchmarks and adjust your pricing and availability strategy accordingly.
Best Areas for Airbnb Investment in Glendale (2026)
Exploring the top neighborhoods for short-term rentals in Glendale? This section highlights key areas, outlining why they are attractive for hosts and guests, along with notable local attractions. Consider these locations based on your target guest profile and investment strategy.
| Neighborhood / Area | Why Host Here? (Target Guests & Appeal) | Key Attractions & Landmarks |
|---|---|---|
| Fish Springs National Wildlife Refuge | A stunning natural area known for its diverse wildlife and scenic landscapes. Great for nature lovers and bird watchers seeking a peaceful retreat. | Birdwatching, Wildlife photography, Hiking trails, Stargazing, Nature observation |
| Antelope Island State Park | Located in the Great Salt Lake, this park offers unique landscapes and opportunities for outdoor activities. Ideal for those who enjoy hiking, biking, and wildlife viewing. | Bison viewing, Hiking trails, Scenic drives, Great Salt Lake, Nature photography |
| Zion National Park | While not in Glendale, it's a major draw for tourists staying in the area, known for its breathtaking canyons and hiking trails. A must-visit for outdoor enthusiasts. | Angel's Landing, Zion Canyon Scenic Drive, The Narrows, Zion's hiking trails, Visitor Center |
| Bryce Canyon National Park | Also nearby, Bryce Canyon is famed for its unique rock formations and fantastic hiking opportunities. It attracts many visitors seeking stunning landscapes. | Bryce Amphitheater, Hiking trails, Stargazing, Scenic viewpoints, Visitor Center |
| Grand Staircase-Escalante National Monument | A vast area of geological and archaeological significance with incredible vistas, providing opportunities for exploration and adventure. | Hiking, Scenic drives, Slot canyons, Wild west history, Camping |
| Capitol Reef National Park | Another notable national park in the area, known for its unique rock formations and rich history. Perfect for families and outdoor lovers. | Fruita Historic District, Hiking trails, Scenic drives, Stargazing, Picnicking |
| Glen Canyon National Recreation Area | Famous for Lake Powell and beautiful canyons, perfect for boating, fishing, and recreational activities in a stunning setting. | Lake Powell, Boating, Hiking, Fishing, Stargazing |
| Local Art Galleries and Shops | West of Glendale, local art galleries and shops attract visitors looking for unique creations and cultural experiences, providing a cozy, community-oriented atmosphere. | Local artists' galleries, Handcrafted goods, Community events, Cultural festivals, Local cuisine |
Understanding Airbnb License Requirements & STR Laws in Glendale (2026)
While Glendale, Utah, United States currently shows low STR regulations, specific Airbnb license requirements might still exist or change. Always verify the latest short term rental regulations and Airbnb license requirements directly with local government authorities for Glendale to ensure full compliance before hosting.
(Source: AirROI data, 2026, finding no licensed listings among those analyzed)
Top Performing Airbnb Properties in Glendale (2026)
Benchmark your potential! Explore examples of top-performing Airbnb properties in Glendalebased on Trailing Twelve Month (TTM) revenue. Analyze their characteristics, revenue, occupancy rate, and ADR to understand what drives success in this market.
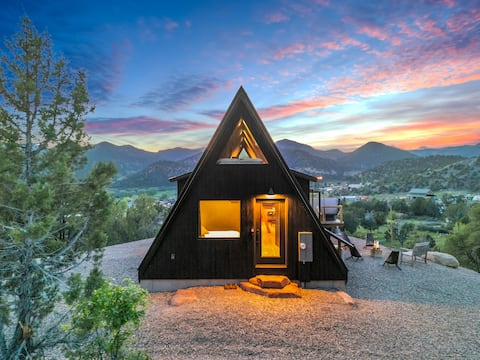
A-frame Near Zion & Bryce + Hot Tub & Cold Plunge
Entire Place • 2 bedrooms

Revered Hidden Lake Lodge @ East Zion & Bryce
Entire Place • 3 bedrooms

Modern Mountain House at Apple Hollow (W/ Hot Tub)
Entire Place • 2 bedrooms
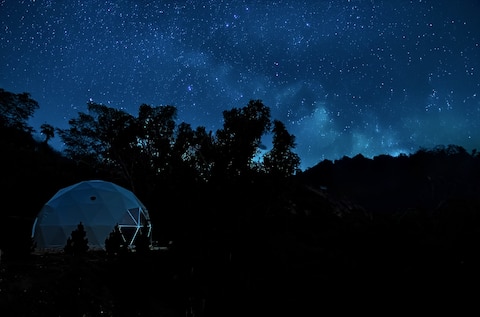
Cozy Cabin & Stargazing Dome BR Deck Hammocks BBQ
Entire Place • 2 bedrooms
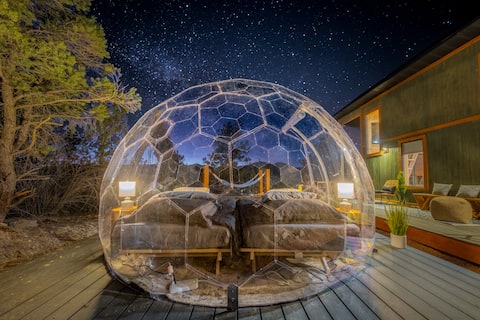
Unique Dome Retreat near Zion and Bryce with Hot T
Entire Place • 1 bedroom
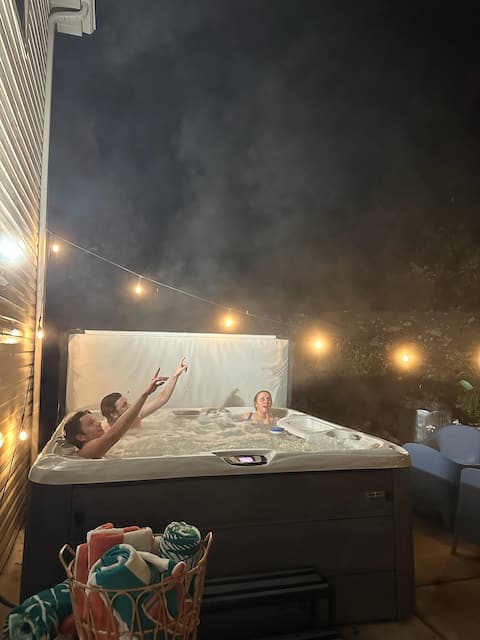
Hot tub, Game Room, Fire, Spacious Family Escape
Entire Place • 4 bedrooms
Note: Performance varies based on location, size, amenities, seasonality, and management quality. Data reflects the past 12 months.
Top Performing Airbnb Hosts in Glendale (2026)
Learn from the best! This table showcases top-performing Airbnb hosts in Glendale based on the number of properties managed and estimated total revenue over the past year. Analyze their scale and performance metrics.
| Host Name | Properties | Grossing Revenue | Stay Reviews | Avg Rating |
|---|---|---|---|---|
| Betty & Jeremy Chamberlain | 8 | $346,084 | 1871 | 4.92/5.0 |
| Jaime | 5 | $257,522 | 224 | 4.90/5.0 |
| Russ | 4 | $220,859 | 115 | 4.84/5.0 |
| Skyler And Nicole | 6 | $164,960 | 2161 | 4.89/5.0 |
| Kristy | 4 | $132,436 | 707 | 4.93/5.0 |
| Steven | 1 | $109,285 | 163 | 4.91/5.0 |
| Ben | 6 | $100,356 | 790 | 4.90/5.0 |
| Clayton | 1 | $62,104 | 81 | 4.88/5.0 |
| Chris | 1 | $56,612 | 159 | 4.91/5.0 |
| Chad | 2 | $47,140 | 150 | 4.87/5.0 |
Analyzing the strategies of top hosts, such as their property selection, pricing, and guest communication, can offer valuable lessons for optimizing your own Airbnb operations in Glendale.
Dive Deeper: Advanced Glendale STR Market Data (2026)
Ready to unlock more insights? AirROI provides access to advanced metrics and comprehensive Airbnb data for Glendale. Explore detailed analytics beyond this report to refine your investment strategy, optimize pricing, and maximize your vacation rental profits.
Explore Advanced MetricsGlendale Short-Term Rental Market Composition (2026): Property & Room Types
Room Type Distribution
Property Type Distribution
Market Composition Insights for Glendale
- The Glendale Airbnb market composition is heavily skewed towards Entire Home/Apt listings, which make up 98.3% of the 60 active rentals. This indicates strong guest preference for privacy and space.
- Looking at the property type distribution in Glendale, House properties are the most common (65%), reflecting the local real estate landscape.
- Houses represent a significant 65% portion, catering likely to families or larger groups.
- Smaller segments like apartment/condo, others (combined 5.0%) offer potential for unique stay experiences.
Glendale Airbnb Room Capacity Analysis (2026): Bedroom Distribution
Distribution of Listings by Number of Bedrooms
Room Capacity Insights for Glendale
- The dominant room capacity in Glendale is 1 bedroom listings, making up 41.7% of the market. This suggests a strong demand for properties suitable for couples or solo travelers.
- Together, 1 bedroom and 2 bedrooms properties represent 66.7% of the active Airbnb listings in Glendale, indicating a high concentration in these sizes.
- A significant 26.7% of listings offer 3+ bedrooms, catering to larger groups and families seeking more space in Glendale.
Glendale Vacation Rental Guest Capacity Trends (2026)
Distribution of Listings by Guest Capacity
Guest Capacity Insights for Glendale
- The most common guest capacity trend in Glendale vacation rentals is listings accommodating 4 guests (41.7%). This suggests the primary traveler segment is likely small families or groups.
- Properties designed for 4 guests and 8+ guests dominate the Glendale STR market, accounting for 66.7% of listings.
- 43.4% of properties accommodate 6+ guests, serving the market segment for larger families or group travel in Glendale.
- On average, properties in Glendale are equipped to host 5.2 guests.
Glendale Airbnb Booking Patterns (2026): Available vs. Booked Days
Available Days Distribution
Booked Days Distribution
Booking Pattern Insights for Glendale
- The most common availability pattern in Glendale falls within the 181-270 days range, representing 51.7% of listings. This suggests many properties have significant open periods on their calendars.
- Approximately 75.0% of listings show high availability (181+ days open annually), indicating potential for increased bookings or specific owner usage patterns.
- For booked days, the 91-180 days range is most frequent in Glendale (53.3%), reflecting common guest stay durations or potential owner blocking patterns.
- A notable 25.0% of properties secure long booking periods (181+ days booked per year), highlighting successful long-term rental strategies or significant owner usage.
Glendale Airbnb Minimum Stay Requirements Analysis
Distribution of Listings by Minimum Night Requirement
1 Night
24 listings
40% of total
2 Nights
17 listings
28.3% of total
3 Nights
2 listings
3.3% of total
30+ Nights
17 listings
28.3% of total
Key Insights
- The most prevalent minimum stay requirement in Glendale is 1 Night, adopted by 40% of listings. This highlights the market's preference for shorter, flexible bookings.
- A strong majority (68.3%) of the Glendale Airbnb data shows acceptance of very short stays (1-2 nights), indicating a dynamic, high-turnover market.
- A significant segment (28.3%) caters to monthly stays (30+ nights) in Glendale, pointing to opportunities in the extended-stay market.
Recommendations
- Align with the market by considering a 1 Night minimum stay, as 40% of Glendale hosts use this setting.
- Explore offering discounts for stays of 30+ nights to attract the 28.3% of the market seeking extended stays.
- Adjust minimum nights based on seasonality – potentially shorter during low season and longer during peak demand periods in Glendale.
Glendale Airbnb Cancellation Policy Trends Analysis (2026)
Limited
1 listings
1.7% of total
Flexible
19 listings
31.7% of total
Moderate
22 listings
36.7% of total
Firm
16 listings
26.7% of total
Strict
2 listings
3.3% of total
Cancellation Policy Insights for Glendale
- The prevailing Airbnb cancellation policy trend in Glendale is Moderate, used by 36.7% of listings.
- There's a relatively balanced mix between guest-friendly (68.4%) and stricter (30.0%) policies, offering choices for different guest needs.
- Strict cancellation policies are quite rare (3.3%), potentially making listings with this policy less competitive unless justified by high demand or property type.
Recommendations for Hosts
- Consider adopting a Moderate policy to align with the 36.7% market standard in Glendale.
- Using a Strict policy might deter some guests, as only 3.3% of listings use it. Evaluate if potential revenue protection outweighs possible lower booking rates.
- Regularly review your cancellation policy against competitors and market demand shifts in Glendale.
Glendale STR Booking Lead Time Analysis (2026)
Average Booking Lead Time by Month
Booking Lead Time Insights for Glendale
- The overall average booking lead time for vacation rentals in Glendale is 55 days.
- Guests book furthest in advance for stays during September (average 71 days), likely coinciding with peak travel demand or local events.
- The shortest booking windows occur for stays in December (average 34 days), indicating more last-minute travel plans during this time.
- Seasonally, Fall (60 days avg.) sees the longest lead times, while Winter (36 days avg.) has the shortest, reflecting typical travel planning cycles.
Recommendations for Hosts
- Use the overall average lead time (55 days) as a baseline for your pricing and availability strategy in Glendale.
- For September stays, consider implementing length-of-stay discounts or slightly higher rates for bookings made less than 71 days out to capitalize on advance planning.
- Target marketing efforts for the Fall season well in advance (at least 60 days) to capture early planners.
- Monitor your own booking lead times against these Glendale averages to identify opportunities for dynamic pricing adjustments.
Popular & Essential Airbnb Amenities in Glendale (2026)
Amenity Prevalence
Amenity Insights for Glendale
- Essential amenities in Glendale that guests expect include: Free parking on premises, Heating, Hot water, Dishes and silverware, Wifi, Coffee maker, Microwave, Shampoo, Essentials, Air conditioning. Lacking these (any) could significantly impact bookings.
Recommendations for Hosts
- Ensure your listing includes all essential amenities for Glendale: Free parking on premises, Heating, Hot water, Dishes and silverware, Wifi, Coffee maker, Microwave, Shampoo, Essentials, Air conditioning.
- Prioritize adding missing essentials: Dishes and silverware, Wifi, Coffee maker, Microwave, Shampoo, Essentials, Air conditioning.
- Highlight unique or less common amenities you offer (e.g., hot tub, dedicated workspace, EV charger) in your listing description and photos.
- Regularly check competitor amenities in Glendale to stay competitive.
Glendale Airbnb Guest Demographics & Profile Analysis (2026)
Guest Profile Summary for Glendale
- The typical guest profile for Airbnb in Glendale consists of primarily domestic travelers (92%), often arriving from nearby Las Vegas, typically belonging to the Post-2000s (Gen Z/Alpha) group (50%), primarily speaking English or Spanish.
- Domestic travelers account for 92.3% of guests.
- Key international markets include United States (92.3%) and Canada (1.7%).
- Top languages spoken are English (66%) followed by Spanish (10.8%).
- A significant demographic segment is the Post-2000s (Gen Z/Alpha) group, representing 50% of guests.
Recommendations for Hosts
- Target domestic marketing efforts towards travelers from Las Vegas and Salt Lake City.
- Tailor amenities and listing descriptions to appeal to the dominant Post-2000s (Gen Z/Alpha) demographic (e.g., highlight fast WiFi, smart home features, local guides).
- Highlight unique local experiences or amenities relevant to the primary guest profile.
- Consider seasonal promotions aligned with peak travel times for key origin markets.
Nearby Short-Term Rental Market Comparison
How does the Glendale Airbnb market stack up against its neighbors? Compare key performance metrics like average monthly revenue, ADR, and occupancy rates in surrounding areas to understand the broader regional STR landscape.
| Market | Active Properties | Monthly Revenue | Daily Rate | Avg. Occupancy |
|---|---|---|---|---|
| Springdale | 135 | $5,417 | $457.31 | 46% |
| Rockville | 22 | $4,535 | $488.30 | 33% |
| Hurricane | 730 | $3,797 | $329.21 | 45% |
| Santa Clara | 279 | $3,789 | $427.47 | 36% |
| Greenehaven | 48 | $3,740 | $333.15 | 44% |
| Teasdale | 34 | $3,558 | $266.71 | 50% |
| Orderville | 256 | $3,275 | $321.28 | 38% |
| Alton | 45 | $3,237 | $279.82 | 45% |
| Washington | 727 | $3,087 | $298.55 | 40% |
| Virgin | 112 | $2,969 | $294.50 | 39% |