Garden City Airbnb Market Analysis 2026: Short Term Rental Data & Vacation Rental Statistics in Utah, United States
Is Airbnb profitable in Garden City in 2026? Explore comprehensive Airbnb analytics for Garden City, Utah, United States to uncover income potential. This 2026 STR market report for Garden City, based on AirROI data from February 2025 to January 2026, reveals key trends in the market of 636 active listings.
Whether you're considering an Airbnb investment in Garden City, optimizing your existing vacation rental, or exploring rental arbitrage opportunities, understanding the Garden City Airbnb data is crucial. Leveraging the low regulation environment is key to maximizing your short term rental income potential. Let's dive into the specifics.
Key Garden City Airbnb Performance Metrics Overview
Monthly Airbnb Revenue Variations & Income Potential in Garden City (2026)
Understanding the monthly revenue variations for Airbnb listings in Garden City is key to maximizing your short term rental income potential. Seasonality significantly impacts earnings. Our analysis, based on data from the past 12 months, shows that the peak revenue month for STRs in Garden City is typically July, while February often presents the lowest earnings, highlighting opportunities for strategic pricing adjustments during shoulder and low seasons. Explore the typical Airbnb income in Garden City across different performance tiers:
- Best-in-class properties (Top 10%) achieve $8,225+ monthly, often utilizing dynamic pricing and superior guest experiences.
- Strong performing properties (Top 25%) earn $5,059 or more, indicating effective management and desirable locations/amenities.
- Typical properties (Median) generate around $2,817 per month, representing the average market performance.
- Entry-level properties (Bottom 25%) see earnings around $1,528, often with potential for optimization.
Average Monthly Airbnb Earnings Trend in Garden City
Garden City Airbnb Occupancy Rate Trends (2026)
Maximize your bookings by understanding the Garden City STR occupancy trends. Seasonal demand shifts significantly influence how often properties are booked. Typically, Julysees the highest demand (peak season occupancy), while January experiences the lowest (low season). Effective strategies, like adjusting minimum stays or offering promotions, can boost occupancy during slower periods. Here's how different property tiers perform in Garden City:
- Best-in-class properties (Top 10%) achieve 54%+ occupancy, indicating high desirability and potentially optimized availability.
- Strong performing properties (Top 25%) maintain 39% or higher occupancy, suggesting good market fit and guest satisfaction.
- Typical properties (Median) have an occupancy rate around 25%.
- Entry-level properties (Bottom 25%) average 15% occupancy, potentially facing higher vacancy.
Average Monthly Occupancy Rate Trend in Garden City
Average Daily Rate (ADR) Airbnb Trends in Garden City (2026)
Effective short term rental pricing strategy in Garden City involves understanding monthly ADR fluctuations. The Average Daily Rate (ADR) for Airbnb in Garden City typically peaks in July and dips lowest during February. Leveraging Airbnb dynamic pricing tools or strategies based on this seasonality can significantly boost revenue. Here's a look at the typical nightly rates achieved:
- Best-in-class properties (Top 10%) command rates of $812+ per night, often due to premium features or locations.
- Strong performing properties (Top 25%) achieve nightly rates of $540 or more.
- Typical properties (Median) charge around $349 per night.
- Entry-level properties (Bottom 25%) earn around $231 per night.
Average Daily Rate (ADR) Trend by Month in Garden City
Get Live Garden City Market Intelligence 👇

Explore Real-time Analytics
Airbnb Seasonality Analysis & Trends in Garden City (2026)
Peak Season (July, August, June)
- Revenue averages $7,819 per month
- Occupancy rates average 48.7%
- Daily rates average $529
Shoulder Season
- Revenue averages $2,987 per month
- Occupancy maintains around 21.7%
- Daily rates hold near $445
Low Season (February, March, April)
- Revenue drops to average $2,107 per month
- Occupancy decreases to average 22.2%
- Daily rates adjust to average $368
Seasonality Insights for Garden City
- The Airbnb seasonality in Garden City shows highly seasonal trends requiring careful strategy. While the sections above show seasonal averages, it's also insightful to look at the extremes:
- During the high season, the absolute peak month showcases Garden City's highest earning potential, with monthly revenues capable of climbing to $10,503, occupancy reaching a high of 62.1%, and ADRs peaking at $551.
- Conversely, the slowest single month of the year, typically falling within the low season, marks the market's lowest point. In this month, revenue might dip to $1,897, occupancy could drop to 17.3%, and ADRs may adjust down to $364.
- Understanding both the seasonal averages and these monthly peaks and troughs in revenue, occupancy, and ADR is crucial for maximizing your Airbnb profit potential in Garden City.
Seasonal Strategies for Maximizing Profit
- Peak Season: Maximize revenue through premium pricing and potentially longer minimum stays. Ensure high availability.
- Low Season: Offer competitive pricing, special promotions (e.g., extended stay discounts), and flexible cancellation policies. Target off-season travelers like remote workers or budget-conscious guests.
- Shoulder Seasons: Implement dynamic pricing that balances peak and low rates. Target weekend travelers or specific events. Offer slightly more flexible terms than peak season.
- Regularly analyze your own performance against these Garden City seasonality benchmarks and adjust your pricing and availability strategy accordingly.
Best Areas for Airbnb Investment in Garden City (2026)
Exploring the top neighborhoods for short-term rentals in Garden City? This section highlights key areas, outlining why they are attractive for hosts and guests, along with notable local attractions. Consider these locations based on your target guest profile and investment strategy.
| Neighborhood / Area | Why Host Here? (Target Guests & Appeal) | Key Attractions & Landmarks |
|---|---|---|
| Bear Lake | A beautiful freshwater lake known for its stunning turquoise waters, perfect for summer vacations and outdoor activities. Bear Lake is a popular spot for families and outdoor enthusiasts looking for boating, fishing, and beach activities. | Bear Lake State Park, Ideal Beach, Bear Lake Marina, Montpelier, Idaho, National Oregon/California Trail Center |
| Garden City Beach | Nestled on the shores of Bear Lake, Garden City Beach is a charming area known for its relaxing atmosphere and scenic views. Ideal for visitors seeking a peaceful retreat with easy access to water activities and local restaurants. | Bear Lake, Garden City Park, local restaurants, Garden City Marina, Utah State University Bear Lake |
| Fish Springs | A remote and beautiful area in the west desert offering unique outdoor experiences away from the crowds. Great for adventurers looking for solitude and natural beauty. | Fish Springs National Wildlife Refuge, Great Salt Lake, desert landscapes, bird watching, stargazing |
| Logan Canyon | A stunning canyon offering hiking, fishing, and scenic drives. Popular for visitors looking for outdoor adventures and beautiful scenery all year round. | Logan Canyon Scenic Byway, Bear River, private and public fishing spots, hiking trails, snowshoeing and skiing in winter |
| Salt Lake City | Utah's capital and largest city, offering a vibrant downtown with plenty of attractions, dining, and cultural experiences. A great base for exploring the state and nearby ski resorts. | Temple Square, Natural History Museum of Utah, Salt Lake City Public Library, Hogle Zoo, Red Butte Garden |
| Park City | A renowned ski resort town known for hosting the Sundance Film Festival. Attracts tourists year-round for skiing, hiking, and summer festivals. A sought-after location for vacation rentals. | Park City Mountain Resort, Historic Main Street, Deer Valley Resort, Sundance Film Festival, Wasatch National Forest |
| Antelope Island State Park | Home to free-ranging bison and stunning views of the Great Salt Lake, this park offers unique outdoor activities and is an excellent location for nature enthusiasts and photographers. | Antelope Island, bison viewing, salt flat landscapes, hiking trails, birdwatching |
| Bear Lake Valley | A beautiful valley featuring Bear Lake and its surrounding mountains. This area is known for its recreational opportunities and is a fantastic place for family vacations and gatherings. | Bear Lake, Pickleville Playhouse, restaurant and shopping options, beach activities, house rentals |
Understanding Airbnb License Requirements & STR Laws in Garden City (2026)
While Garden City, Utah, United States currently shows low STR regulations, specific Airbnb license requirements might still exist or change. Always verify the latest short term rental regulations and Airbnb license requirements directly with local government authorities for Garden City to ensure full compliance before hosting.
(Source: AirROI data, 2026, finding no licensed listings among those analyzed)
Top Performing Airbnb Properties in Garden City (2026)
Benchmark your potential! Explore examples of top-performing Airbnb properties in Garden Citybased on Trailing Twelve Month (TTM) revenue. Analyze their characteristics, revenue, occupancy rate, and ADR to understand what drives success in this market.
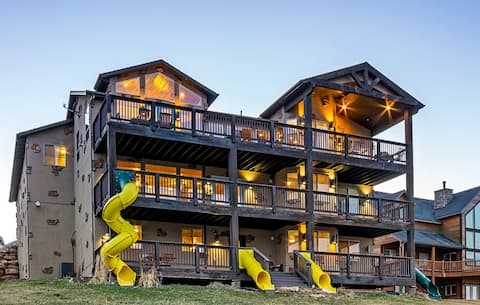
Bear Lake Big House, Indoor Playground, Sleeps 47
Entire Place • 9 bedrooms
Papa Bear Lodge (Sleeps 52)
Entire Place • 15 bedrooms
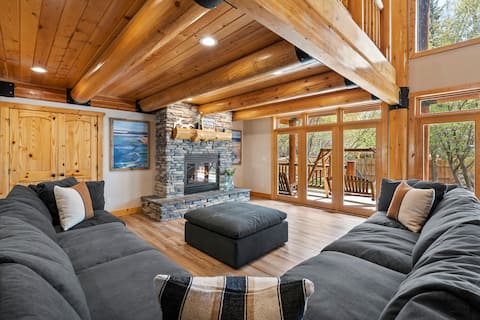
Luxury Group Escape | Indoor Pool, Hot Tub & Court
Entire Place • 7 bedrooms

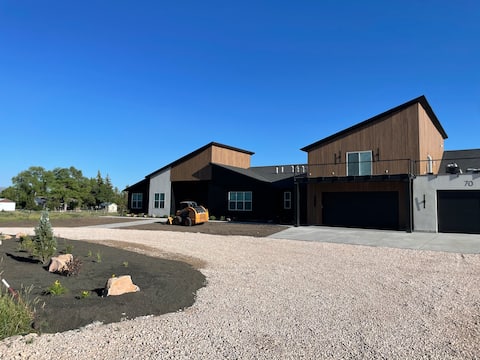
The Inn at Bear Lake! Family Reunion or Big Group!
Entire Place • 18 bedrooms

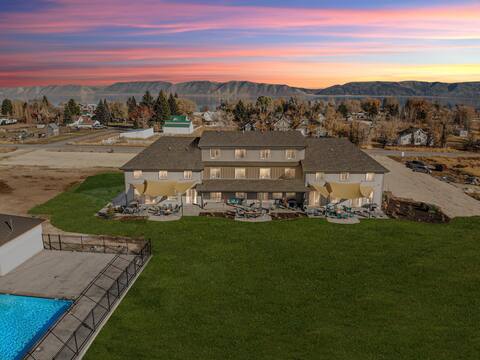
Monster of a House With Theatre, hot tub, & more!
Entire Place • 14 bedrooms
Waterdance Entire Triplex-Sleeps 110-25B/20BA
Entire Place • 24 bedrooms
Note: Performance varies based on location, size, amenities, seasonality, and management quality. Data reflects the past 12 months.
Top Performing Airbnb Hosts in Garden City (2026)
Learn from the best! This table showcases top-performing Airbnb hosts in Garden City based on the number of properties managed and estimated total revenue over the past year. Analyze their scale and performance metrics.
| Host Name | Properties | Grossing Revenue | Stay Reviews | Avg Rating |
|---|---|---|---|---|
| Jake | 28 | $1,744,892 | 548 | 4.89/5.0 |
| Natalie | 51 | $1,244,320 | 1733 | 4.77/5.0 |
| Adam At Waterdance | 37 | $1,023,057 | 229 | 4.92/5.0 |
| Evolve | 26 | $975,512 | 655 | 4.74/5.0 |
| Bear Lake Luxury Rentals | 17 | $934,836 | 218 | 4.69/5.0 |
| Lets Get Away Properties | 41 | $850,559 | 844 | 4.78/5.0 |
| Manage It Bear Lake | 28 | $673,386 | 251 | 4.81/5.0 |
| Prime Properties | 6 | $517,393 | 497 | 4.93/5.0 |
| Ashlyn | 9 | $450,411 | 251 | 4.83/5.0 |
| Thurmon | 3 | $421,797 | 81 | 4.83/5.0 |
Analyzing the strategies of top hosts, such as their property selection, pricing, and guest communication, can offer valuable lessons for optimizing your own Airbnb operations in Garden City.
Dive Deeper: Advanced Garden City STR Market Data (2026)
Ready to unlock more insights? AirROI provides access to advanced metrics and comprehensive Airbnb data for Garden City. Explore detailed analytics beyond this report to refine your investment strategy, optimize pricing, and maximize your vacation rental profits.
Explore Advanced MetricsGarden City Short-Term Rental Market Composition (2026): Property & Room Types
Room Type Distribution
Property Type Distribution
Market Composition Insights for Garden City
- The Garden City Airbnb market composition is heavily skewed towards Entire Home/Apt listings, which make up 97.3% of the 636 active rentals. This indicates strong guest preference for privacy and space.
- Looking at the property type distribution in Garden City, House properties are the most common (68.1%), reflecting the local real estate landscape.
- Houses represent a significant 68.1% portion, catering likely to families or larger groups.
- Smaller segments like hotel/boutique, others (combined 2.9%) offer potential for unique stay experiences.
Garden City Airbnb Room Capacity Analysis (2026): Bedroom Distribution
Distribution of Listings by Number of Bedrooms
Room Capacity Insights for Garden City
- The dominant room capacity in Garden City is 5+ bedrooms listings, making up 40.4% of the market. This suggests a strong demand for properties suitable for families or small groups.
- Together, 5+ bedrooms and 3 bedrooms properties represent 63.2% of the active Airbnb listings in Garden City, indicating a high concentration in these sizes.
- A significant 80.8% of listings offer 3+ bedrooms, catering to larger groups and families seeking more space in Garden City.
Garden City Vacation Rental Guest Capacity Trends (2026)
Distribution of Listings by Guest Capacity
Guest Capacity Insights for Garden City
- The most common guest capacity trend in Garden City vacation rentals is listings accommodating 8+ guests (86%). This suggests the primary traveler segment is likely larger groups.
- Properties designed for 8+ guests and 4 guests dominate the Garden City STR market, accounting for 93.1% of listings.
- 91.7% of properties accommodate 6+ guests, serving the market segment for larger families or group travel in Garden City.
- On average, properties in Garden City are equipped to host 7.6 guests.
Garden City Airbnb Booking Patterns (2026): Available vs. Booked Days
Available Days Distribution
Booked Days Distribution
Booking Pattern Insights for Garden City
- The most common availability pattern in Garden City falls within the 271-366 days range, representing 74.8% of listings. This suggests many properties have significant open periods on their calendars.
- Approximately 97.3% of listings show high availability (181+ days open annually), indicating potential for increased bookings or specific owner usage patterns.
- For booked days, the 31-90 days range is most frequent in Garden City (47.8%), reflecting common guest stay durations or potential owner blocking patterns.
- A notable 2.8% of properties secure long booking periods (181+ days booked per year), highlighting successful long-term rental strategies or significant owner usage.
Garden City Airbnb Minimum Stay Requirements Analysis
Distribution of Listings by Minimum Night Requirement
1 Night
67 listings
10.5% of total
2 Nights
267 listings
42% of total
3 Nights
48 listings
7.5% of total
4-6 Nights
2 listings
0.3% of total
7-29 Nights
4 listings
0.6% of total
30+ Nights
248 listings
39% of total
Key Insights
- The most prevalent minimum stay requirement in Garden City is 2 Nights, adopted by 42% of listings. This highlights the market's preference for shorter, flexible bookings.
- A significant segment (39%) caters to monthly stays (30+ nights) in Garden City, pointing to opportunities in the extended-stay market.
Recommendations
- Align with the market by considering a 2 Nights minimum stay, as 42% of Garden City hosts use this setting.
- If feasible, allowing 1-night stays, especially midweek or during low season, could capture last-minute bookings, as only 10.5% currently do.
- A 2-night minimum appears standard (42%). Consider this for weekends or peak periods.
- Explore offering discounts for stays of 30+ nights to attract the 39% of the market seeking extended stays.
- Adjust minimum nights based on seasonality – potentially shorter during low season and longer during peak demand periods in Garden City.
Garden City Airbnb Cancellation Policy Trends Analysis (2026)
Super Strict 60 Days
49 listings
7.7% of total
Super Strict 30 Days
41 listings
6.5% of total
Limited
12 listings
1.9% of total
Flexible
24 listings
3.8% of total
Moderate
84 listings
13.2% of total
Firm
342 listings
53.9% of total
Strict
83 listings
13.1% of total
Cancellation Policy Insights for Garden City
- The prevailing Airbnb cancellation policy trend in Garden City is Firm, used by 53.9% of listings.
- A majority (67.0%) of hosts in Garden City utilize Firm or Strict policies, indicating a market where hosts prioritize booking security.
Recommendations for Hosts
- Consider adopting a Firm policy to align with the 53.9% market standard in Garden City.
- Using a Strict policy might deter some guests, as only 13.1% of listings use it. Evaluate if potential revenue protection outweighs possible lower booking rates.
- Regularly review your cancellation policy against competitors and market demand shifts in Garden City.
Garden City STR Booking Lead Time Analysis (2026)
Average Booking Lead Time by Month
Booking Lead Time Insights for Garden City
- The overall average booking lead time for vacation rentals in Garden City is 70 days.
- Guests book furthest in advance for stays during July (average 103 days), likely coinciding with peak travel demand or local events.
- The shortest booking windows occur for stays in March (average 35 days), indicating more last-minute travel plans during this time.
- Seasonally, Summer (91 days avg.) sees the longest lead times, while Spring (46 days avg.) has the shortest, reflecting typical travel planning cycles.
Recommendations for Hosts
- Use the overall average lead time (70 days) as a baseline for your pricing and availability strategy in Garden City.
- For July stays, consider implementing length-of-stay discounts or slightly higher rates for bookings made less than 103 days out to capitalize on advance planning.
- Target marketing efforts for the Summer season well in advance (at least 91 days) to capture early planners.
- Monitor your own booking lead times against these Garden City averages to identify opportunities for dynamic pricing adjustments.
Popular & Essential Airbnb Amenities in Garden City (2026)
Amenity Prevalence
Amenity Insights for Garden City
- Essential amenities in Garden City that guests expect include: Wifi, TV, Air conditioning, Carbon monoxide alarm, Kitchen. Lacking these (any) could significantly impact bookings.
- Popular amenities like Heating, Smoke alarm, Fire extinguisher are common but not universal. Offering these can provide a competitive edge.
Recommendations for Hosts
- Ensure your listing includes all essential amenities for Garden City: Wifi, TV, Air conditioning, Carbon monoxide alarm, Kitchen.
- Prioritize adding missing essentials: Wifi, TV, Air conditioning, Carbon monoxide alarm, Kitchen.
- Consider adding popular differentiators like Heating or Smoke alarm to increase appeal.
- Highlight unique or less common amenities you offer (e.g., hot tub, dedicated workspace, EV charger) in your listing description and photos.
- Regularly check competitor amenities in Garden City to stay competitive.
Garden City Airbnb Guest Demographics & Profile Analysis (2026)
Guest Profile Summary for Garden City
- The typical guest profile for Airbnb in Garden City consists of primarily domestic travelers (98%), often arriving from nearby Salt Lake City, typically belonging to the Post-2000s (Gen Z/Alpha) group (50%), primarily speaking English or Spanish.
- Domestic travelers account for 98.2% of guests.
- Key international markets include United States (98.2%) and Canada (0.3%).
- Top languages spoken are English (70%) followed by Spanish (16.9%).
- A significant demographic segment is the Post-2000s (Gen Z/Alpha) group, representing 50% of guests.
Recommendations for Hosts
- Target domestic marketing efforts towards travelers from Salt Lake City and Logan.
- Tailor amenities and listing descriptions to appeal to the dominant Post-2000s (Gen Z/Alpha) demographic (e.g., highlight fast WiFi, smart home features, local guides).
- Highlight unique local experiences or amenities relevant to the primary guest profile.
- Consider seasonal promotions aligned with peak travel times for key origin markets.
Nearby Short-Term Rental Market Comparison
How does the Garden City Airbnb market stack up against its neighbors? Compare key performance metrics like average monthly revenue, ADR, and occupancy rates in surrounding areas to understand the broader regional STR landscape.
| Market | Active Properties | Monthly Revenue | Daily Rate | Avg. Occupancy |
|---|---|---|---|---|
| Sundance | 61 | $6,552 | $867.92 | 33% |
| Fish Haven | 61 | $6,044 | $855.41 | 33% |
| Alta | 44 | $5,993 | $971.20 | 39% |
| Daniel | 25 | $5,231 | $693.40 | 34% |
| Brighton | 151 | $4,367 | $557.15 | 37% |
| Oakley | 12 | $4,163 | $875.37 | 32% |
| Park City | 4,036 | $4,087 | $626.69 | 34% |
| Coalville | 36 | $3,711 | $440.00 | 33% |
| Mapleton | 11 | $3,385 | $365.91 | 41% |
| Heber City | 220 | $3,287 | $497.35 | 34% |