Draper Airbnb Market Analysis 2026: Short Term Rental Data & Vacation Rental Statistics in Utah, United States
Is Airbnb profitable in Draper in 2026? Explore comprehensive Airbnb analytics for Draper, Utah, United States to uncover income potential. This 2026 STR market report for Draper, based on AirROI data from February 2025 to January 2026, reveals key trends in the niche market of 173 active listings.
Whether you're considering an Airbnb investment in Draper, optimizing your existing vacation rental, or exploring rental arbitrage opportunities, understanding the Draper Airbnb data is crucial. Leveraging the low regulation environment is key to maximizing your short term rental income potential. Let's dive into the specifics.
Key Draper Airbnb Performance Metrics Overview
Monthly Airbnb Revenue Variations & Income Potential in Draper (2026)
Understanding the monthly revenue variations for Airbnb listings in Draper is key to maximizing your short term rental income potential. Seasonality significantly impacts earnings. Our analysis, based on data from the past 12 months, shows that the peak revenue month for STRs in Draper is typically February, while April often presents the lowest earnings, highlighting opportunities for strategic pricing adjustments during shoulder and low seasons. Explore the typical Airbnb income in Draper across different performance tiers:
- Best-in-class properties (Top 10%) achieve $5,939+ monthly, often utilizing dynamic pricing and superior guest experiences.
- Strong performing properties (Top 25%) earn $3,733 or more, indicating effective management and desirable locations/amenities.
- Typical properties (Median) generate around $2,415 per month, representing the average market performance.
- Entry-level properties (Bottom 25%) see earnings around $1,537, often with potential for optimization.
Average Monthly Airbnb Earnings Trend in Draper
Draper Airbnb Occupancy Rate Trends (2026)
Maximize your bookings by understanding the Draper STR occupancy trends. Seasonal demand shifts significantly influence how often properties are booked. Typically, Februarysees the highest demand (peak season occupancy), while January experiences the lowest (low season). Effective strategies, like adjusting minimum stays or offering promotions, can boost occupancy during slower periods. Here's how different property tiers perform in Draper:
- Best-in-class properties (Top 10%) achieve 84%+ occupancy, indicating high desirability and potentially optimized availability.
- Strong performing properties (Top 25%) maintain 71% or higher occupancy, suggesting good market fit and guest satisfaction.
- Typical properties (Median) have an occupancy rate around 55%.
- Entry-level properties (Bottom 25%) average 35% occupancy, potentially facing higher vacancy.
Average Monthly Occupancy Rate Trend in Draper
Average Daily Rate (ADR) Airbnb Trends in Draper (2026)
Effective short term rental pricing strategy in Draper involves understanding monthly ADR fluctuations. The Average Daily Rate (ADR) for Airbnb in Draper typically peaks in December and dips lowest during April. Leveraging Airbnb dynamic pricing tools or strategies based on this seasonality can significantly boost revenue. Here's a look at the typical nightly rates achieved:
- Best-in-class properties (Top 10%) command rates of $347+ per night, often due to premium features or locations.
- Strong performing properties (Top 25%) achieve nightly rates of $195 or more.
- Typical properties (Median) charge around $142 per night.
- Entry-level properties (Bottom 25%) earn around $110 per night.
Average Daily Rate (ADR) Trend by Month in Draper
Get Live Draper Market Intelligence 👇

Explore Real-time Analytics
Airbnb Seasonality Analysis & Trends in Draper (2026)
Peak Season (February, March, July)
- Revenue averages $3,833 per month
- Occupancy rates average 65.1%
- Daily rates average $191
Shoulder Season
- Revenue averages $3,206 per month
- Occupancy maintains around 50.5%
- Daily rates hold near $205
Low Season (April, September, November)
- Revenue drops to average $2,556 per month
- Occupancy decreases to average 46.0%
- Daily rates adjust to average $192
Seasonality Insights for Draper
- The Airbnb seasonality in Draper shows moderate seasonality with distinct peak and low periods. While the sections above show seasonal averages, it's also insightful to look at the extremes:
- During the high season, the absolute peak month showcases Draper's highest earning potential, with monthly revenues capable of climbing to $3,945, occupancy reaching a high of 69.2%, and ADRs peaking at $232.
- Conversely, the slowest single month of the year, typically falling within the low season, marks the market's lowest point. In this month, revenue might dip to $2,346, occupancy could drop to 41.0%, and ADRs may adjust down to $174.
- Understanding both the seasonal averages and these monthly peaks and troughs in revenue, occupancy, and ADR is crucial for maximizing your Airbnb profit potential in Draper.
Seasonal Strategies for Maximizing Profit
- Peak Season: Maximize revenue through premium pricing and potentially longer minimum stays. Ensure high availability.
- Low Season: Offer competitive pricing, special promotions (e.g., extended stay discounts), and flexible cancellation policies. Target off-season travelers like remote workers or budget-conscious guests.
- Shoulder Seasons: Implement dynamic pricing that balances peak and low rates. Target weekend travelers or specific events. Offer slightly more flexible terms than peak season.
- Regularly analyze your own performance against these Draper seasonality benchmarks and adjust your pricing and availability strategy accordingly.
Best Areas for Airbnb Investment in Draper (2026)
Exploring the top neighborhoods for short-term rentals in Draper? This section highlights key areas, outlining why they are attractive for hosts and guests, along with notable local attractions. Consider these locations based on your target guest profile and investment strategy.
| Neighborhood / Area | Why Host Here? (Target Guests & Appeal) | Key Attractions & Landmarks |
|---|---|---|
| Draper City Center | The heart of Draper featuring shopping, dining, and entertainment. Attracts both tourists and business travelers looking for convenience and accessibility. | Draper City Park, The Living Planet Aquarium, Draper Historic Park, Draper Ice Arena, Draper Cycle Park, Draper Library |
| Draper Foothills | Scenic area with stunning views and outdoor activities. Great for those looking to escape urban life while still being close to the city. | Draper City Park Trails, Corner Canyon Trail, Steep Mountain Trail, Waterfall Canyon, Draper Equestrian Park |
| South Mountain | A peaceful suburban area with large homes and family-friendly amenities. Ideal for families visiting or relocating to the area. | South Mountain Golf Club, Lone Peak Trail, Bangerter Park, South Mountain Park |
| Draper Historic District | Rich in history and charm, this area offers a unique glimpse into Draper's past and has various local events and activities. | Draper Historic Theatre, Old Draper Park, Draper Museum, Draper Farmers Market |
| Quarry Springs | A growing community with beautiful homes and access to outdoor recreation. Attracts nature lovers and those seeking tranquility. | Quarry Springs Park, Draper Nature Park, Draper City Trail System |
| Draper’s Ridge | Offers luxury homes and scenic views, popular among visitors seeking upscale accommodations in a serene environment. | Draper Ridge Park, Suncrest Park, Views of the Wasatch Mountains |
| Draper Town Center | A vibrant area filled with various shops, restaurants, and amenities. Great for guests looking for a lively atmosphere and local flavor. | The Village at Draper, Dining options ranged from casual to upscale, Local coffee shops, Seasonal events and markets |
| Suncrest | Known for its breathtaking views and hiking opportunities. Attracts outdoor enthusiasts and vacationers looking for a scenic getaway. | Suncrest Community Park, View of the Salt Lake Valley, Access to multiple hiking trails |
Understanding Airbnb License Requirements & STR Laws in Draper (2026)
While Draper, Utah, United States currently shows low STR regulations, specific Airbnb license requirements might still exist or change. Always verify the latest short term rental regulations and Airbnb license requirements directly with local government authorities for Draper to ensure full compliance before hosting.
(Source: AirROI data, 2026, finding no licensed listings among those analyzed)
Top Performing Airbnb Properties in Draper (2026)
Benchmark your potential! Explore examples of top-performing Airbnb properties in Draperbased on Trailing Twelve Month (TTM) revenue. Analyze their characteristics, revenue, occupancy rate, and ADR to understand what drives success in this market.
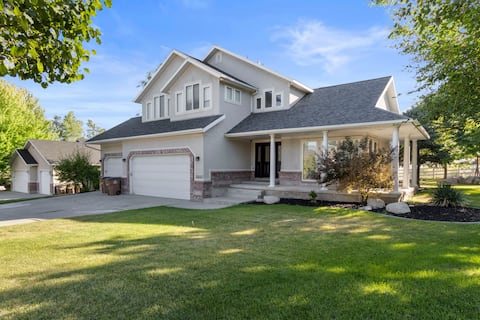
Sprawling Utah Mansion w/ Private Hot Tub & Sauna
Entire Place • 9 bedrooms
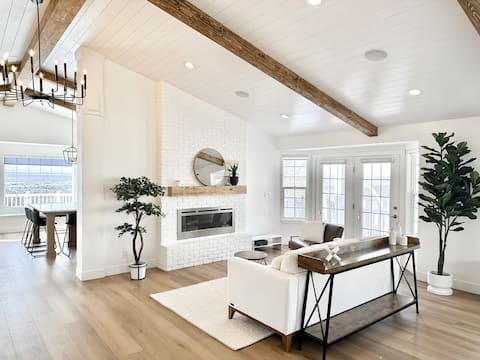
Spacious home w/hottub & close to canyons & trails
Entire Place • 7 bedrooms
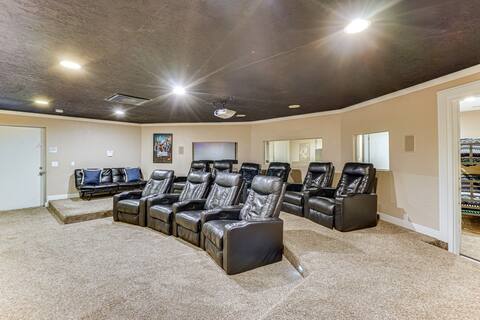
Luxury Mansion *Sleeps 20 *Pool *SportCrt *Theater
Entire Place • 6 bedrooms
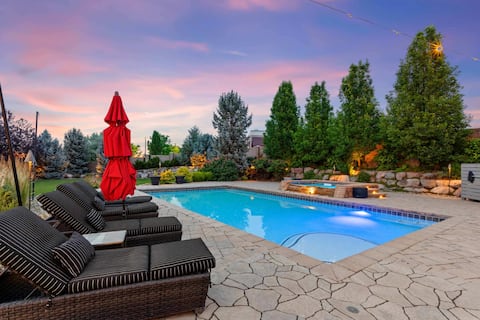
Luxury Retreat with Spectacular Views
Entire Place • 6 bedrooms

Relaxing Ski Retreat | Mtn Views | Hot Tub | Games
Entire Place • 5 bedrooms
Wasatch Retreat * Hot Tub * Billiards * Huge Deck
Entire Place • 8 bedrooms
Note: Performance varies based on location, size, amenities, seasonality, and management quality. Data reflects the past 12 months.
Top Performing Airbnb Hosts in Draper (2026)
Learn from the best! This table showcases top-performing Airbnb hosts in Draper based on the number of properties managed and estimated total revenue over the past year. Analyze their scale and performance metrics.
| Host Name | Properties | Grossing Revenue | Stay Reviews | Avg Rating |
|---|---|---|---|---|
| Bradley | 39 | $963,972 | 1707 | 4.92/5.0 |
| Utahs Best Vacation Rentals | 2 | $264,898 | 45 | 4.64/5.0 |
| Evolve | 2 | $199,673 | 30 | 4.79/5.0 |
| Eric | 1 | $185,017 | 75 | 4.96/5.0 |
| H&L Housing | 7 | $176,820 | 550 | 4.81/5.0 |
| Amanda | 4 | $156,154 | 568 | 4.83/5.0 |
| Allan | 1 | $141,946 | 58 | 4.98/5.0 |
| Casey | 1 | $136,537 | 87 | 4.99/5.0 |
| Mandi | 5 | $124,638 | 162 | 4.90/5.0 |
| Dean | 3 | $108,081 | 648 | 4.95/5.0 |
Analyzing the strategies of top hosts, such as their property selection, pricing, and guest communication, can offer valuable lessons for optimizing your own Airbnb operations in Draper.
Dive Deeper: Advanced Draper STR Market Data (2026)
Ready to unlock more insights? AirROI provides access to advanced metrics and comprehensive Airbnb data for Draper. Explore detailed analytics beyond this report to refine your investment strategy, optimize pricing, and maximize your vacation rental profits.
Explore Advanced MetricsDraper Short-Term Rental Market Composition (2026): Property & Room Types
Room Type Distribution
Property Type Distribution
Market Composition Insights for Draper
- The Draper Airbnb market composition is heavily skewed towards Entire Home/Apt listings, which make up 93.6% of the 173 active rentals. This indicates strong guest preference for privacy and space.
- Looking at the property type distribution in Draper, Apartment/Condo properties are the most common (45.7%), reflecting the local real estate landscape.
- Houses represent a significant 37% portion, catering likely to families or larger groups.
- Smaller segments like hotel/boutique, unique stays (combined 4.6%) offer potential for unique stay experiences.
Draper Airbnb Room Capacity Analysis (2026): Bedroom Distribution
Distribution of Listings by Number of Bedrooms
Room Capacity Insights for Draper
- The dominant room capacity in Draper is 1 bedroom listings, making up 30.1% of the market. This suggests a strong demand for properties suitable for couples or solo travelers.
- Together, 1 bedroom and 2 bedrooms properties represent 59.6% of the active Airbnb listings in Draper, indicating a high concentration in these sizes.
- A significant 29.5% of listings offer 3+ bedrooms, catering to larger groups and families seeking more space in Draper.
Draper Vacation Rental Guest Capacity Trends (2026)
Distribution of Listings by Guest Capacity
Guest Capacity Insights for Draper
- The most common guest capacity trend in Draper vacation rentals is listings accommodating 8+ guests (26%). This suggests the primary traveler segment is likely larger groups.
- Properties designed for 8+ guests and 4 guests dominate the Draper STR market, accounting for 46.2% of listings.
- 42.2% of properties accommodate 6+ guests, serving the market segment for larger families or group travel in Draper.
- On average, properties in Draper are equipped to host 4.9 guests.
Draper Airbnb Booking Patterns (2026): Available vs. Booked Days
Available Days Distribution
Booked Days Distribution
Booking Pattern Insights for Draper
- The most common availability pattern in Draper falls within the 181-270 days range, representing 39.9% of listings. This suggests many properties have significant open periods on their calendars.
- Approximately 61.3% of listings show high availability (181+ days open annually), indicating potential for increased bookings or specific owner usage patterns.
- For booked days, the 181-270 days range is most frequent in Draper (37.6%), reflecting common guest stay durations or potential owner blocking patterns.
- A notable 43.4% of properties secure long booking periods (181+ days booked per year), highlighting successful long-term rental strategies or significant owner usage.
Draper Airbnb Minimum Stay Requirements Analysis
Distribution of Listings by Minimum Night Requirement
1 Night
57 listings
32.9% of total
2 Nights
38 listings
22% of total
3 Nights
8 listings
4.6% of total
4-6 Nights
12 listings
6.9% of total
7-29 Nights
7 listings
4% of total
30+ Nights
51 listings
29.5% of total
Key Insights
- The most prevalent minimum stay requirement in Draper is 1 Night, adopted by 32.9% of listings. This highlights the market's preference for shorter, flexible bookings.
- A significant segment (29.5%) caters to monthly stays (30+ nights) in Draper, pointing to opportunities in the extended-stay market.
Recommendations
- Align with the market by considering a 1 Night minimum stay, as 32.9% of Draper hosts use this setting.
- Explore offering discounts for stays of 30+ nights to attract the 29.5% of the market seeking extended stays.
- Adjust minimum nights based on seasonality – potentially shorter during low season and longer during peak demand periods in Draper.
Draper Airbnb Cancellation Policy Trends Analysis (2026)
Limited
6 listings
3.5% of total
Super Strict 30 Days
2 listings
1.2% of total
Super Strict 60 Days
1 listings
0.6% of total
Flexible
15 listings
8.7% of total
Moderate
82 listings
47.7% of total
Firm
52 listings
30.2% of total
Strict
14 listings
8.1% of total
Cancellation Policy Insights for Draper
- The prevailing Airbnb cancellation policy trend in Draper is Moderate, used by 47.7% of listings.
- There's a relatively balanced mix between guest-friendly (56.4%) and stricter (38.3%) policies, offering choices for different guest needs.
- Strict cancellation policies are quite rare (8.1%), potentially making listings with this policy less competitive unless justified by high demand or property type.
Recommendations for Hosts
- Consider adopting a Moderate policy to align with the 47.7% market standard in Draper.
- Using a Strict policy might deter some guests, as only 8.1% of listings use it. Evaluate if potential revenue protection outweighs possible lower booking rates.
- Regularly review your cancellation policy against competitors and market demand shifts in Draper.
Draper STR Booking Lead Time Analysis (2026)
Average Booking Lead Time by Month
Booking Lead Time Insights for Draper
- The overall average booking lead time for vacation rentals in Draper is 29 days.
- Guests book furthest in advance for stays during February (average 35 days), likely coinciding with peak travel demand or local events.
- The shortest booking windows occur for stays in April (average 23 days), indicating more last-minute travel plans during this time.
- Seasonally, Winter (32 days avg.) sees the longest lead times, while Spring (26 days avg.) has the shortest, reflecting typical travel planning cycles.
Recommendations for Hosts
- Use the overall average lead time (29 days) as a baseline for your pricing and availability strategy in Draper.
- Target marketing efforts for the Winter season well in advance (at least 32 days) to capture early planners.
- Monitor your own booking lead times against these Draper averages to identify opportunities for dynamic pricing adjustments.
Popular & Essential Airbnb Amenities in Draper (2026)
Amenity Prevalence
Amenity Insights for Draper
- Essential amenities in Draper that guests expect include: Smoke alarm, Free parking on premises, Wifi, TV, Heating, Refrigerator, Air conditioning. Lacking these (any) could significantly impact bookings.
- Popular amenities like Kitchen, Microwave, Dishes and silverware are common but not universal. Offering these can provide a competitive edge.
Recommendations for Hosts
- Ensure your listing includes all essential amenities for Draper: Smoke alarm, Free parking on premises, Wifi, TV, Heating, Refrigerator, Air conditioning.
- Prioritize adding missing essentials: Free parking on premises, Wifi, TV, Heating, Refrigerator, Air conditioning.
- Consider adding popular differentiators like Kitchen or Microwave to increase appeal.
- Highlight unique or less common amenities you offer (e.g., hot tub, dedicated workspace, EV charger) in your listing description and photos.
- Regularly check competitor amenities in Draper to stay competitive.
Draper Airbnb Guest Demographics & Profile Analysis (2026)
Guest Profile Summary for Draper
- The typical guest profile for Airbnb in Draper consists of primarily domestic travelers (96%), often arriving from nearby Salt Lake City, typically belonging to the Post-2000s (Gen Z/Alpha) group (50%), primarily speaking English or Spanish.
- Domestic travelers account for 95.7% of guests.
- Key international markets include United States (95.7%) and Canada (1.4%).
- Top languages spoken are English (66.1%) followed by Spanish (17.1%).
- A significant demographic segment is the Post-2000s (Gen Z/Alpha) group, representing 50% of guests.
Recommendations for Hosts
- Target domestic marketing efforts towards travelers from Salt Lake City and New York.
- Tailor amenities and listing descriptions to appeal to the dominant Post-2000s (Gen Z/Alpha) demographic (e.g., highlight fast WiFi, smart home features, local guides).
- Highlight unique local experiences or amenities relevant to the primary guest profile.
- Consider seasonal promotions aligned with peak travel times for key origin markets.
Nearby Short-Term Rental Market Comparison
How does the Draper Airbnb market stack up against its neighbors? Compare key performance metrics like average monthly revenue, ADR, and occupancy rates in surrounding areas to understand the broader regional STR landscape.
| Market | Active Properties | Monthly Revenue | Daily Rate | Avg. Occupancy |
|---|---|---|---|---|
| Sundance | 61 | $6,552 | $867.92 | 33% |
| Alta | 44 | $5,993 | $971.20 | 39% |
| Daniel | 25 | $5,231 | $693.40 | 34% |
| Brighton | 151 | $4,367 | $557.15 | 37% |
| Oakley | 12 | $4,163 | $875.37 | 32% |
| Park City | 4,036 | $4,087 | $626.69 | 34% |
| Coalville | 36 | $3,711 | $440.00 | 33% |
| Mapleton | 11 | $3,385 | $365.91 | 41% |
| Heber City | 220 | $3,287 | $497.35 | 34% |
| Hideout | 105 | $3,209 | $453.17 | 35% |