Brighton Airbnb Market Analysis 2026: Short Term Rental Data & Vacation Rental Statistics in Utah, United States
Is Airbnb profitable in Brighton in 2026? Explore comprehensive Airbnb analytics for Brighton, Utah, United States to uncover income potential. This 2026 STR market report for Brighton, based on AirROI data from February 2025 to January 2026, reveals key trends in the niche market of 151 active listings.
Whether you're considering an Airbnb investment in Brighton, optimizing your existing vacation rental, or exploring rental arbitrage opportunities, understanding the Brighton Airbnb data is crucial. Leveraging the low regulation environment is key to maximizing your short term rental income potential. Let's dive into the specifics.
Key Brighton Airbnb Performance Metrics Overview
Monthly Airbnb Revenue Variations & Income Potential in Brighton (2026)
Understanding the monthly revenue variations for Airbnb listings in Brighton is key to maximizing your short term rental income potential. Seasonality significantly impacts earnings. Our analysis, based on data from the past 12 months, shows that the peak revenue month for STRs in Brighton is typically March, while May often presents the lowest earnings, highlighting opportunities for strategic pricing adjustments during shoulder and low seasons. Explore the typical Airbnb income in Brighton across different performance tiers:
- Best-in-class properties (Top 10%) achieve $11,800+ monthly, often utilizing dynamic pricing and superior guest experiences.
- Strong performing properties (Top 25%) earn $7,874 or more, indicating effective management and desirable locations/amenities.
- Typical properties (Median) generate around $4,941 per month, representing the average market performance.
- Entry-level properties (Bottom 25%) see earnings around $2,922, often with potential for optimization.
Average Monthly Airbnb Earnings Trend in Brighton
Brighton Airbnb Occupancy Rate Trends (2026)
Maximize your bookings by understanding the Brighton STR occupancy trends. Seasonal demand shifts significantly influence how often properties are booked. Typically, Februarysees the highest demand (peak season occupancy), while May experiences the lowest (low season). Effective strategies, like adjusting minimum stays or offering promotions, can boost occupancy during slower periods. Here's how different property tiers perform in Brighton:
- Best-in-class properties (Top 10%) achieve 66%+ occupancy, indicating high desirability and potentially optimized availability.
- Strong performing properties (Top 25%) maintain 49% or higher occupancy, suggesting good market fit and guest satisfaction.
- Typical properties (Median) have an occupancy rate around 33%.
- Entry-level properties (Bottom 25%) average 19% occupancy, potentially facing higher vacancy.
Average Monthly Occupancy Rate Trend in Brighton
Average Daily Rate (ADR) Airbnb Trends in Brighton (2026)
Effective short term rental pricing strategy in Brighton involves understanding monthly ADR fluctuations. The Average Daily Rate (ADR) for Airbnb in Brighton typically peaks in January and dips lowest during May. Leveraging Airbnb dynamic pricing tools or strategies based on this seasonality can significantly boost revenue. Here's a look at the typical nightly rates achieved:
- Best-in-class properties (Top 10%) command rates of $981+ per night, often due to premium features or locations.
- Strong performing properties (Top 25%) achieve nightly rates of $681 or more.
- Typical properties (Median) charge around $464 per night.
- Entry-level properties (Bottom 25%) earn around $328 per night.
Average Daily Rate (ADR) Trend by Month in Brighton
Get Live Brighton Market Intelligence 👇

Explore Real-time Analytics
Airbnb Seasonality Analysis & Trends in Brighton (2026)
Peak Season (March, February, December)
- Revenue averages $11,969 per month
- Occupancy rates average 56.6%
- Daily rates average $693
Shoulder Season
- Revenue averages $4,431 per month
- Occupancy maintains around 30.9%
- Daily rates hold near $532
Low Season (May, June, September)
- Revenue drops to average $2,985 per month
- Occupancy decreases to average 25.3%
- Daily rates adjust to average $450
Seasonality Insights for Brighton
- The Airbnb seasonality in Brighton shows highly seasonal trends requiring careful strategy. While the sections above show seasonal averages, it's also insightful to look at the extremes:
- During the high season, the absolute peak month showcases Brighton's highest earning potential, with monthly revenues capable of climbing to $14,322, occupancy reaching a high of 70.0%, and ADRs peaking at $784.
- Conversely, the slowest single month of the year, typically falling within the low season, marks the market's lowest point. In this month, revenue might dip to $2,507, occupancy could drop to 22.0%, and ADRs may adjust down to $436.
- Understanding both the seasonal averages and these monthly peaks and troughs in revenue, occupancy, and ADR is crucial for maximizing your Airbnb profit potential in Brighton.
Seasonal Strategies for Maximizing Profit
- Peak Season: Maximize revenue through premium pricing and potentially longer minimum stays. Ensure high availability.
- Low Season: Offer competitive pricing, special promotions (e.g., extended stay discounts), and flexible cancellation policies. Target off-season travelers like remote workers or budget-conscious guests.
- Shoulder Seasons: Implement dynamic pricing that balances peak and low rates. Target weekend travelers or specific events. Offer slightly more flexible terms than peak season.
- Regularly analyze your own performance against these Brighton seasonality benchmarks and adjust your pricing and availability strategy accordingly.
Best Areas for Airbnb Investment in Brighton (2026)
Exploring the top neighborhoods for short-term rentals in Brighton? This section highlights key areas, outlining why they are attractive for hosts and guests, along with notable local attractions. Consider these locations based on your target guest profile and investment strategy.
| Neighborhood / Area | Why Host Here? (Target Guests & Appeal) | Key Attractions & Landmarks |
|---|---|---|
| Brighton Mountain Resort | A popular destination for skiers and snowboarders during winter and for mountain bikers and hikers in summer. Offers breathtaking views and a variety of outdoor activities year-round. | Brighton Ski Resort, Lake Mary, Silver Lake, Wasatch National Forest, Solitude Mountain Resort |
| Big Cottonwood Canyon | Known for its stunning natural beauty, this area attracts outdoor enthusiasts for hiking, camping, and skiing. Perfect for those who love nature and want to escape the city. | Big Cottonwood Canyon, Donut Falls, Skiing at Brighton and Solitude, Hiking Trails, Scenic Drives |
| Cottonwood Heights | A family-friendly area with access to several parks and outdoor recreational opportunities. It's close to both ski resorts and the city, making it a desirable location for tourists. | The Milly Ski Area, Dimple Dell Regional Park, Cottonwood Heights Recreation Center, Local Restaurants, Shopping Centers |
| Salt Lake City | Just a short drive away, Salt Lake City offers a vibrant urban experience with plenty of cultural attractions. Great for guests looking to explore a mix of city life and outdoor recreation. | Temple Square, Salt Lake City Public Library, Natural History Museum of Utah, City Creek Center, Hogle Zoo |
| Heber Valley | A beautiful area known for its outdoor activities, including fishing, boating, and golfing. Perfect for families and outdoor lovers looking for a relaxing getaway. | Deer Creek Reservoir, Heber Valley Railroad, Wasatch Mountain State Park, Golf Courses, Local Festivals |
| Park City | Known for its world-class ski resorts and the Sundance Film Festival. A rich cultural scene makes it an attractive destination for a variety of visitors year-round. | Park City Mountain Resort, Deer Valley Resort, Main Street, Sundance Film Festival, Alpine Coaster |
| Utah Olympic Park | Home to the 2002 Winter Olympics, this area offers unique experiences such as bobsledding, skiing, and visiting the Olympic museum. Perfect for adrenaline seekers and sports fans. | Utah Olympic Park, Olympic Ski Jump, Summer Sliding, Museum of Winter Sports, Adventure Park |
| Antelope Island State Park | A stunning natural area known for its wildlife, including bison and a variety of birds. Popular for hiking, biking, and nature photography, appealing to nature lovers. | Antelope Island, Bison Herds, Great Salt Lake, Hiking Trails, Birdwatching |
Understanding Airbnb License Requirements & STR Laws in Brighton (2026)
While Brighton, Utah, United States currently shows low STR regulations, specific Airbnb license requirements might still exist or change. Always verify the latest short term rental regulations and Airbnb license requirements directly with local government authorities for Brighton to ensure full compliance before hosting.
(Source: AirROI data, 2026, based on 1% licensed listings)
Top Performing Airbnb Properties in Brighton (2026)
Benchmark your potential! Explore examples of top-performing Airbnb properties in Brightonbased on Trailing Twelve Month (TTM) revenue. Analyze their characteristics, revenue, occupancy rate, and ADR to understand what drives success in this market.
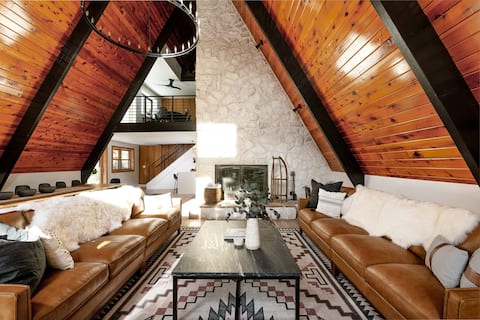
Nordic Haus | A-Frame w/ Spa & Sauna, Sleeps 24
Entire Place • 5 bedrooms

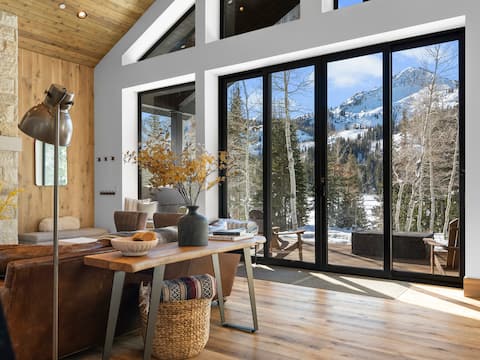
The Powder Palace | w/Spa, Sauna, BRAND NEW HOME
Entire Place • 5 bedrooms
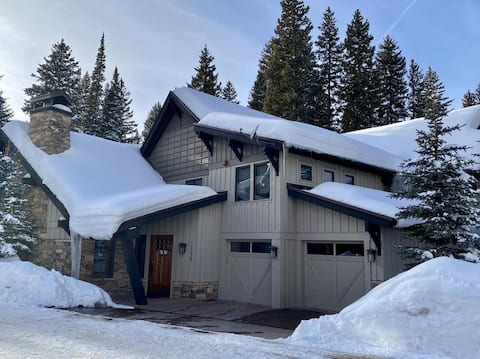
Brighton Evergreen Retreat: Views, Spa, Ski Access
Entire Place • 3 bedrooms
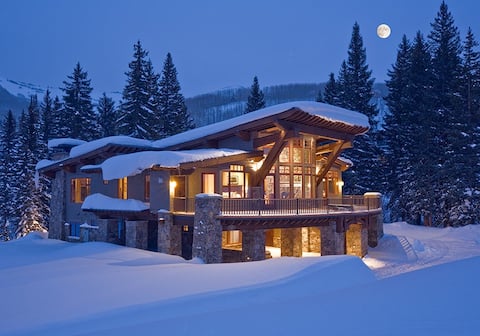
Basecamp by Cottonwood Lodging
Entire Place • 6 bedrooms

Castle Butenham by Cottonwood Lodging
Entire Place • 4 bedrooms
Solitude Ski In Ski Out Chalet with Hot Tub
Entire Place • 5 bedrooms
Note: Performance varies based on location, size, amenities, seasonality, and management quality. Data reflects the past 12 months.
Top Performing Airbnb Hosts in Brighton (2026)
Learn from the best! This table showcases top-performing Airbnb hosts in Brighton based on the number of properties managed and estimated total revenue over the past year. Analyze their scale and performance metrics.
| Host Name | Properties | Grossing Revenue | Stay Reviews | Avg Rating |
|---|---|---|---|---|
| Cottonwood Lodging | 36 | $2,387,266 | 819 | 4.91/5.0 |
| Evolve | 9 | $539,756 | 374 | 4.89/5.0 |
| Elisabeth Anne | 2 | $366,435 | 174 | 4.96/5.0 |
| Gary | 6 | $355,798 | 150 | 4.43/5.0 |
| Ben | 3 | $260,176 | 321 | 4.93/5.0 |
| Crystal | 1 | $171,547 | 16 | 5.00/5.0 |
| Austin | 6 | $157,995 | 191 | 4.89/5.0 |
| ITrip Vacations | 4 | $150,800 | 56 | 4.73/5.0 |
| Yiva | 1 | $143,488 | 7 | 5.00/5.0 |
| Steven | 1 | $139,533 | 6 | 5.00/5.0 |
Analyzing the strategies of top hosts, such as their property selection, pricing, and guest communication, can offer valuable lessons for optimizing your own Airbnb operations in Brighton.
Dive Deeper: Advanced Brighton STR Market Data (2026)
Ready to unlock more insights? AirROI provides access to advanced metrics and comprehensive Airbnb data for Brighton. Explore detailed analytics beyond this report to refine your investment strategy, optimize pricing, and maximize your vacation rental profits.
Explore Advanced MetricsBrighton Short-Term Rental Market Composition (2026): Property & Room Types
Room Type Distribution
Property Type Distribution
Market Composition Insights for Brighton
- The Brighton Airbnb market composition is heavily skewed towards Entire Home/Apt listings, which make up 99.3% of the 151 active rentals. This indicates strong guest preference for privacy and space.
- Looking at the property type distribution in Brighton, Apartment/Condo properties are the most common (48.3%), reflecting the local real estate landscape.
- Houses represent a significant 31.1% portion, catering likely to families or larger groups.
- Smaller segments like others, hotel/boutique (combined 1.4%) offer potential for unique stay experiences.
Brighton Airbnb Room Capacity Analysis (2026): Bedroom Distribution
Distribution of Listings by Number of Bedrooms
Room Capacity Insights for Brighton
- The dominant room capacity in Brighton is 2 bedrooms listings, making up 30.5% of the market. This suggests a strong demand for properties suitable for couples or solo travelers.
- Together, 2 bedrooms and 3 bedrooms properties represent 52.4% of the active Airbnb listings in Brighton, indicating a high concentration in these sizes.
- A significant 47.8% of listings offer 3+ bedrooms, catering to larger groups and families seeking more space in Brighton.
Brighton Vacation Rental Guest Capacity Trends (2026)
Distribution of Listings by Guest Capacity
Guest Capacity Insights for Brighton
- The most common guest capacity trend in Brighton vacation rentals is listings accommodating 8+ guests (48.3%). This suggests the primary traveler segment is likely larger groups.
- Properties designed for 8+ guests and 6 guests dominate the Brighton STR market, accounting for 72.8% of listings.
- 79.4% of properties accommodate 6+ guests, serving the market segment for larger families or group travel in Brighton.
- On average, properties in Brighton are equipped to host 6.6 guests.
Brighton Airbnb Booking Patterns (2026): Available vs. Booked Days
Available Days Distribution
Booked Days Distribution
Booking Pattern Insights for Brighton
- The most common availability pattern in Brighton falls within the 271-366 days range, representing 60.3% of listings. This suggests many properties have significant open periods on their calendars.
- Approximately 90.8% of listings show high availability (181+ days open annually), indicating potential for increased bookings or specific owner usage patterns.
- For booked days, the 31-90 days range is most frequent in Brighton (38.4%), reflecting common guest stay durations or potential owner blocking patterns.
- A notable 10.6% of properties secure long booking periods (181+ days booked per year), highlighting successful long-term rental strategies or significant owner usage.
Brighton Airbnb Minimum Stay Requirements Analysis
Distribution of Listings by Minimum Night Requirement
1 Night
10 listings
6.6% of total
2 Nights
34 listings
22.5% of total
3 Nights
19 listings
12.6% of total
4-6 Nights
9 listings
6% of total
7-29 Nights
2 listings
1.3% of total
30+ Nights
77 listings
51% of total
Key Insights
- The most prevalent minimum stay requirement in Brighton is 30+ Nights, adopted by 51% of listings. This highlights the market's preference for longer commitments.
- A significant segment (51%) caters to monthly stays (30+ nights) in Brighton, pointing to opportunities in the extended-stay market.
Recommendations
- Align with the market by considering a 30+ Nights minimum stay, as 51% of Brighton hosts use this setting.
- If feasible, allowing 1-night stays, especially midweek or during low season, could capture last-minute bookings, as only 6.6% currently do.
- Explore offering discounts for stays of 30+ nights to attract the 51% of the market seeking extended stays.
- Adjust minimum nights based on seasonality – potentially shorter during low season and longer during peak demand periods in Brighton.
Brighton Airbnb Cancellation Policy Trends Analysis (2026)
Limited
2 listings
1.3% of total
Super Strict 30 Days
8 listings
5.3% of total
Super Strict 60 Days
36 listings
23.8% of total
Flexible
2 listings
1.3% of total
Moderate
25 listings
16.6% of total
Firm
40 listings
26.5% of total
Strict
38 listings
25.2% of total
Cancellation Policy Insights for Brighton
- The prevailing Airbnb cancellation policy trend in Brighton is Firm, used by 26.5% of listings.
- A majority (51.7%) of hosts in Brighton utilize Firm or Strict policies, indicating a market where hosts prioritize booking security.
Recommendations for Hosts
- Consider adopting a Firm policy to align with the 26.5% market standard in Brighton.
- Regularly review your cancellation policy against competitors and market demand shifts in Brighton.
Brighton STR Booking Lead Time Analysis (2026)
Average Booking Lead Time by Month
Booking Lead Time Insights for Brighton
- The overall average booking lead time for vacation rentals in Brighton is 70 days.
- Guests book furthest in advance for stays during February (average 106 days), likely coinciding with peak travel demand or local events.
- The shortest booking windows occur for stays in May (average 28 days), indicating more last-minute travel plans during this time.
- Seasonally, Winter (90 days avg.) sees the longest lead times, while Fall (49 days avg.) has the shortest, reflecting typical travel planning cycles.
Recommendations for Hosts
- Use the overall average lead time (70 days) as a baseline for your pricing and availability strategy in Brighton.
- For February stays, consider implementing length-of-stay discounts or slightly higher rates for bookings made less than 106 days out to capitalize on advance planning.
- Target marketing efforts for the Winter season well in advance (at least 90 days) to capture early planners.
- Monitor your own booking lead times against these Brighton averages to identify opportunities for dynamic pricing adjustments.
Popular & Essential Airbnb Amenities in Brighton (2026)
Amenity Prevalence
Amenity Insights for Brighton
- Essential amenities in Brighton that guests expect include: Wifi, Smoke alarm, TV, Kitchen, Heating, Hair dryer, Dishes and silverware, Coffee maker, Essentials, Microwave. Lacking these (any) could significantly impact bookings.
Recommendations for Hosts
- Ensure your listing includes all essential amenities for Brighton: Wifi, Smoke alarm, TV, Kitchen, Heating, Hair dryer, Dishes and silverware, Coffee maker, Essentials, Microwave.
- Prioritize adding missing essentials: Smoke alarm, TV, Kitchen, Heating, Hair dryer, Dishes and silverware, Coffee maker, Essentials, Microwave.
- Highlight unique or less common amenities you offer (e.g., hot tub, dedicated workspace, EV charger) in your listing description and photos.
- Regularly check competitor amenities in Brighton to stay competitive.
Brighton Airbnb Guest Demographics & Profile Analysis (2026)
Guest Profile Summary for Brighton
- The typical guest profile for Airbnb in Brighton consists of primarily domestic travelers (97%), often arriving from nearby Salt Lake City, typically belonging to the Post-2000s (Gen Z/Alpha) group (50%), primarily speaking English or Spanish.
- Domestic travelers account for 96.8% of guests.
- Key international markets include United States (96.8%) and DC (0.7%).
- Top languages spoken are English (64.6%) followed by Spanish (12.5%).
- A significant demographic segment is the Post-2000s (Gen Z/Alpha) group, representing 50% of guests.
Recommendations for Hosts
- Target domestic marketing efforts towards travelers from Salt Lake City and New York.
- Tailor amenities and listing descriptions to appeal to the dominant Post-2000s (Gen Z/Alpha) demographic (e.g., highlight fast WiFi, smart home features, local guides).
- Highlight unique local experiences or amenities relevant to the primary guest profile.
- Consider seasonal promotions aligned with peak travel times for key origin markets.
Nearby Short-Term Rental Market Comparison
How does the Brighton Airbnb market stack up against its neighbors? Compare key performance metrics like average monthly revenue, ADR, and occupancy rates in surrounding areas to understand the broader regional STR landscape.
| Market | Active Properties | Monthly Revenue | Daily Rate | Avg. Occupancy |
|---|---|---|---|---|
| Sundance | 61 | $6,552 | $867.92 | 33% |
| Alta | 44 | $5,993 | $971.20 | 39% |
| Daniel | 25 | $5,231 | $693.40 | 34% |
| Oakley | 12 | $4,163 | $875.37 | 32% |
| Park City | 4,036 | $4,087 | $626.69 | 34% |
| Coalville | 36 | $3,711 | $440.00 | 33% |
| Mapleton | 11 | $3,385 | $365.91 | 41% |
| Heber City | 220 | $3,287 | $497.35 | 34% |
| Hideout | 105 | $3,209 | $453.17 | 35% |
| Heber | 116 | $3,095 | $345.19 | 37% |