Willis Airbnb Market Analysis 2026: Short Term Rental Data & Vacation Rental Statistics in Texas, United States
Is Airbnb profitable in Willis in 2026? Explore comprehensive Airbnb analytics for Willis, Texas, United States to uncover income potential. This 2026 STR market report for Willis, based on AirROI data from February 2025 to January 2026, reveals key trends in the market of 217 active listings.
Whether you're considering an Airbnb investment in Willis, optimizing your existing vacation rental, or exploring rental arbitrage opportunities, understanding the Willis Airbnb data is crucial. Leveraging the low regulation environment is key to maximizing your short term rental income potential. Let's dive into the specifics.
Key Willis Airbnb Performance Metrics Overview
Monthly Airbnb Revenue Variations & Income Potential in Willis (2026)
Understanding the monthly revenue variations for Airbnb listings in Willis is key to maximizing your short term rental income potential. Seasonality significantly impacts earnings. Our analysis, based on data from the past 12 months, shows that the peak revenue month for STRs in Willis is typically July, while February often presents the lowest earnings, highlighting opportunities for strategic pricing adjustments during shoulder and low seasons. Explore the typical Airbnb income in Willis across different performance tiers:
- Best-in-class properties (Top 10%) achieve $5,657+ monthly, often utilizing dynamic pricing and superior guest experiences.
- Strong performing properties (Top 25%) earn $3,027 or more, indicating effective management and desirable locations/amenities.
- Typical properties (Median) generate around $1,615 per month, representing the average market performance.
- Entry-level properties (Bottom 25%) see earnings around $821, often with potential for optimization.
Average Monthly Airbnb Earnings Trend in Willis
Willis Airbnb Occupancy Rate Trends (2026)
Maximize your bookings by understanding the Willis STR occupancy trends. Seasonal demand shifts significantly influence how often properties are booked. Typically, Junesees the highest demand (peak season occupancy), while January experiences the lowest (low season). Effective strategies, like adjusting minimum stays or offering promotions, can boost occupancy during slower periods. Here's how different property tiers perform in Willis:
- Best-in-class properties (Top 10%) achieve 67%+ occupancy, indicating high desirability and potentially optimized availability.
- Strong performing properties (Top 25%) maintain 48% or higher occupancy, suggesting good market fit and guest satisfaction.
- Typical properties (Median) have an occupancy rate around 30%.
- Entry-level properties (Bottom 25%) average 16% occupancy, potentially facing higher vacancy.
Average Monthly Occupancy Rate Trend in Willis
Average Daily Rate (ADR) Airbnb Trends in Willis (2026)
Effective short term rental pricing strategy in Willis involves understanding monthly ADR fluctuations. The Average Daily Rate (ADR) for Airbnb in Willis typically peaks in November and dips lowest during April. Leveraging Airbnb dynamic pricing tools or strategies based on this seasonality can significantly boost revenue. Here's a look at the typical nightly rates achieved:
- Best-in-class properties (Top 10%) command rates of $430+ per night, often due to premium features or locations.
- Strong performing properties (Top 25%) achieve nightly rates of $248 or more.
- Typical properties (Median) charge around $165 per night.
- Entry-level properties (Bottom 25%) earn around $116 per night.
Average Daily Rate (ADR) Trend by Month in Willis
Get Live Willis Market Intelligence 👇

Explore Real-time Analytics
Airbnb Seasonality Analysis & Trends in Willis (2026)
Peak Season (July, June, November)
- Revenue averages $3,258 per month
- Occupancy rates average 39.4%
- Daily rates average $257
Shoulder Season
- Revenue averages $2,582 per month
- Occupancy maintains around 33.9%
- Daily rates hold near $246
Low Season (January, February, September)
- Revenue drops to average $2,056 per month
- Occupancy decreases to average 28.2%
- Daily rates adjust to average $245
Seasonality Insights for Willis
- The Airbnb seasonality in Willis shows moderate seasonality with distinct peak and low periods. While the sections above show seasonal averages, it's also insightful to look at the extremes:
- During the high season, the absolute peak month showcases Willis's highest earning potential, with monthly revenues capable of climbing to $3,489, occupancy reaching a high of 41.3%, and ADRs peaking at $260.
- Conversely, the slowest single month of the year, typically falling within the low season, marks the market's lowest point. In this month, revenue might dip to $1,721, occupancy could drop to 26.0%, and ADRs may adjust down to $234.
- Understanding both the seasonal averages and these monthly peaks and troughs in revenue, occupancy, and ADR is crucial for maximizing your Airbnb profit potential in Willis.
Seasonal Strategies for Maximizing Profit
- Peak Season: Maximize revenue through premium pricing and potentially longer minimum stays. Ensure high availability.
- Low Season: Offer competitive pricing, special promotions (e.g., extended stay discounts), and flexible cancellation policies. Target off-season travelers like remote workers or budget-conscious guests.
- Shoulder Seasons: Implement dynamic pricing that balances peak and low rates. Target weekend travelers or specific events. Offer slightly more flexible terms than peak season.
- Regularly analyze your own performance against these Willis seasonality benchmarks and adjust your pricing and availability strategy accordingly.
Best Areas for Airbnb Investment in Willis (2026)
Exploring the top neighborhoods for short-term rentals in Willis? This section highlights key areas, outlining why they are attractive for hosts and guests, along with notable local attractions. Consider these locations based on your target guest profile and investment strategy.
| Neighborhood / Area | Why Host Here? (Target Guests & Appeal) | Key Attractions & Landmarks |
|---|---|---|
| Lake Livingston | A popular destination for outdoor enthusiasts and water sports. Ideal for guests looking for a relaxing getaway with fishing, boating, and scenic views. | Lake Livingston State Park, Fishing and boating, Camping sites, Picnic areas, Scenic views of the lake |
| Sam Houston National Forest | A vast natural area offering hiking, camping, and wildlife watching. Perfect for nature lovers and those seeking tranquility away from urban life. | Hiking trails, Camping areas, Wildlife viewing, Lake Conroe nearby, Biking paths |
| Downtown Willis | The charming downtown area with local restaurants and shops, attracting visitors looking for a quaint Texan experience. | Local eateries, Willis Library, Community parks, Arts and crafts fairs, Historic architecture |
| Conroe | Nearby city with a growing population and numerous attractions, appealing to shorter stays and business travelers. | Conroe Aquatic Center, The Woodlands Mall, Local breweries, Parks and recreational areas, Conroe's historic district |
| Montgomery | A picturesque small town known for its proximity to Lake Conroe and rich Texas history, popular among families and history buffs. | Historic Montgomery, Lake Conroe, Caddo Lake State Park, Local festivals, Shopping boutiques |
| The Woodlands | A master-planned community with upscale amenities and shopping centers, great for business travelers and families. | The Woodlands Mall, Market Street, Parks and trails, Live music venues, The Cynthia Woods Mitchell Pavilion |
| New Waverly | A small town close to Sam Houston National Forest, ideal for guests wanting a peaceful retreat amidst nature. | Sam Houston National Forest, Historic sites, Local diners, Rural charm, Nature trails |
| Cut and Shoot | A unique small town with a quirky name and close proximity to attractions like Lake Conroe, attracting visitors looking for something different. | Nearby Lake Conroe, Local parks, Friendly community events, Quaint diners, Nature walks |
Understanding Airbnb License Requirements & STR Laws in Willis (2026)
While Willis, Texas, United States currently shows low STR regulations, specific Airbnb license requirements might still exist or change. Always verify the latest short term rental regulations and Airbnb license requirements directly with local government authorities for Willis to ensure full compliance before hosting.
(Source: AirROI data, 2026, finding no licensed listings among those analyzed)
Top Performing Airbnb Properties in Willis (2026)
Benchmark your potential! Explore examples of top-performing Airbnb properties in Willisbased on Trailing Twelve Month (TTM) revenue. Analyze their characteristics, revenue, occupancy rate, and ADR to understand what drives success in this market.
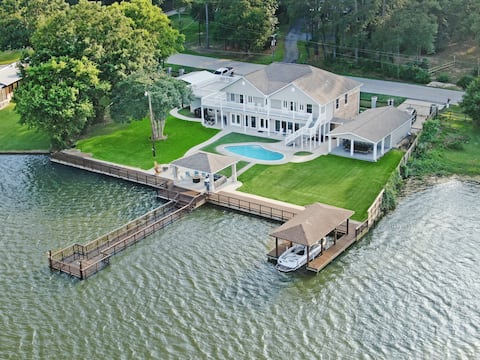
Waterfront retreat on Lake Conroe - Sleeps 24!
Entire Place • 7 bedrooms
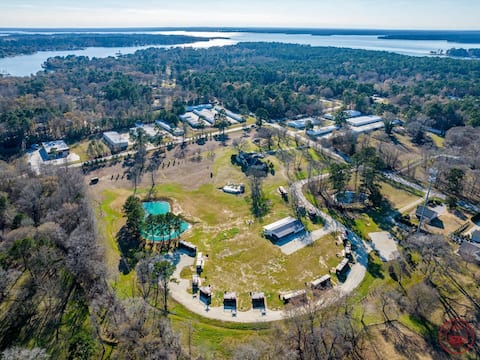
The Jubilee:Ranch with Rustic Home + 14 tiny homes
Entire Place • 17 bedrooms
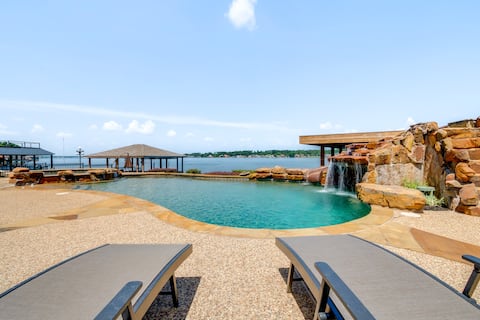
Conroe Lake House: Luxe Pool, Private Dock & Games
Entire Place • 4 bedrooms

Lakefront Retreat family/Busines
Entire Place • 3 bedrooms
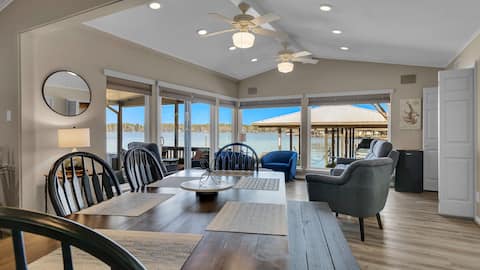
Lake House- dock, hot tub, kayaks, screened porch
Entire Place • 4 bedrooms
*NEW*Lakefront>heated pool>Games galore>Golden-T
Entire Place • 6 bedrooms
Note: Performance varies based on location, size, amenities, seasonality, and management quality. Data reflects the past 12 months.
Top Performing Airbnb Hosts in Willis (2026)
Learn from the best! This table showcases top-performing Airbnb hosts in Willis based on the number of properties managed and estimated total revenue over the past year. Analyze their scale and performance metrics.
| Host Name | Properties | Grossing Revenue | Stay Reviews | Avg Rating |
|---|---|---|---|---|
| Chris | 19 | $714,234 | 419 | 4.94/5.0 |
| Evolve | 13 | $392,793 | 450 | 4.74/5.0 |
| Lauren | 1 | $298,647 | 63 | 4.98/5.0 |
| Rachel | 3 | $220,922 | 98 | 4.95/5.0 |
| Amy Rogers | 4 | $159,640 | 93 | 4.86/5.0 |
| Charmain | 2 | $131,011 | 11 | 4.78/5.0 |
| Jeramie | 3 | $120,789 | 135 | 4.86/5.0 |
| Robert | 11 | $94,344 | 475 | 4.86/5.0 |
| Shane | 1 | $90,900 | 45 | 4.67/5.0 |
| Krystal | 1 | $89,604 | 103 | 4.97/5.0 |
Analyzing the strategies of top hosts, such as their property selection, pricing, and guest communication, can offer valuable lessons for optimizing your own Airbnb operations in Willis.
Dive Deeper: Advanced Willis STR Market Data (2026)
Ready to unlock more insights? AirROI provides access to advanced metrics and comprehensive Airbnb data for Willis. Explore detailed analytics beyond this report to refine your investment strategy, optimize pricing, and maximize your vacation rental profits.
Explore Advanced MetricsWillis Short-Term Rental Market Composition (2026): Property & Room Types
Room Type Distribution
Property Type Distribution
Market Composition Insights for Willis
- The Willis Airbnb market composition is heavily skewed towards Entire Home/Apt listings, which make up 96.3% of the 217 active rentals. This indicates strong guest preference for privacy and space.
- Looking at the property type distribution in Willis, House properties are the most common (58.5%), reflecting the local real estate landscape.
- Houses represent a significant 58.5% portion, catering likely to families or larger groups.
- Smaller segments like unique stays, hotel/boutique (combined 1.8%) offer potential for unique stay experiences.
Willis Airbnb Room Capacity Analysis (2026): Bedroom Distribution
Distribution of Listings by Number of Bedrooms
Room Capacity Insights for Willis
- The dominant room capacity in Willis is 2 bedrooms listings, making up 27.6% of the market. This suggests a strong demand for properties suitable for couples or solo travelers.
- Together, 2 bedrooms and 3 bedrooms properties represent 53.9% of the active Airbnb listings in Willis, indicating a high concentration in these sizes.
- A significant 41.9% of listings offer 3+ bedrooms, catering to larger groups and families seeking more space in Willis.
Willis Vacation Rental Guest Capacity Trends (2026)
Distribution of Listings by Guest Capacity
Guest Capacity Insights for Willis
- The most common guest capacity trend in Willis vacation rentals is listings accommodating 8+ guests (34.6%). This suggests the primary traveler segment is likely larger groups.
- Properties designed for 8+ guests and 4 guests dominate the Willis STR market, accounting for 51.7% of listings.
- 53.0% of properties accommodate 6+ guests, serving the market segment for larger families or group travel in Willis.
- On average, properties in Willis are equipped to host 5.4 guests.
Willis Airbnb Booking Patterns (2026): Available vs. Booked Days
Available Days Distribution
Booked Days Distribution
Booking Pattern Insights for Willis
- The most common availability pattern in Willis falls within the 271-366 days range, representing 56.2% of listings. This suggests many properties have significant open periods on their calendars.
- Approximately 88.5% of listings show high availability (181+ days open annually), indicating potential for increased bookings or specific owner usage patterns.
- For booked days, the 31-90 days range is most frequent in Willis (34.6%), reflecting common guest stay durations or potential owner blocking patterns.
- A notable 12.5% of properties secure long booking periods (181+ days booked per year), highlighting successful long-term rental strategies or significant owner usage.
Willis Airbnb Minimum Stay Requirements Analysis
Distribution of Listings by Minimum Night Requirement
1 Night
65 listings
30% of total
2 Nights
100 listings
46.1% of total
3 Nights
12 listings
5.5% of total
4-6 Nights
1 listings
0.5% of total
7-29 Nights
4 listings
1.8% of total
30+ Nights
35 listings
16.1% of total
Key Insights
- The most prevalent minimum stay requirement in Willis is 2 Nights, adopted by 46.1% of listings. This highlights the market's preference for shorter, flexible bookings.
- A strong majority (76.1%) of the Willis Airbnb data shows acceptance of very short stays (1-2 nights), indicating a dynamic, high-turnover market.
- A significant segment (16.1%) caters to monthly stays (30+ nights) in Willis, pointing to opportunities in the extended-stay market.
Recommendations
- Align with the market by considering a 2 Nights minimum stay, as 46.1% of Willis hosts use this setting.
- Explore offering discounts for stays of 30+ nights to attract the 16.1% of the market seeking extended stays.
- Adjust minimum nights based on seasonality – potentially shorter during low season and longer during peak demand periods in Willis.
Willis Airbnb Cancellation Policy Trends Analysis (2026)
Super Strict 30 Days
1 listings
0.5% of total
Limited
4 listings
1.8% of total
Flexible
64 listings
29.5% of total
Moderate
60 listings
27.6% of total
Firm
55 listings
25.3% of total
Strict
33 listings
15.2% of total
Cancellation Policy Insights for Willis
- The prevailing Airbnb cancellation policy trend in Willis is Flexible, used by 29.5% of listings.
- There's a relatively balanced mix between guest-friendly (57.1%) and stricter (40.5%) policies, offering choices for different guest needs.
Recommendations for Hosts
- Consider adopting a Flexible policy to align with the 29.5% market standard in Willis.
- Regularly review your cancellation policy against competitors and market demand shifts in Willis.
Willis STR Booking Lead Time Analysis (2026)
Average Booking Lead Time by Month
Booking Lead Time Insights for Willis
- The overall average booking lead time for vacation rentals in Willis is 38 days.
- Guests book furthest in advance for stays during November (average 57 days), likely coinciding with peak travel demand or local events.
- The shortest booking windows occur for stays in March (average 31 days), indicating more last-minute travel plans during this time.
- Seasonally, Fall (47 days avg.) sees the longest lead times, while Spring (42 days avg.) has the shortest, reflecting typical travel planning cycles.
Recommendations for Hosts
- Use the overall average lead time (38 days) as a baseline for your pricing and availability strategy in Willis.
- For November stays, consider implementing length-of-stay discounts or slightly higher rates for bookings made less than 57 days out to capitalize on advance planning.
- Target marketing efforts for the Fall season well in advance (at least 47 days) to capture early planners.
- Monitor your own booking lead times against these Willis averages to identify opportunities for dynamic pricing adjustments.
Popular & Essential Airbnb Amenities in Willis (2026)
Amenity Prevalence
Amenity Insights for Willis
- Essential amenities in Willis that guests expect include: Air conditioning, Free parking on premises, Wifi, TV, Heating. Lacking these (any) could significantly impact bookings.
- Popular amenities like Smoke alarm, Kitchen, Microwave are common but not universal. Offering these can provide a competitive edge.
Recommendations for Hosts
- Ensure your listing includes all essential amenities for Willis: Air conditioning, Free parking on premises, Wifi, TV, Heating.
- Prioritize adding missing essentials: Free parking on premises, Wifi, TV, Heating.
- Consider adding popular differentiators like Smoke alarm or Kitchen to increase appeal.
- Highlight unique or less common amenities you offer (e.g., hot tub, dedicated workspace, EV charger) in your listing description and photos.
- Regularly check competitor amenities in Willis to stay competitive.
Willis Airbnb Guest Demographics & Profile Analysis (2026)
Guest Profile Summary for Willis
- The typical guest profile for Airbnb in Willis consists of primarily domestic travelers (98%), often arriving from nearby Houston, typically belonging to the Post-2000s (Gen Z/Alpha) group (50%), primarily speaking English or Spanish.
- Domestic travelers account for 97.8% of guests.
- Key international markets include United States (97.8%) and Mexico (0.7%).
- Top languages spoken are English (75.5%) followed by Spanish (16.8%).
- A significant demographic segment is the Post-2000s (Gen Z/Alpha) group, representing 50% of guests.
Recommendations for Hosts
- Target domestic marketing efforts towards travelers from Houston and Dallas.
- Tailor amenities and listing descriptions to appeal to the dominant Post-2000s (Gen Z/Alpha) demographic (e.g., highlight fast WiFi, smart home features, local guides).
- Highlight unique local experiences or amenities relevant to the primary guest profile.
- Consider seasonal promotions aligned with peak travel times for key origin markets.
Nearby Short-Term Rental Market Comparison
How does the Willis Airbnb market stack up against its neighbors? Compare key performance metrics like average monthly revenue, ADR, and occupancy rates in surrounding areas to understand the broader regional STR landscape.
| Market | Active Properties | Monthly Revenue | Daily Rate | Avg. Occupancy |
|---|---|---|---|---|
| Fairfield | 10 | $4,761 | $360.96 | 42% |
| Jamaica Beach | 199 | $3,774 | $394.20 | 37% |
| Crystal Beach | 143 | $3,768 | $408.48 | 35% |
| Bolivar Peninsula | 913 | $3,311 | $396.49 | 34% |
| Columbus | 17 | $3,218 | $413.88 | 29% |
| Deer Park | 14 | $3,208 | $228.63 | 51% |
| Schulenburg | 25 | $3,157 | $349.06 | 31% |
| Chappell Hill | 11 | $2,947 | $509.72 | 31% |
| Streetman | 20 | $2,898 | $336.71 | 32% |
| Seabrook | 54 | $2,872 | $263.19 | 39% |