Vernon Airbnb Market Analysis 2026: Short Term Rental Data & Vacation Rental Statistics in Texas, United States
Is Airbnb profitable in Vernon in 2026? Explore comprehensive Airbnb analytics for Vernon, Texas, United States to uncover income potential. This 2026 STR market report for Vernon, based on AirROI data from February 2025 to January 2026, reveals key trends in the niche market of 20 active listings.
Whether you're considering an Airbnb investment in Vernon, optimizing your existing vacation rental, or exploring rental arbitrage opportunities, understanding the Vernon Airbnb data is crucial. Leveraging the low regulation environment is key to maximizing your short term rental income potential. Let's dive into the specifics.
Key Vernon Airbnb Performance Metrics Overview
Monthly Airbnb Revenue Variations & Income Potential in Vernon (2026)
Understanding the monthly revenue variations for Airbnb listings in Vernon is key to maximizing your short term rental income potential. Seasonality significantly impacts earnings. Our analysis, based on data from the past 12 months, shows that the peak revenue month for STRs in Vernon is typically July, while April often presents the lowest earnings, highlighting opportunities for strategic pricing adjustments during shoulder and low seasons. Explore the typical Airbnb income in Vernon across different performance tiers:
- Best-in-class properties (Top 10%) achieve $4,103+ monthly, often utilizing dynamic pricing and superior guest experiences.
- Strong performing properties (Top 25%) earn $3,199 or more, indicating effective management and desirable locations/amenities.
- Typical properties (Median) generate around $2,134 per month, representing the average market performance.
- Entry-level properties (Bottom 25%) see earnings around $1,415, often with potential for optimization.
Average Monthly Airbnb Earnings Trend in Vernon
Vernon Airbnb Occupancy Rate Trends (2026)
Maximize your bookings by understanding the Vernon STR occupancy trends. Seasonal demand shifts significantly influence how often properties are booked. Typically, Maysees the highest demand (peak season occupancy), while April experiences the lowest (low season). Effective strategies, like adjusting minimum stays or offering promotions, can boost occupancy during slower periods. Here's how different property tiers perform in Vernon:
- Best-in-class properties (Top 10%) achieve 86%+ occupancy, indicating high desirability and potentially optimized availability.
- Strong performing properties (Top 25%) maintain 68% or higher occupancy, suggesting good market fit and guest satisfaction.
- Typical properties (Median) have an occupancy rate around 50%.
- Entry-level properties (Bottom 25%) average 32% occupancy, potentially facing higher vacancy.
Average Monthly Occupancy Rate Trend in Vernon
Average Daily Rate (ADR) Airbnb Trends in Vernon (2026)
Effective short term rental pricing strategy in Vernon involves understanding monthly ADR fluctuations. The Average Daily Rate (ADR) for Airbnb in Vernon typically peaks in October and dips lowest during April. Leveraging Airbnb dynamic pricing tools or strategies based on this seasonality can significantly boost revenue. Here's a look at the typical nightly rates achieved:
- Best-in-class properties (Top 10%) command rates of $202+ per night, often due to premium features or locations.
- Strong performing properties (Top 25%) achieve nightly rates of $172 or more.
- Typical properties (Median) charge around $139 per night.
- Entry-level properties (Bottom 25%) earn around $113 per night.
Average Daily Rate (ADR) Trend by Month in Vernon
Get Live Vernon Market Intelligence 👇

Explore Real-time Analytics
Airbnb Seasonality Analysis & Trends in Vernon (2026)
Peak Season (July, December, May)
- Revenue averages $2,836 per month
- Occupancy rates average 60.4%
- Daily rates average $147
Shoulder Season
- Revenue averages $2,430 per month
- Occupancy maintains around 52.4%
- Daily rates hold near $148
Low Season (January, March, April)
- Revenue drops to average $1,867 per month
- Occupancy decreases to average 41.4%
- Daily rates adjust to average $139
Seasonality Insights for Vernon
- The Airbnb seasonality in Vernon shows moderate seasonality with distinct peak and low periods. While the sections above show seasonal averages, it's also insightful to look at the extremes:
- During the high season, the absolute peak month showcases Vernon's highest earning potential, with monthly revenues capable of climbing to $2,922, occupancy reaching a high of 63.6%, and ADRs peaking at $153.
- Conversely, the slowest single month of the year, typically falling within the low season, marks the market's lowest point. In this month, revenue might dip to $1,570, occupancy could drop to 36.2%, and ADRs may adjust down to $133.
- Understanding both the seasonal averages and these monthly peaks and troughs in revenue, occupancy, and ADR is crucial for maximizing your Airbnb profit potential in Vernon.
Seasonal Strategies for Maximizing Profit
- Peak Season: Maximize revenue through premium pricing and potentially longer minimum stays. Ensure high availability.
- Low Season: Offer competitive pricing, special promotions (e.g., extended stay discounts), and flexible cancellation policies. Target off-season travelers like remote workers or budget-conscious guests.
- Shoulder Seasons: Implement dynamic pricing that balances peak and low rates. Target weekend travelers or specific events. Offer slightly more flexible terms than peak season.
- Regularly analyze your own performance against these Vernon seasonality benchmarks and adjust your pricing and availability strategy accordingly.
Best Areas for Airbnb Investment in Vernon (2026)
Exploring the top neighborhoods for short-term rentals in Vernon? This section highlights key areas, outlining why they are attractive for hosts and guests, along with notable local attractions. Consider these locations based on your target guest profile and investment strategy.
| Neighborhood / Area | Why Host Here? (Target Guests & Appeal) | Key Attractions & Landmarks |
|---|---|---|
| Vernon Downtown | Vernon Downtown is the heart of the city with charming shops, restaurants, and historical sites. It's a prime location for travelers wanting to explore local culture and history. | Vernon College, Graham Drive-In Theater, Wilbarger County Historical Museum, Main Street, Vernon Farmers Market |
| Lake Vernon | Lake Vernon is a popular recreational area where visitors come for fishing, boating, and enjoying the outdoors. Ideal for nature lovers and families seeking leisure activities. | Lake Vernon Park, fishing spots, picnic areas, nature trails |
| Wichita River | The Wichita River area is great for outdoor enthusiasts and offers beautiful views, parks, and scenic walking trails, appealing to those who enjoy nature and photography. | Wichita River Walk, Riverside Park, Vernon Municipal Golf Course |
| North Vernon | This suburban area features quiet neighborhoods and family-friendly amenities. It attracts visiting families and individuals looking for a peaceful stay. | local parks, neighborhood cafes, family activities, quiet streets |
| Bernard Park | Bernard Park is a vibrant community park that hosts various local events and gatherings. Great for visitors wanting to engage with the community. | playground, sports facilities, community events, walkable trails |
| Vernon Industrial Park | An area near industrial sites and businesses, attracting business travelers and professionals visiting for corporate reasons, boosting the need for short-term rentals. | convenience stores, business amenities, meeting spaces |
| Vernon High School | This area is often sought after for its proximity to educational institutions, attracting visiting families during school events and sporting events. | sports events, school activities, local shops |
| Cultural District | This area includes galleries, theaters, and local cultural institutions, drawing visitors interested in arts and culture, making it a vibrant area for hosting. | local theaters, art exhibits, cultural festivals, dining options |
Understanding Airbnb License Requirements & STR Laws in Vernon (2026)
While Vernon, Texas, United States currently shows low STR regulations, specific Airbnb license requirements might still exist or change. Always verify the latest short term rental regulations and Airbnb license requirements directly with local government authorities for Vernon to ensure full compliance before hosting.
(Source: AirROI data, 2026, finding no licensed listings among those analyzed)
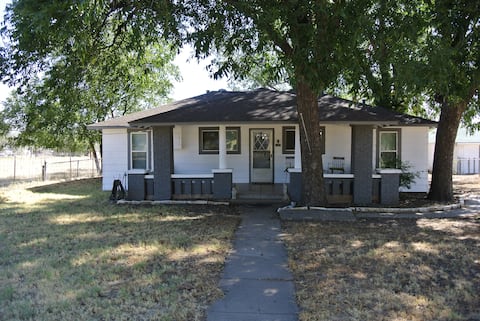
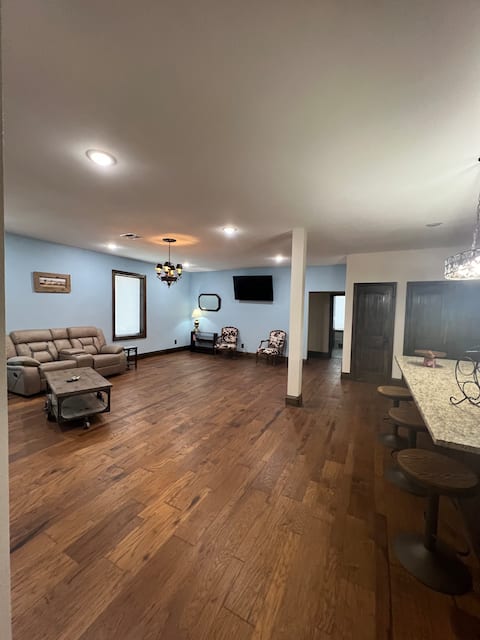
Top Performing Airbnb Properties in Vernon (2026)
Benchmark your potential! Explore examples of top-performing Airbnb properties in Vernonbased on Trailing Twelve Month (TTM) revenue. Analyze their characteristics, revenue, occupancy rate, and ADR to understand what drives success in this market.
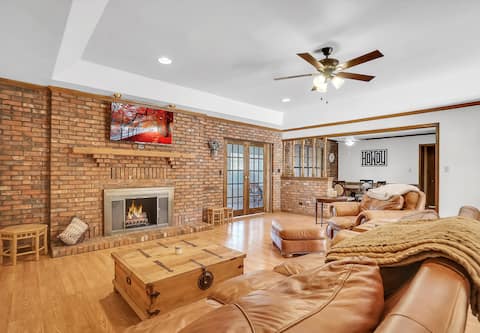
Oaklawn Retreat -4BR-2.5 Bath -Sleeps 8-Patio
Entire Place • 4 bedrooms

Vernon Home Big Enough for the Whole Family
Entire Place • 3 bedrooms
Quiet Neighborhood Craftsman
Entire Place • 2 bedrooms
Spacious downtown apartment in Vernon!
Entire Place • 3 bedrooms

Downtown Vernon apt rental!
Entire Place • 2 bedrooms

Cliff’s Crib
Entire Place • 1 bedroom
Note: Performance varies based on location, size, amenities, seasonality, and management quality. Data reflects the past 12 months.
Top Performing Airbnb Hosts in Vernon (2026)
Learn from the best! This table showcases top-performing Airbnb hosts in Vernon based on the number of properties managed and estimated total revenue over the past year. Analyze their scale and performance metrics.
| Host Name | Properties | Grossing Revenue | Stay Reviews | Avg Rating |
|---|---|---|---|---|
| Meredith | 3 | $91,221 | 276 | 4.88/5.0 |
| Sue Anne | 3 | $62,172 | 89 | 4.93/5.0 |
| Kataluma 85 Bnbs | 2 | $59,306 | 102 | 4.81/5.0 |
| Chris | 1 | $39,931 | 29 | 4.97/5.0 |
| Amelia Rose | 1 | $25,333 | 23 | 4.78/5.0 |
| Tiffany | 2 | $24,949 | 54 | 4.82/5.0 |
| Candace | 1 | $24,827 | 87 | 4.95/5.0 |
| Hunter | 1 | $24,740 | 18 | 4.78/5.0 |
| Heidi | 2 | $24,717 | 12 | 5.00/5.0 |
| Jennifer | 1 | $20,227 | 57 | 4.88/5.0 |
Analyzing the strategies of top hosts, such as their property selection, pricing, and guest communication, can offer valuable lessons for optimizing your own Airbnb operations in Vernon.
Dive Deeper: Advanced Vernon STR Market Data (2026)
Ready to unlock more insights? AirROI provides access to advanced metrics and comprehensive Airbnb data for Vernon. Explore detailed analytics beyond this report to refine your investment strategy, optimize pricing, and maximize your vacation rental profits.
Explore Advanced MetricsVernon Short-Term Rental Market Composition (2026): Property & Room Types
Room Type Distribution
Property Type Distribution
Market Composition Insights for Vernon
- The Vernon Airbnb market composition is heavily skewed towards Entire Home/Apt listings, which make up 100% of the 20 active rentals. This indicates strong guest preference for privacy and space.
- Looking at the property type distribution in Vernon, House properties are the most common (80%), reflecting the local real estate landscape.
- Houses represent a significant 80% portion, catering likely to families or larger groups.
Vernon Airbnb Room Capacity Analysis (2026): Bedroom Distribution
Distribution of Listings by Number of Bedrooms
Room Capacity Insights for Vernon
- The dominant room capacity in Vernon is 2 bedrooms listings, making up 50% of the market. This suggests a strong demand for properties suitable for couples or solo travelers.
- Together, 2 bedrooms and 3 bedrooms properties represent 75.0% of the active Airbnb listings in Vernon, indicating a high concentration in these sizes.
- A significant 30.0% of listings offer 3+ bedrooms, catering to larger groups and families seeking more space in Vernon.
Vernon Vacation Rental Guest Capacity Trends (2026)
Distribution of Listings by Guest Capacity
Guest Capacity Insights for Vernon
- The most common guest capacity trend in Vernon vacation rentals is listings accommodating 4 guests (25%). This suggests the primary traveler segment is likely small families or groups.
- Properties designed for 4 guests and 6 guests dominate the Vernon STR market, accounting for 45.0% of listings.
- 45.0% of properties accommodate 6+ guests, serving the market segment for larger families or group travel in Vernon.
- On average, properties in Vernon are equipped to host 5.2 guests.
Vernon Airbnb Booking Patterns (2026): Available vs. Booked Days
Available Days Distribution
Booked Days Distribution
Booking Pattern Insights for Vernon
- The most common availability pattern in Vernon falls within the 181-270 days range, representing 45% of listings. This suggests many properties have significant open periods on their calendars.
- Approximately 60.0% of listings show high availability (181+ days open annually), indicating potential for increased bookings or specific owner usage patterns.
- For booked days, the 91-180 days range is most frequent in Vernon (50%), reflecting common guest stay durations or potential owner blocking patterns.
- A notable 40.0% of properties secure long booking periods (181+ days booked per year), highlighting successful long-term rental strategies or significant owner usage.
Vernon Airbnb Minimum Stay Requirements Analysis
Distribution of Listings by Minimum Night Requirement
1 Night
12 listings
60% of total
2 Nights
5 listings
25% of total
3 Nights
1 listings
5% of total
30+ Nights
2 listings
10% of total
Key Insights
- The most prevalent minimum stay requirement in Vernon is 1 Night, adopted by 60% of listings. This highlights the market's preference for shorter, flexible bookings.
- A strong majority (85.0%) of the Vernon Airbnb data shows acceptance of very short stays (1-2 nights), indicating a dynamic, high-turnover market.
Recommendations
- Align with the market by considering a 1 Night minimum stay, as 60% of Vernon hosts use this setting.
- Explore offering discounts for stays of 30+ nights to attract the 10% of the market seeking extended stays.
- Adjust minimum nights based on seasonality – potentially shorter during low season and longer during peak demand periods in Vernon.
Vernon Airbnb Cancellation Policy Trends Analysis (2026)
Flexible
11 listings
55% of total
Moderate
6 listings
30% of total
Firm
3 listings
15% of total
Cancellation Policy Insights for Vernon
- The prevailing Airbnb cancellation policy trend in Vernon is Flexible, used by 55% of listings.
- The market strongly favors guest-friendly terms, with 85.0% of listings offering Flexible or Moderate policies. This suggests guests in Vernon may expect booking flexibility.
Recommendations for Hosts
- Consider adopting a Flexible policy to align with the 55% market standard in Vernon.
- Given the high prevalence of Flexible policies (55%), offering this can enhance booking appeal, especially during shoulder seasons.
- Regularly review your cancellation policy against competitors and market demand shifts in Vernon.
Vernon STR Booking Lead Time Analysis (2026)
Average Booking Lead Time by Month
Booking Lead Time Insights for Vernon
- The overall average booking lead time for vacation rentals in Vernon is 29 days.
- Guests book furthest in advance for stays during August (average 71 days), likely coinciding with peak travel demand or local events.
- The shortest booking windows occur for stays in February (average 4 days), indicating more last-minute travel plans during this time.
- Seasonally, Summer (34 days avg.) sees the longest lead times, while Spring (13 days avg.) has the shortest, reflecting typical travel planning cycles.
Recommendations for Hosts
- Use the overall average lead time (29 days) as a baseline for your pricing and availability strategy in Vernon.
- For August stays, consider implementing length-of-stay discounts or slightly higher rates for bookings made less than 71 days out to capitalize on advance planning.
- During February, focus on last-minute booking availability and promotions, as guests book with very short notice (4 days avg.).
- Target marketing efforts for the Summer season well in advance (at least 34 days) to capture early planners.
- Monitor your own booking lead times against these Vernon averages to identify opportunities for dynamic pricing adjustments.
Popular & Essential Airbnb Amenities in Vernon (2026)
Amenity Prevalence
Amenity Insights for Vernon
- Essential amenities in Vernon that guests expect include: Hot water, Kitchen, Wifi, Free parking on premises, Smoke alarm, TV, Air conditioning, Heating, Coffee maker, Coffee. Lacking these (any) could significantly impact bookings.
Recommendations for Hosts
- Ensure your listing includes all essential amenities for Vernon: Hot water, Kitchen, Wifi, Free parking on premises, Smoke alarm, TV, Air conditioning, Heating, Coffee maker, Coffee.
- Prioritize adding missing essentials: Coffee.
- Highlight unique or less common amenities you offer (e.g., hot tub, dedicated workspace, EV charger) in your listing description and photos.
- Regularly check competitor amenities in Vernon to stay competitive.
Vernon Airbnb Guest Demographics & Profile Analysis (2026)
Guest Profile Summary for Vernon
- The typical guest profile for Airbnb in Vernon consists of primarily domestic travelers (96%), often arriving from nearby Houston, typically belonging to the Post-2000s (Gen Z/Alpha) group (50%), primarily speaking English or Spanish.
- Domestic travelers account for 96.2% of guests.
- Key international markets include United States (96.2%) and Canada (1.9%).
- Top languages spoken are English (89.2%) followed by Spanish (8.1%).
- A significant demographic segment is the Post-2000s (Gen Z/Alpha) group, representing 50% of guests.
Recommendations for Hosts
- Target domestic marketing efforts towards travelers from Houston and Midlothian.
- Tailor amenities and listing descriptions to appeal to the dominant Post-2000s (Gen Z/Alpha) demographic (e.g., highlight fast WiFi, smart home features, local guides).
- Highlight unique local experiences or amenities relevant to the primary guest profile.
- Consider seasonal promotions aligned with peak travel times for key origin markets.
Nearby Short-Term Rental Market Comparison
How does the Vernon Airbnb market stack up against its neighbors? Compare key performance metrics like average monthly revenue, ADR, and occupancy rates in surrounding areas to understand the broader regional STR landscape.
| Market | Active Properties | Monthly Revenue | Daily Rate | Avg. Occupancy |
|---|---|---|---|---|
| Graham | 64 | $3,208 | $422.63 | 37% |
| Medicine Park | 113 | $2,193 | $187.56 | 39% |
| Seymour | 16 | $2,150 | $185.78 | 47% |
| Elgin | 15 | $1,656 | $155.73 | 43% |
| Weatherford | 26 | $1,562 | $141.62 | 41% |
| Clinton | 17 | $1,464 | $128.56 | 39% |
| Elk City | 13 | $1,386 | $129.39 | 43% |
| Altus | 19 | $1,357 | $161.54 | 50% |
| Lawton | 321 | $1,352 | $125.25 | 44% |
| Wichita Falls | 208 | $1,291 | $119.68 | 43% |