Uncertain Airbnb Market Analysis 2026: Short Term Rental Data & Vacation Rental Statistics in Texas, United States
Is Airbnb profitable in Uncertain in 2026? Explore comprehensive Airbnb analytics for Uncertain, Texas, United States to uncover income potential. This 2026 STR market report for Uncertain, based on AirROI data from February 2025 to January 2026, reveals key trends in the niche market of 25 active listings.
Whether you're considering an Airbnb investment in Uncertain, optimizing your existing vacation rental, or exploring rental arbitrage opportunities, understanding the Uncertain Airbnb data is crucial. Leveraging the low regulation environment is key to maximizing your short term rental income potential. Let's dive into the specifics.
Key Uncertain Airbnb Performance Metrics Overview
Monthly Airbnb Revenue Variations & Income Potential in Uncertain (2026)
Understanding the monthly revenue variations for Airbnb listings in Uncertain is key to maximizing your short term rental income potential. Seasonality significantly impacts earnings. Our analysis, based on data from the past 12 months, shows that the peak revenue month for STRs in Uncertain is typically November, while August often presents the lowest earnings, highlighting opportunities for strategic pricing adjustments during shoulder and low seasons. Explore the typical Airbnb income in Uncertain across different performance tiers:
- Best-in-class properties (Top 10%) achieve $6,116+ monthly, often utilizing dynamic pricing and superior guest experiences.
- Strong performing properties (Top 25%) earn $3,128 or more, indicating effective management and desirable locations/amenities.
- Typical properties (Median) generate around $1,553 per month, representing the average market performance.
- Entry-level properties (Bottom 25%) see earnings around $819, often with potential for optimization.
Average Monthly Airbnb Earnings Trend in Uncertain
Uncertain Airbnb Occupancy Rate Trends (2026)
Maximize your bookings by understanding the Uncertain STR occupancy trends. Seasonal demand shifts significantly influence how often properties are booked. Typically, Marchsees the highest demand (peak season occupancy), while August experiences the lowest (low season). Effective strategies, like adjusting minimum stays or offering promotions, can boost occupancy during slower periods. Here's how different property tiers perform in Uncertain:
- Best-in-class properties (Top 10%) achieve 65%+ occupancy, indicating high desirability and potentially optimized availability.
- Strong performing properties (Top 25%) maintain 42% or higher occupancy, suggesting good market fit and guest satisfaction.
- Typical properties (Median) have an occupancy rate around 25%.
- Entry-level properties (Bottom 25%) average 15% occupancy, potentially facing higher vacancy.
Average Monthly Occupancy Rate Trend in Uncertain
Average Daily Rate (ADR) Airbnb Trends in Uncertain (2026)
Effective short term rental pricing strategy in Uncertain involves understanding monthly ADR fluctuations. The Average Daily Rate (ADR) for Airbnb in Uncertain typically peaks in November and dips lowest during February. Leveraging Airbnb dynamic pricing tools or strategies based on this seasonality can significantly boost revenue. Here's a look at the typical nightly rates achieved:
- Best-in-class properties (Top 10%) command rates of $414+ per night, often due to premium features or locations.
- Strong performing properties (Top 25%) achieve nightly rates of $295 or more.
- Typical properties (Median) charge around $197 per night.
- Entry-level properties (Bottom 25%) earn around $142 per night.
Average Daily Rate (ADR) Trend by Month in Uncertain
Get Live Uncertain Market Intelligence 👇

Explore Real-time Analytics
Airbnb Seasonality Analysis & Trends in Uncertain (2026)
Peak Season (November, March, October)
- Revenue averages $3,367 per month
- Occupancy rates average 41.8%
- Daily rates average $239
Shoulder Season
- Revenue averages $2,398 per month
- Occupancy maintains around 30.6%
- Daily rates hold near $228
Low Season (January, August, September)
- Revenue drops to average $1,916 per month
- Occupancy decreases to average 25.3%
- Daily rates adjust to average $221
Seasonality Insights for Uncertain
- The Airbnb seasonality in Uncertain shows highly seasonal trends requiring careful strategy. While the sections above show seasonal averages, it's also insightful to look at the extremes:
- During the high season, the absolute peak month showcases Uncertain's highest earning potential, with monthly revenues capable of climbing to $3,778, occupancy reaching a high of 46.0%, and ADRs peaking at $250.
- Conversely, the slowest single month of the year, typically falling within the low season, marks the market's lowest point. In this month, revenue might dip to $1,828, occupancy could drop to 22.7%, and ADRs may adjust down to $212.
- Understanding both the seasonal averages and these monthly peaks and troughs in revenue, occupancy, and ADR is crucial for maximizing your Airbnb profit potential in Uncertain.
Seasonal Strategies for Maximizing Profit
- Peak Season: Maximize revenue through premium pricing and potentially longer minimum stays. Ensure high availability.
- Low Season: Offer competitive pricing, special promotions (e.g., extended stay discounts), and flexible cancellation policies. Target off-season travelers like remote workers or budget-conscious guests.
- Shoulder Seasons: Implement dynamic pricing that balances peak and low rates. Target weekend travelers or specific events. Offer slightly more flexible terms than peak season.
- Regularly analyze your own performance against these Uncertain seasonality benchmarks and adjust your pricing and availability strategy accordingly.
Best Areas for Airbnb Investment in Uncertain (2026)
Exploring the top neighborhoods for short-term rentals in Uncertain? This section highlights key areas, outlining why they are attractive for hosts and guests, along with notable local attractions. Consider these locations based on your target guest profile and investment strategy.
| Neighborhood / Area | Why Host Here? (Target Guests & Appeal) | Key Attractions & Landmarks |
|---|---|---|
| Lake Livingston | A popular destination for outdoor enthusiasts and families looking to enjoy water sports, fishing, and camping. The serene environment attracts both weekenders and longer-term visitors. | Lake Livingston State Park, Fishing and boating activities, Hiking trails, Local dining options, Scenic views and wildlife watching |
| Sam Houston National Forest | A vast forested area ideal for nature lovers and adventure seekers. The forest offers numerous recreational opportunities, making it an attractive spot for Airbnb rentals catering to campers and hikers. | Hiking trails, Camping facilities, Wildlife observation, Canoeing and kayaking, Nature photography spots |
| Crockett | Known for its historic charm and proximity to nature, Crockett appeals to tourists seeking a quaint, small-town experience while still enjoying outdoor activities. | Davy Crockett National Forest, Historic downtown, Local festivals, Antique shops, Bedias Creek |
| Huntsville | Home to Sam Houston State University and a rich historical background, Huntsville attracts a range of visitors from students to history buffs and nature lovers. | Sam Houston Memorial Museum, Huntsville State Park, Prison Museum, Lagoons and nature areas, Historic homes and architecture |
| Lufkin | A commercial hub with a variety of attractions, Lufkin is increasingly appealing for short-term rentals owing to its shopping, dining, and access to nature. | The Ellen Trout Zoo, Museum of East Texas, Local parks, Golf courses, Wildlife and nature activities |
| Nacogdoches | As the oldest town in Texas, Nacogdoches offers rich historical experiences and cultural attractions, catering to history enthusiasts and tourists alike. | Historic sites, Stephen F. Austin State University, Local wineries, Piney Woods", Lufkin Zoo |
| Tyler | Known for its beautiful roses and vibrant community life, Tyler attracts visitors year-round for its festivals, parks, and cultural experiences. | Tyler Rose Garden, Cascades Waterfalls, Historic sites, Tyler State Park, Local dining experiences |
| Coldspring | A scenic location near Lake Livingston, perfect for those looking for peace and quiet in nature, providing opportunities for fishing and boating. | Fishing and boating activities, Lake Livingston access, Local parks, Scenic landscapes, Wildlife watching |
Understanding Airbnb License Requirements & STR Laws in Uncertain (2026)
While Uncertain, Texas, United States currently shows low STR regulations, specific Airbnb license requirements might still exist or change. Always verify the latest short term rental regulations and Airbnb license requirements directly with local government authorities for Uncertain to ensure full compliance before hosting.
(Source: AirROI data, 2026, finding no licensed listings among those analyzed)
Top Performing Airbnb Properties in Uncertain (2026)
Benchmark your potential! Explore examples of top-performing Airbnb properties in Uncertainbased on Trailing Twelve Month (TTM) revenue. Analyze their characteristics, revenue, occupancy rate, and ADR to understand what drives success in this market.

First Cast Cabin | Lakefront |2 Bed 2 Bath |Kayaks
Entire Place • 2 bedrooms
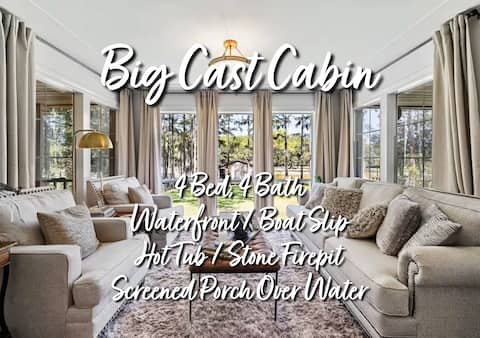
Waterfront 4BR/4BA w/ Boat Slip, Hot Tub & Firepit
Entire Place • 4 bedrooms
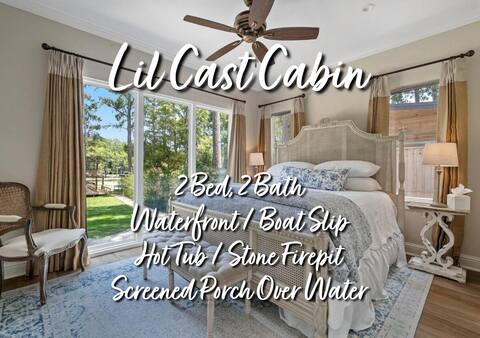
Waterfront w/ boat slip, 2 Kings, HotTub & FirePit
Entire Place • 2 bedrooms

Squatch Lookout Waterfront, newly remodeled
Entire Place • 4 bedrooms

Grand Harbor, Lakefront, with Kayaks & Canoes
Entire Place • 4 bedrooms
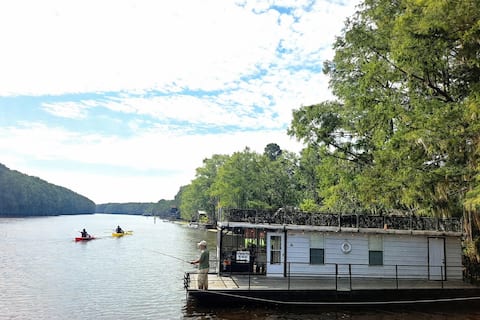
Waterfront-Kayaks-Houseboat-Caddo
Entire Place • 1 bedroom
Note: Performance varies based on location, size, amenities, seasonality, and management quality. Data reflects the past 12 months.
Top Performing Airbnb Hosts in Uncertain (2026)
Learn from the best! This table showcases top-performing Airbnb hosts in Uncertain based on the number of properties managed and estimated total revenue over the past year. Analyze their scale and performance metrics.
| Host Name | Properties | Grossing Revenue | Stay Reviews | Avg Rating |
|---|---|---|---|---|
| Jennifer | 9 | $225,556 | 161 | 4.80/5.0 |
| Anthony | 2 | $165,328 | 82 | 5.00/5.0 |
| Luke | 1 | $96,555 | 339 | 5.00/5.0 |
| Sarah | 1 | $42,641 | 21 | 5.00/5.0 |
| April | 1 | $29,745 | 70 | 4.77/5.0 |
| Caitlin | 3 | $28,755 | 24 | 4.82/5.0 |
| Kelly And Shelley | 2 | $25,364 | 213 | 4.74/5.0 |
| Blanca | 1 | $10,251 | 135 | 4.91/5.0 |
| Keith Talley | 2 | $8,666 | 6 | 4.40/5.0 |
| Chip | 1 | $8,160 | 5 | 4.80/5.0 |
Analyzing the strategies of top hosts, such as their property selection, pricing, and guest communication, can offer valuable lessons for optimizing your own Airbnb operations in Uncertain.
Dive Deeper: Advanced Uncertain STR Market Data (2026)
Ready to unlock more insights? AirROI provides access to advanced metrics and comprehensive Airbnb data for Uncertain. Explore detailed analytics beyond this report to refine your investment strategy, optimize pricing, and maximize your vacation rental profits.
Explore Advanced MetricsUncertain Short-Term Rental Market Composition (2026): Property & Room Types
Room Type Distribution
Property Type Distribution
Market Composition Insights for Uncertain
- The Uncertain Airbnb market composition is heavily skewed towards Entire Home/Apt listings, which make up 84% of the 25 active rentals. This indicates strong guest preference for privacy and space.
- Looking at the property type distribution in Uncertain, House properties are the most common (56%), reflecting the local real estate landscape.
- Houses represent a significant 56% portion, catering likely to families or larger groups.
- The presence of 8% Hotel/Boutique listings indicates integration with traditional hospitality.
- Smaller segments like others (combined 4.0%) offer potential for unique stay experiences.
Uncertain Airbnb Room Capacity Analysis (2026): Bedroom Distribution
Distribution of Listings by Number of Bedrooms
Room Capacity Insights for Uncertain
- The dominant room capacity in Uncertain is 1 bedroom listings, making up 36% of the market. This suggests a strong demand for properties suitable for couples or solo travelers.
- Together, 1 bedroom and 2 bedrooms properties represent 68.0% of the active Airbnb listings in Uncertain, indicating a high concentration in these sizes.
- A significant 28.0% of listings offer 3+ bedrooms, catering to larger groups and families seeking more space in Uncertain.
Uncertain Vacation Rental Guest Capacity Trends (2026)
Distribution of Listings by Guest Capacity
Guest Capacity Insights for Uncertain
- The most common guest capacity trend in Uncertain vacation rentals is listings accommodating 4 guests (32%). This suggests the primary traveler segment is likely small families or groups.
- Properties designed for 4 guests and 8+ guests dominate the Uncertain STR market, accounting for 52.0% of listings.
- 40.0% of properties accommodate 6+ guests, serving the market segment for larger families or group travel in Uncertain.
- On average, properties in Uncertain are equipped to host 5.0 guests.
Uncertain Airbnb Booking Patterns (2026): Available vs. Booked Days
Available Days Distribution
Booked Days Distribution
Booking Pattern Insights for Uncertain
- The most common availability pattern in Uncertain falls within the 271-366 days range, representing 56% of listings. This suggests many properties have significant open periods on their calendars.
- Approximately 84.0% of listings show high availability (181+ days open annually), indicating potential for increased bookings or specific owner usage patterns.
- For booked days, the 31-90 days range is most frequent in Uncertain (44%), reflecting common guest stay durations or potential owner blocking patterns.
- A notable 16.0% of properties secure long booking periods (181+ days booked per year), highlighting successful long-term rental strategies or significant owner usage.
Uncertain Airbnb Minimum Stay Requirements Analysis
Distribution of Listings by Minimum Night Requirement
1 Night
5 listings
20% of total
2 Nights
6 listings
24% of total
3 Nights
1 listings
4% of total
30+ Nights
13 listings
52% of total
Key Insights
- The most prevalent minimum stay requirement in Uncertain is 30+ Nights, adopted by 52% of listings. This highlights the market's preference for longer commitments.
- A significant segment (52%) caters to monthly stays (30+ nights) in Uncertain, pointing to opportunities in the extended-stay market.
Recommendations
- Align with the market by considering a 30+ Nights minimum stay, as 52% of Uncertain hosts use this setting.
- If feasible, allowing 1-night stays, especially midweek or during low season, could capture last-minute bookings, as only 20% currently do.
- Explore offering discounts for stays of 30+ nights to attract the 52% of the market seeking extended stays.
- Adjust minimum nights based on seasonality – potentially shorter during low season and longer during peak demand periods in Uncertain.
Uncertain Airbnb Cancellation Policy Trends Analysis (2026)
Limited
9 listings
36% of total
Flexible
3 listings
12% of total
Moderate
3 listings
12% of total
Firm
9 listings
36% of total
Strict
1 listings
4% of total
Cancellation Policy Insights for Uncertain
- The prevailing Airbnb cancellation policy trend in Uncertain is Limited, used by 36% of listings.
- There's a relatively balanced mix between guest-friendly (24.0%) and stricter (40.0%) policies, offering choices for different guest needs.
- Strict cancellation policies are quite rare (4%), potentially making listings with this policy less competitive unless justified by high demand or property type.
Recommendations for Hosts
- Consider adopting a Limited policy to align with the 36% market standard in Uncertain.
- Using a Strict policy might deter some guests, as only 4% of listings use it. Evaluate if potential revenue protection outweighs possible lower booking rates.
- Regularly review your cancellation policy against competitors and market demand shifts in Uncertain.
Uncertain STR Booking Lead Time Analysis (2026)
Average Booking Lead Time by Month
Booking Lead Time Insights for Uncertain
- The overall average booking lead time for vacation rentals in Uncertain is 44 days.
- Guests book furthest in advance for stays during November (average 85 days), likely coinciding with peak travel demand or local events.
- The shortest booking windows occur for stays in August (average 20 days), indicating more last-minute travel plans during this time.
- Seasonally, Fall (59 days avg.) sees the longest lead times, while Summer (33 days avg.) has the shortest, reflecting typical travel planning cycles.
Recommendations for Hosts
- Use the overall average lead time (44 days) as a baseline for your pricing and availability strategy in Uncertain.
- For November stays, consider implementing length-of-stay discounts or slightly higher rates for bookings made less than 85 days out to capitalize on advance planning.
- Target marketing efforts for the Fall season well in advance (at least 59 days) to capture early planners.
- Monitor your own booking lead times against these Uncertain averages to identify opportunities for dynamic pricing adjustments.
Popular & Essential Airbnb Amenities in Uncertain (2026)
Amenity Prevalence
Amenity Insights for Uncertain
- Essential amenities in Uncertain that guests expect include: Free parking on premises, Air conditioning, Smoke alarm, Hot water, BBQ grill, Wifi, Coffee maker, Outdoor furniture, Heating. Lacking these (any) could significantly impact bookings.
- Popular amenities like TV are common but not universal. Offering these can provide a competitive edge.
Recommendations for Hosts
- Ensure your listing includes all essential amenities for Uncertain: Free parking on premises, Air conditioning, Smoke alarm, Hot water, BBQ grill, Wifi, Coffee maker, Outdoor furniture, Heating.
- Prioritize adding missing essentials: Wifi, Coffee maker, Outdoor furniture, Heating.
- Consider adding popular differentiators like TV to increase appeal.
- Highlight unique or less common amenities you offer (e.g., hot tub, dedicated workspace, EV charger) in your listing description and photos.
- Regularly check competitor amenities in Uncertain to stay competitive.
Uncertain Airbnb Guest Demographics & Profile Analysis (2026)
Guest Profile Summary for Uncertain
- The typical guest profile for Airbnb in Uncertain consists of primarily domestic travelers (97%), often arriving from nearby Dallas, typically belonging to the Post-2000s (Gen Z/Alpha) group (50%), primarily speaking English or Spanish.
- Domestic travelers account for 96.5% of guests.
- Key international markets include United States (96.5%) and DC (0.6%).
- Top languages spoken are English (76.6%) followed by Spanish (6.5%).
- A significant demographic segment is the Post-2000s (Gen Z/Alpha) group, representing 50% of guests.
Recommendations for Hosts
- Target domestic marketing efforts towards travelers from Dallas and Denton.
- Tailor amenities and listing descriptions to appeal to the dominant Post-2000s (Gen Z/Alpha) demographic (e.g., highlight fast WiFi, smart home features, local guides).
- Highlight unique local experiences or amenities relevant to the primary guest profile.
- Consider seasonal promotions aligned with peak travel times for key origin markets.
Nearby Short-Term Rental Market Comparison
How does the Uncertain Airbnb market stack up against its neighbors? Compare key performance metrics like average monthly revenue, ADR, and occupancy rates in surrounding areas to understand the broader regional STR landscape.
| Market | Active Properties | Monthly Revenue | Daily Rate | Avg. Occupancy |
|---|---|---|---|---|
| Holly Lake Ranch | 11 | $3,836 | $358.93 | 36% |
| Gladewater | 15 | $2,975 | $313.40 | 34% |
| Milam | 12 | $2,955 | $346.16 | 41% |
| Point | 12 | $2,822 | $225.27 | 40% |
| Pittsburg | 33 | $2,784 | $244.07 | 35% |
| Eustace | 25 | $2,621 | $404.69 | 36% |
| Bullard | 33 | $2,588 | $219.90 | 43% |
| Brookeland | 56 | $2,363 | $289.67 | 33% |
| Crockett | 21 | $2,342 | $312.88 | 32% |
| Berryville | 15 | $2,340 | $302.54 | 40% |