Surfside Beach Airbnb Market Analysis 2026: Short Term Rental Data & Vacation Rental Statistics in Texas, United States
Is Airbnb profitable in Surfside Beach in 2026? Explore comprehensive Airbnb analytics for Surfside Beach, Texas, United States to uncover income potential. This 2026 STR market report for Surfside Beach, based on AirROI data from February 2025 to January 2026, reveals key trends in the market of 405 active listings.
Whether you're considering an Airbnb investment in Surfside Beach, optimizing your existing vacation rental, or exploring rental arbitrage opportunities, understanding the Surfside Beach Airbnb data is crucial. Leveraging the low regulation environment is key to maximizing your short term rental income potential. Let's dive into the specifics.
Key Surfside Beach Airbnb Performance Metrics Overview
Monthly Airbnb Revenue Variations & Income Potential in Surfside Beach (2026)
Understanding the monthly revenue variations for Airbnb listings in Surfside Beach is key to maximizing your short term rental income potential. Seasonality significantly impacts earnings. Our analysis, based on data from the past 12 months, shows that the peak revenue month for STRs in Surfside Beach is typically July, while January often presents the lowest earnings, highlighting opportunities for strategic pricing adjustments during shoulder and low seasons. Explore the typical Airbnb income in Surfside Beach across different performance tiers:
- Best-in-class properties (Top 10%) achieve $7,397+ monthly, often utilizing dynamic pricing and superior guest experiences.
- Strong performing properties (Top 25%) earn $4,641 or more, indicating effective management and desirable locations/amenities.
- Typical properties (Median) generate around $2,692 per month, representing the average market performance.
- Entry-level properties (Bottom 25%) see earnings around $1,467, often with potential for optimization.
Average Monthly Airbnb Earnings Trend in Surfside Beach
Surfside Beach Airbnb Occupancy Rate Trends (2026)
Maximize your bookings by understanding the Surfside Beach STR occupancy trends. Seasonal demand shifts significantly influence how often properties are booked. Typically, Julysees the highest demand (peak season occupancy), while January experiences the lowest (low season). Effective strategies, like adjusting minimum stays or offering promotions, can boost occupancy during slower periods. Here's how different property tiers perform in Surfside Beach:
- Best-in-class properties (Top 10%) achieve 66%+ occupancy, indicating high desirability and potentially optimized availability.
- Strong performing properties (Top 25%) maintain 50% or higher occupancy, suggesting good market fit and guest satisfaction.
- Typical properties (Median) have an occupancy rate around 31%.
- Entry-level properties (Bottom 25%) average 17% occupancy, potentially facing higher vacancy.
Average Monthly Occupancy Rate Trend in Surfside Beach
Average Daily Rate (ADR) Airbnb Trends in Surfside Beach (2026)
Effective short term rental pricing strategy in Surfside Beach involves understanding monthly ADR fluctuations. The Average Daily Rate (ADR) for Airbnb in Surfside Beach typically peaks in June and dips lowest during February. Leveraging Airbnb dynamic pricing tools or strategies based on this seasonality can significantly boost revenue. Here's a look at the typical nightly rates achieved:
- Best-in-class properties (Top 10%) command rates of $532+ per night, often due to premium features or locations.
- Strong performing properties (Top 25%) achieve nightly rates of $381 or more.
- Typical properties (Median) charge around $272 per night.
- Entry-level properties (Bottom 25%) earn around $213 per night.
Average Daily Rate (ADR) Trend by Month in Surfside Beach
Get Live Surfside Beach Market Intelligence 👇

Explore Real-time Analytics
Airbnb Seasonality Analysis & Trends in Surfside Beach (2026)
Peak Season (July, June, August)
- Revenue averages $5,902 per month
- Occupancy rates average 49.1%
- Daily rates average $352
Shoulder Season
- Revenue averages $3,060 per month
- Occupancy maintains around 32.5%
- Daily rates hold near $312
Low Season (January, February, December)
- Revenue drops to average $2,171 per month
- Occupancy decreases to average 26.0%
- Daily rates adjust to average $297
Seasonality Insights for Surfside Beach
- The Airbnb seasonality in Surfside Beach shows highly seasonal trends requiring careful strategy. While the sections above show seasonal averages, it's also insightful to look at the extremes:
- During the high season, the absolute peak month showcases Surfside Beach's highest earning potential, with monthly revenues capable of climbing to $7,117, occupancy reaching a high of 57.4%, and ADRs peaking at $362.
- Conversely, the slowest single month of the year, typically falling within the low season, marks the market's lowest point. In this month, revenue might dip to $1,718, occupancy could drop to 18.3%, and ADRs may adjust down to $264.
- Understanding both the seasonal averages and these monthly peaks and troughs in revenue, occupancy, and ADR is crucial for maximizing your Airbnb profit potential in Surfside Beach.
Seasonal Strategies for Maximizing Profit
- Peak Season: Maximize revenue through premium pricing and potentially longer minimum stays. Ensure high availability.
- Low Season: Offer competitive pricing, special promotions (e.g., extended stay discounts), and flexible cancellation policies. Target off-season travelers like remote workers or budget-conscious guests.
- Shoulder Seasons: Implement dynamic pricing that balances peak and low rates. Target weekend travelers or specific events. Offer slightly more flexible terms than peak season.
- Regularly analyze your own performance against these Surfside Beach seasonality benchmarks and adjust your pricing and availability strategy accordingly.
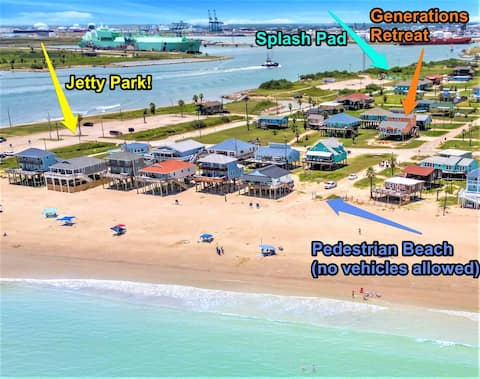
Best Areas for Airbnb Investment in Surfside Beach (2026)
Exploring the top neighborhoods for short-term rentals in Surfside Beach? This section highlights key areas, outlining why they are attractive for hosts and guests, along with notable local attractions. Consider these locations based on your target guest profile and investment strategy.
| Neighborhood / Area | Why Host Here? (Target Guests & Appeal) | Key Attractions & Landmarks |
|---|---|---|
| Surfside Beach | A charming coastal town known for its peaceful sandy beaches, making it ideal for vacation rentals. It attracts families and beach lovers seeking a quiet getaway. | Surfside Beach Park, Brazoria National Wildlife Refuge, Blue Water Highway, Surfside Jetty Park, Quintana Neotropical Bird Sanctuary |
| Galveston Island | A historic island city with beautiful beaches and a vibrant atmosphere. Popular among tourists for its attractions, making it perfect for Airbnb investments. | Galveston Beach, The Strand Historic District, Moody Gardens, Galveston Island Historic Pleasure Pier, Bishop's Palace |
| Port Aransas | A popular beach destination known for its fishing, water sports, and nature reserves. It's a great spot for vacation rentals catering to beach and nature enthusiasts. | Port Aransas Beach, Mustang Island State Park, Port Aransas Nature Preserve, Leonabelle Turnbull Birding Center, Roberts Point Park |
| Freeport | A coastal city with water access and vacation homes. It offers unique outdoor activities and is suitable for those who enjoy fishing and boating. | Brazosport Museum of Natural Science, Surfside Jetty Park, Freeport Harbor, Brazos River, Brazoria National Wildlife Refuge |
| Crystal Beach | Located on the Bolivar Peninsula, this beach area is popular for its family-friendly atmosphere and vacation rentals. It's a great spot for long-term investment. | Crystal Beach, Bolivar Lighthouse, Rollover Pass, Fort Travis Seashore Park, Gulf Coast beaches |
| South Padre Island | Famous for its beautiful beaches and vibrant nightlife, it's a hot spot for tourists and vacation rentals, particularly in the summer months. | South Padre Island Beach, Sea Turtle Inc., South Padre Island Birding and Nature Center, Entertainment District, Isla Blanca Park |
| Matagorda Beach | Known for its natural beauty and bird-watching opportunities, Matagorda's tranquil setting makes it a unique location for Airbnb rentals. | Matagorda Beach, Matagorda Bay Nature Park, Matagorda County Birding Nature Center, Colorado River, Matagorda Island State Park |
| Rockport | A coastal city famous for its artistic community and coastal views. Great for visitors looking for a mix of culture and beach experiences. | Rockport Beach, Fulton Mansion, Texas Maritime Museum, Aquarium at Rockport Harbor, Rockport Harbor |
Understanding Airbnb License Requirements & STR Laws in Surfside Beach (2026)
While Surfside Beach, Texas, United States currently shows low STR regulations, specific Airbnb license requirements might still exist or change. Always verify the latest short term rental regulations and Airbnb license requirements directly with local government authorities for Surfside Beach to ensure full compliance before hosting.
(Source: AirROI data, 2026, finding no licensed listings among those analyzed)
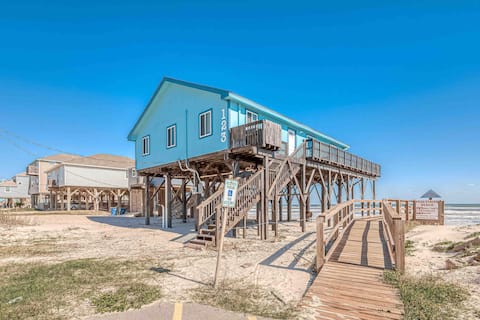
Top Performing Airbnb Properties in Surfside Beach (2026)
Benchmark your potential! Explore examples of top-performing Airbnb properties in Surfside Beachbased on Trailing Twelve Month (TTM) revenue. Analyze their characteristics, revenue, occupancy rate, and ADR to understand what drives success in this market.

Surfside Beachfront Paradise
Entire Place • 5 bedrooms
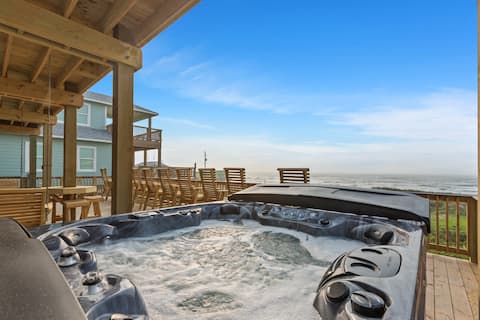
All Decked Out! Beachfront! Pets! Hot tub! Cart!
Entire Place • 4 bedrooms
Hot Tub + Pickleball 6BD/6BA + Elevator! Sleeps 26
Entire Place • 6 bedrooms

Large Home with Game Room, Deck & Bunk Room
Entire Place • 6 bedrooms
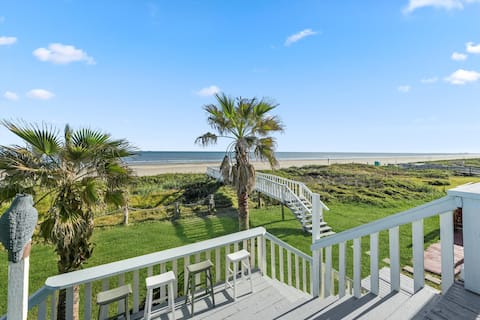
Spacious Beach Front Oasis
Entire Place • 6 bedrooms
Beachfront Dream. Pedestrian Beach! On Sand! Pets
Entire Place • 4 bedrooms
Note: Performance varies based on location, size, amenities, seasonality, and management quality. Data reflects the past 12 months.
Top Performing Airbnb Hosts in Surfside Beach (2026)
Learn from the best! This table showcases top-performing Airbnb hosts in Surfside Beach based on the number of properties managed and estimated total revenue over the past year. Analyze their scale and performance metrics.
| Host Name | Properties | Grossing Revenue | Stay Reviews | Avg Rating |
|---|---|---|---|---|
| The 979 Crew | 46 | $1,608,878 | 764 | 4.55/5.0 |
| Evolve | 45 | $1,429,209 | 1354 | 4.66/5.0 |
| Kaylene | 16 | $585,212 | 490 | 4.91/5.0 |
| Britt Family | 7 | $501,584 | 1143 | 4.93/5.0 |
| Kristin | 16 | $299,978 | 1144 | 4.73/5.0 |
| Gina | 3 | $291,910 | 389 | 4.89/5.0 |
| Airbnb. | 7 | $195,982 | 86 | 4.84/5.0 |
| StayBeachBox Vacations | 4 | $181,673 | 239 | 4.54/5.0 |
| Brs | 9 | $178,878 | 122 | 4.51/5.0 |
| Robert | 3 | $177,086 | 515 | 4.93/5.0 |
Analyzing the strategies of top hosts, such as their property selection, pricing, and guest communication, can offer valuable lessons for optimizing your own Airbnb operations in Surfside Beach.
Dive Deeper: Advanced Surfside Beach STR Market Data (2026)
Ready to unlock more insights? AirROI provides access to advanced metrics and comprehensive Airbnb data for Surfside Beach. Explore detailed analytics beyond this report to refine your investment strategy, optimize pricing, and maximize your vacation rental profits.
Explore Advanced MetricsSurfside Beach Short-Term Rental Market Composition (2026): Property & Room Types
Room Type Distribution
Property Type Distribution
Market Composition Insights for Surfside Beach
- The Surfside Beach Airbnb market composition is heavily skewed towards Entire Home/Apt listings, which make up 100% of the 405 active rentals. This indicates strong guest preference for privacy and space.
- Looking at the property type distribution in Surfside Beach, House properties are the most common (92.6%), reflecting the local real estate landscape.
- Houses represent a significant 92.6% portion, catering likely to families or larger groups.
- Smaller segments like outdoor/unique, hotel/boutique (combined 0.9%) offer potential for unique stay experiences.
Surfside Beach Airbnb Room Capacity Analysis (2026): Bedroom Distribution
Distribution of Listings by Number of Bedrooms
Room Capacity Insights for Surfside Beach
- The dominant room capacity in Surfside Beach is 3 bedrooms listings, making up 47.4% of the market. This suggests a strong demand for properties suitable for families or small groups.
- Together, 3 bedrooms and 2 bedrooms properties represent 69.4% of the active Airbnb listings in Surfside Beach, indicating a high concentration in these sizes.
- A significant 70.1% of listings offer 3+ bedrooms, catering to larger groups and families seeking more space in Surfside Beach.
Surfside Beach Vacation Rental Guest Capacity Trends (2026)
Distribution of Listings by Guest Capacity
Guest Capacity Insights for Surfside Beach
- The most common guest capacity trend in Surfside Beach vacation rentals is listings accommodating 8+ guests (68.9%). This suggests the primary traveler segment is likely larger groups.
- Properties designed for 8+ guests and 6 guests dominate the Surfside Beach STR market, accounting for 83.0% of listings.
- 88.2% of properties accommodate 6+ guests, serving the market segment for larger families or group travel in Surfside Beach.
- On average, properties in Surfside Beach are equipped to host 7.2 guests.
Surfside Beach Airbnb Booking Patterns (2026): Available vs. Booked Days
Available Days Distribution
Booked Days Distribution
Booking Pattern Insights for Surfside Beach
- The most common availability pattern in Surfside Beach falls within the 271-366 days range, representing 54.6% of listings. This suggests many properties have significant open periods on their calendars.
- Approximately 88.2% of listings show high availability (181+ days open annually), indicating potential for increased bookings or specific owner usage patterns.
- For booked days, the 31-90 days range is most frequent in Surfside Beach (42.2%), reflecting common guest stay durations or potential owner blocking patterns.
- A notable 12.4% of properties secure long booking periods (181+ days booked per year), highlighting successful long-term rental strategies or significant owner usage.
Surfside Beach Airbnb Minimum Stay Requirements Analysis
Distribution of Listings by Minimum Night Requirement
1 Night
58 listings
14.3% of total
2 Nights
179 listings
44.2% of total
3 Nights
28 listings
6.9% of total
30+ Nights
140 listings
34.6% of total
Key Insights
- The most prevalent minimum stay requirement in Surfside Beach is 2 Nights, adopted by 44.2% of listings. This highlights the market's preference for shorter, flexible bookings.
- A significant segment (34.6%) caters to monthly stays (30+ nights) in Surfside Beach, pointing to opportunities in the extended-stay market.
Recommendations
- Align with the market by considering a 2 Nights minimum stay, as 44.2% of Surfside Beach hosts use this setting.
- If feasible, allowing 1-night stays, especially midweek or during low season, could capture last-minute bookings, as only 14.3% currently do.
- A 2-night minimum appears standard (44.2%). Consider this for weekends or peak periods.
- Explore offering discounts for stays of 30+ nights to attract the 34.6% of the market seeking extended stays.
- Adjust minimum nights based on seasonality – potentially shorter during low season and longer during peak demand periods in Surfside Beach.
Surfside Beach Airbnb Cancellation Policy Trends Analysis (2026)
Super Strict 60 Days
18 listings
4.5% of total
Limited
2 listings
0.5% of total
Super Strict 30 Days
9 listings
2.2% of total
Flexible
33 listings
8.2% of total
Moderate
83 listings
20.5% of total
Firm
187 listings
46.3% of total
Strict
72 listings
17.8% of total
Cancellation Policy Insights for Surfside Beach
- The prevailing Airbnb cancellation policy trend in Surfside Beach is Firm, used by 46.3% of listings.
- A majority (64.1%) of hosts in Surfside Beach utilize Firm or Strict policies, indicating a market where hosts prioritize booking security.
Recommendations for Hosts
- Consider adopting a Firm policy to align with the 46.3% market standard in Surfside Beach.
- Regularly review your cancellation policy against competitors and market demand shifts in Surfside Beach.
Surfside Beach STR Booking Lead Time Analysis (2026)
Average Booking Lead Time by Month
Booking Lead Time Insights for Surfside Beach
- The overall average booking lead time for vacation rentals in Surfside Beach is 36 days.
- Guests book furthest in advance for stays during July (average 50 days), likely coinciding with peak travel demand or local events.
- The shortest booking windows occur for stays in January (average 19 days), indicating more last-minute travel plans during this time.
- Seasonally, Summer (43 days avg.) sees the longest lead times, while Winter (28 days avg.) has the shortest, reflecting typical travel planning cycles.
Recommendations for Hosts
- Use the overall average lead time (36 days) as a baseline for your pricing and availability strategy in Surfside Beach.
- For July stays, consider implementing length-of-stay discounts or slightly higher rates for bookings made less than 50 days out to capitalize on advance planning.
- Target marketing efforts for the Summer season well in advance (at least 43 days) to capture early planners.
- Monitor your own booking lead times against these Surfside Beach averages to identify opportunities for dynamic pricing adjustments.
Popular & Essential Airbnb Amenities in Surfside Beach (2026)
Amenity Prevalence
Amenity Insights for Surfside Beach
- Essential amenities in Surfside Beach that guests expect include: Air conditioning, TV, Wifi, Smoke alarm, Kitchen, Free parking on premises, Hot water, Coffee maker, Dishes and silverware. Lacking these (any) could significantly impact bookings.
- Popular amenities like Microwave are common but not universal. Offering these can provide a competitive edge.
Recommendations for Hosts
- Ensure your listing includes all essential amenities for Surfside Beach: Air conditioning, TV, Wifi, Smoke alarm, Kitchen, Free parking on premises, Hot water, Coffee maker, Dishes and silverware.
- Prioritize adding missing essentials: TV, Wifi, Smoke alarm, Kitchen, Free parking on premises, Hot water, Coffee maker, Dishes and silverware.
- Consider adding popular differentiators like Microwave to increase appeal.
- Highlight unique or less common amenities you offer (e.g., hot tub, dedicated workspace, EV charger) in your listing description and photos.
- Regularly check competitor amenities in Surfside Beach to stay competitive.
Surfside Beach Airbnb Guest Demographics & Profile Analysis (2026)
Guest Profile Summary for Surfside Beach
- The typical guest profile for Airbnb in Surfside Beach consists of primarily domestic travelers (99%), often arriving from nearby Houston, typically belonging to the Post-2000s (Gen Z/Alpha) group (50%), primarily speaking English or Spanish.
- Domestic travelers account for 98.8% of guests.
- Key international markets include United States (98.8%) and United Kingdom (0.2%).
- Top languages spoken are English (72.3%) followed by Spanish (18.8%).
- A significant demographic segment is the Post-2000s (Gen Z/Alpha) group, representing 50% of guests.
Recommendations for Hosts
- Target domestic marketing efforts towards travelers from Houston and Austin.
- Tailor amenities and listing descriptions to appeal to the dominant Post-2000s (Gen Z/Alpha) demographic (e.g., highlight fast WiFi, smart home features, local guides).
- Highlight unique local experiences or amenities relevant to the primary guest profile.
- Consider seasonal promotions aligned with peak travel times for key origin markets.
Nearby Short-Term Rental Market Comparison
How does the Surfside Beach Airbnb market stack up against its neighbors? Compare key performance metrics like average monthly revenue, ADR, and occupancy rates in surrounding areas to understand the broader regional STR landscape.
| Market | Active Properties | Monthly Revenue | Daily Rate | Avg. Occupancy |
|---|---|---|---|---|
| Midfield | 10 | $4,574 | $539.57 | 23% |
| Jamaica Beach | 199 | $3,774 | $394.20 | 37% |
| Crystal Beach | 143 | $3,768 | $408.48 | 35% |
| Bolivar Peninsula | 913 | $3,311 | $396.49 | 34% |
| Columbus | 17 | $3,218 | $413.88 | 29% |
| Deer Park | 14 | $3,208 | $228.63 | 51% |
| Schulenburg | 25 | $3,157 | $349.06 | 31% |
| Seabrook | 54 | $2,872 | $263.19 | 39% |
| Friendswood | 31 | $2,816 | $247.85 | 46% |
| Weimar | 15 | $2,768 | $289.32 | 36% |