South Padre Island Airbnb Market Analysis 2026: Short Term Rental Data & Vacation Rental Statistics in Texas, United States
Is Airbnb profitable in South Padre Island in 2026? Explore comprehensive Airbnb analytics for South Padre Island, Texas, United States to uncover income potential. This 2026 STR market report for South Padre Island, based on AirROI data from February 2025 to January 2026, reveals key trends in the bustling market of 2,347 active listings.
Whether you're considering an Airbnb investment in South Padre Island, optimizing your existing vacation rental, or exploring rental arbitrage opportunities, understanding the South Padre Island Airbnb data is crucial. Leveraging the low regulation environment is key to maximizing your short term rental income potential. Let's dive into the specifics.
Key South Padre Island Airbnb Performance Metrics Overview
Monthly Airbnb Revenue Variations & Income Potential in South Padre Island (2026)
Understanding the monthly revenue variations for Airbnb listings in South Padre Island is key to maximizing your short term rental income potential. Seasonality significantly impacts earnings. Our analysis, based on data from the past 12 months, shows that the peak revenue month for STRs in South Padre Island is typically July, while November often presents the lowest earnings, highlighting opportunities for strategic pricing adjustments during shoulder and low seasons. Explore the typical Airbnb income in South Padre Island across different performance tiers:
- Best-in-class properties (Top 10%) achieve $8,701+ monthly, often utilizing dynamic pricing and superior guest experiences.
- Strong performing properties (Top 25%) earn $5,232 or more, indicating effective management and desirable locations/amenities.
- Typical properties (Median) generate around $2,917 per month, representing the average market performance.
- Entry-level properties (Bottom 25%) see earnings around $1,487, often with potential for optimization.
Average Monthly Airbnb Earnings Trend in South Padre Island
South Padre Island Airbnb Occupancy Rate Trends (2026)
Maximize your bookings by understanding the South Padre Island STR occupancy trends. Seasonal demand shifts significantly influence how often properties are booked. Typically, Julysees the highest demand (peak season occupancy), while December experiences the lowest (low season). Effective strategies, like adjusting minimum stays or offering promotions, can boost occupancy during slower periods. Here's how different property tiers perform in South Padre Island:
- Best-in-class properties (Top 10%) achieve 74%+ occupancy, indicating high desirability and potentially optimized availability.
- Strong performing properties (Top 25%) maintain 55% or higher occupancy, suggesting good market fit and guest satisfaction.
- Typical properties (Median) have an occupancy rate around 34%.
- Entry-level properties (Bottom 25%) average 17% occupancy, potentially facing higher vacancy.
Average Monthly Occupancy Rate Trend in South Padre Island
Average Daily Rate (ADR) Airbnb Trends in South Padre Island (2026)
Effective short term rental pricing strategy in South Padre Island involves understanding monthly ADR fluctuations. The Average Daily Rate (ADR) for Airbnb in South Padre Island typically peaks in July and dips lowest during November. Leveraging Airbnb dynamic pricing tools or strategies based on this seasonality can significantly boost revenue. Here's a look at the typical nightly rates achieved:
- Best-in-class properties (Top 10%) command rates of $596+ per night, often due to premium features or locations.
- Strong performing properties (Top 25%) achieve nightly rates of $401 or more.
- Typical properties (Median) charge around $269 per night.
- Entry-level properties (Bottom 25%) earn around $194 per night.
Average Daily Rate (ADR) Trend by Month in South Padre Island
Get Live South Padre Island Market Intelligence 👇

Explore Real-time Analytics
Airbnb Seasonality Analysis & Trends in South Padre Island (2026)
Peak Season (July, June, February)
- Revenue averages $6,310 per month
- Occupancy rates average 52.4%
- Daily rates average $376
Shoulder Season
- Revenue averages $3,790 per month
- Occupancy maintains around 36.0%
- Daily rates hold near $335
Low Season (January, November, December)
- Revenue drops to average $2,762 per month
- Occupancy decreases to average 28.0%
- Daily rates adjust to average $313
Seasonality Insights for South Padre Island
- The Airbnb seasonality in South Padre Island shows highly seasonal trends requiring careful strategy. While the sections above show seasonal averages, it's also insightful to look at the extremes:
- During the high season, the absolute peak month showcases South Padre Island's highest earning potential, with monthly revenues capable of climbing to $7,786, occupancy reaching a high of 57.8%, and ADRs peaking at $410.
- Conversely, the slowest single month of the year, typically falling within the low season, marks the market's lowest point. In this month, revenue might dip to $2,547, occupancy could drop to 25.7%, and ADRs may adjust down to $299.
- Understanding both the seasonal averages and these monthly peaks and troughs in revenue, occupancy, and ADR is crucial for maximizing your Airbnb profit potential in South Padre Island.
Seasonal Strategies for Maximizing Profit
- Peak Season: Maximize revenue through premium pricing and potentially longer minimum stays. Ensure high availability.
- Low Season: Offer competitive pricing, special promotions (e.g., extended stay discounts), and flexible cancellation policies. Target off-season travelers like remote workers or budget-conscious guests.
- Shoulder Seasons: Implement dynamic pricing that balances peak and low rates. Target weekend travelers or specific events. Offer slightly more flexible terms than peak season.
- Regularly analyze your own performance against these South Padre Island seasonality benchmarks and adjust your pricing and availability strategy accordingly.
Best Areas for Airbnb Investment in South Padre Island (2026)
Exploring the top neighborhoods for short-term rentals in South Padre Island? This section highlights key areas, outlining why they are attractive for hosts and guests, along with notable local attractions. Consider these locations based on your target guest profile and investment strategy.
| Neighborhood / Area | Why Host Here? (Target Guests & Appeal) | Key Attractions & Landmarks |
|---|---|---|
| Gulf Boulevard | This area is right along the beach, offering easy access to the ocean and stunning sunsets. It attracts tourists looking for beachside accommodations and water activities. | South Padre Island Beach, Sea Turtle Inc., Schlitterbahn Waterpark, Isla Blanca Park, Fishing and watersports |
| Port Isabel | Just across the causeway, this charming town offers a glimpse into local culture and is a popular spot for those looking for a quieter experience away from the beach crowds. | Port Isabel Lighthouse, Laguna Madre Nature Trail, Dolphin Watching Tours, Historical Museum, Fishing Pier |
| South Padre Island Birding and Nature Center | This nature center attracts eco-tourists and bird watchers, offering a unique experience with the local wildlife. It's popular with families and nature lovers. | Birding Trails, Nature Center Exhibits, Scenic Views, Wildlife Observation, Educational Programs |
| South Padre Island Convention Centre | Ideal for business travelers attending events and conventions. It also serves as a venue for various entertainment events throughout the year. | Convention Centre Events, Cultural Festivals, Art Shows, Nearby Dining and Entertainment |
| Waterfront Drive | A beautiful scenic area with many waterfront properties, attracting vacationers looking for relaxing stays by the water with beautiful views. | Private Boat Rentals, Waterfront Dining, Parasailing, Kayaking Adventures |
| Boca Chica Beach | Stone's throw away from the hustle of South Padre, this beach gives a more secluded feel. It's great for those wanting a more tranquil beach outing. | Secluded Beaches, Picnic Areas, Conch Shell Collecting, Sunbathing, Fishing |
| East Sand Dunes | A less commercialized area known for its natural beauty and an excellent spot for those seeking outdoor activities like dune buggies and kite surfing. | Sand Dunes, Kite Surfing, ATV Rentals, Nature Trails |
| Laguna Vista | Offers a quieter experience with access to the water, appealing to families and those looking for a peaceful retreat close to the attractions of South Padre Island. | Laguna Vista Park, Kayaking, Bird Watching, Fishing Spots |
Understanding Airbnb License Requirements & STR Laws in South Padre Island (2026)
While South Padre Island, Texas, United States currently shows low STR regulations, specific Airbnb license requirements might still exist or change. Always verify the latest short term rental regulations and Airbnb license requirements directly with local government authorities for South Padre Island to ensure full compliance before hosting.
(Source: AirROI data, 2026, based on 0% licensed listings)
Top Performing Airbnb Properties in South Padre Island (2026)
Benchmark your potential! Explore examples of top-performing Airbnb properties in South Padre Islandbased on Trailing Twelve Month (TTM) revenue. Analyze their characteristics, revenue, occupancy rate, and ADR to understand what drives success in this market.
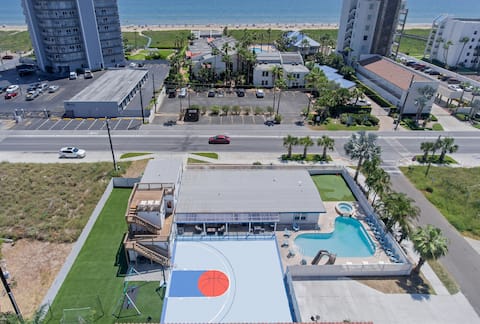
Private Home Large Heated Pool/Hot Tub/BBall court
Entire Place • 9 bedrooms
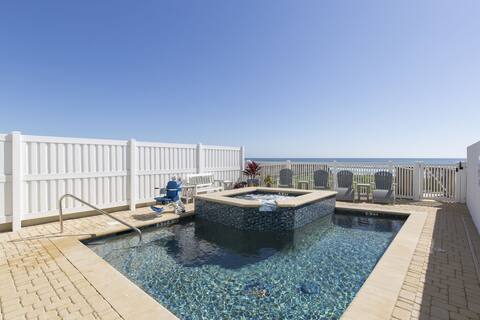
Elegant Oceanfront Home w/ Pool & Beach Boardwalk!
Entire Place • 5 bedrooms
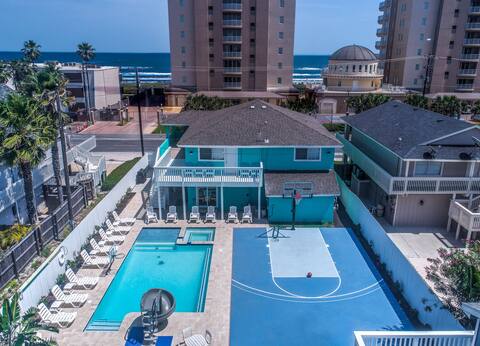
Large Heated Pool/Hot Tub/Bball Court/Beach View
Entire Place • 6 bedrooms
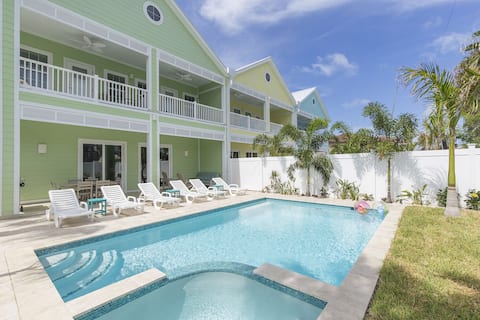
Elegant Retreat! Dog-Friendly & Steps to Beach!
Entire Place • 5 bedrooms

Oceanfront Elegance with Private Pool! Sleeps 10!
Entire Place • 4 bedrooms
Dog-Friendly Retreat w/ heated Pool, Near Beach!
Entire Place • 6 bedrooms
Note: Performance varies based on location, size, amenities, seasonality, and management quality. Data reflects the past 12 months.
Top Performing Airbnb Hosts in South Padre Island (2026)
Learn from the best! This table showcases top-performing Airbnb hosts in South Padre Island based on the number of properties managed and estimated total revenue over the past year. Analyze their scale and performance metrics.
| Host Name | Properties | Grossing Revenue | Stay Reviews | Avg Rating |
|---|---|---|---|---|
| Will & SPI Rentals Team | 179 | $15,000,732 | 1995 | 4.68/5.0 |
| Padre Island Rentals | 163 | $5,086,771 | 2998 | 4.58/5.0 |
| Jerry | 49 | $3,424,917 | 5222 | 4.90/5.0 |
| Blue Ocean Vacation Rentals | 51 | $2,154,386 | 1645 | 4.85/5.0 |
| Chad | 47 | $2,008,303 | 2445 | 4.71/5.0 |
| Horacio | 26 | $1,495,806 | 1165 | 4.86/5.0 |
| South Padre | 47 | $1,350,662 | 602 | 4.71/5.0 |
| Roberto | 35 | $1,148,863 | 2009 | 4.84/5.0 |
| Evolve | 33 | $1,129,900 | 1189 | 4.75/5.0 |
| Bryan | 80 | $1,099,501 | 1057 | 4.46/5.0 |
Analyzing the strategies of top hosts, such as their property selection, pricing, and guest communication, can offer valuable lessons for optimizing your own Airbnb operations in South Padre Island.
Dive Deeper: Advanced South Padre Island STR Market Data (2026)
Ready to unlock more insights? AirROI provides access to advanced metrics and comprehensive Airbnb data for South Padre Island. Explore detailed analytics beyond this report to refine your investment strategy, optimize pricing, and maximize your vacation rental profits.
Explore Advanced MetricsSouth Padre Island Short-Term Rental Market Composition (2026): Property & Room Types
Room Type Distribution
Property Type Distribution
Market Composition Insights for South Padre Island
- The South Padre Island Airbnb market composition is heavily skewed towards Entire Home/Apt listings, which make up 97.1% of the 2,347 active rentals. This indicates strong guest preference for privacy and space.
- Looking at the property type distribution in South Padre Island, Apartment/Condo properties are the most common (77.2%), reflecting the local real estate landscape.
- Houses represent a significant 20.1% portion, catering likely to families or larger groups.
- Smaller segments like hotel/boutique, others, unique stays (combined 2.7%) offer potential for unique stay experiences.
South Padre Island Airbnb Room Capacity Analysis (2026): Bedroom Distribution
Distribution of Listings by Number of Bedrooms
Room Capacity Insights for South Padre Island
- The dominant room capacity in South Padre Island is 2 bedrooms listings, making up 47% of the market. This suggests a strong demand for properties suitable for couples or solo travelers.
- Together, 2 bedrooms and 3 bedrooms properties represent 70.7% of the active Airbnb listings in South Padre Island, indicating a high concentration in these sizes.
- A significant 34.6% of listings offer 3+ bedrooms, catering to larger groups and families seeking more space in South Padre Island.
South Padre Island Vacation Rental Guest Capacity Trends (2026)
Distribution of Listings by Guest Capacity
Guest Capacity Insights for South Padre Island
- The most common guest capacity trend in South Padre Island vacation rentals is listings accommodating 8+ guests (40.7%). This suggests the primary traveler segment is likely larger groups.
- Properties designed for 8+ guests and 6 guests dominate the South Padre Island STR market, accounting for 77.9% of listings.
- 80.5% of properties accommodate 6+ guests, serving the market segment for larger families or group travel in South Padre Island.
- On average, properties in South Padre Island are equipped to host 6.4 guests.
South Padre Island Airbnb Booking Patterns (2026): Available vs. Booked Days
Available Days Distribution
Booked Days Distribution
Booking Pattern Insights for South Padre Island
- The most common availability pattern in South Padre Island falls within the 271-366 days range, representing 53.9% of listings. This suggests many properties have significant open periods on their calendars.
- Approximately 87.6% of listings show high availability (181+ days open annually), indicating potential for increased bookings or specific owner usage patterns.
- For booked days, the 31-90 days range is most frequent in South Padre Island (35.2%), reflecting common guest stay durations or potential owner blocking patterns.
- A notable 13.5% of properties secure long booking periods (181+ days booked per year), highlighting successful long-term rental strategies or significant owner usage.
South Padre Island Airbnb Minimum Stay Requirements Analysis
Distribution of Listings by Minimum Night Requirement
1 Night
260 listings
11.1% of total
2 Nights
681 listings
29% of total
3 Nights
277 listings
11.8% of total
4-6 Nights
111 listings
4.7% of total
7-29 Nights
53 listings
2.3% of total
30+ Nights
965 listings
41.1% of total
Key Insights
- The most prevalent minimum stay requirement in South Padre Island is 30+ Nights, adopted by 41.1% of listings. This highlights the market's preference for longer commitments.
- A significant segment (41.1%) caters to monthly stays (30+ nights) in South Padre Island, pointing to opportunities in the extended-stay market.
Recommendations
- Align with the market by considering a 30+ Nights minimum stay, as 41.1% of South Padre Island hosts use this setting.
- If feasible, allowing 1-night stays, especially midweek or during low season, could capture last-minute bookings, as only 11.1% currently do.
- Explore offering discounts for stays of 30+ nights to attract the 41.1% of the market seeking extended stays.
- Adjust minimum nights based on seasonality – potentially shorter during low season and longer during peak demand periods in South Padre Island.
South Padre Island Airbnb Cancellation Policy Trends Analysis (2026)
Refundable
1 listings
0% of total
Limited
4 listings
0.2% of total
Super Strict 30 Days
514 listings
21.9% of total
Super Strict 60 Days
42 listings
1.8% of total
Flexible
264 listings
11.3% of total
Moderate
386 listings
16.5% of total
Firm
855 listings
36.5% of total
Strict
278 listings
11.9% of total
Cancellation Policy Insights for South Padre Island
- The prevailing Airbnb cancellation policy trend in South Padre Island is Firm, used by 36.5% of listings.
- There's a relatively balanced mix between guest-friendly (27.8%) and stricter (48.4%) policies, offering choices for different guest needs.
Recommendations for Hosts
- Consider adopting a Firm policy to align with the 36.5% market standard in South Padre Island.
- Using a Strict policy might deter some guests, as only 11.9% of listings use it. Evaluate if potential revenue protection outweighs possible lower booking rates.
- Regularly review your cancellation policy against competitors and market demand shifts in South Padre Island.
South Padre Island STR Booking Lead Time Analysis (2026)
Average Booking Lead Time by Month
Booking Lead Time Insights for South Padre Island
- The overall average booking lead time for vacation rentals in South Padre Island is 51 days.
- Guests book furthest in advance for stays during February (average 108 days), likely coinciding with peak travel demand or local events.
- The shortest booking windows occur for stays in August (average 39 days), indicating more last-minute travel plans during this time.
- Seasonally, Winter (85 days avg.) sees the longest lead times, while Summer (44 days avg.) has the shortest, reflecting typical travel planning cycles.
Recommendations for Hosts
- Use the overall average lead time (51 days) as a baseline for your pricing and availability strategy in South Padre Island.
- For February stays, consider implementing length-of-stay discounts or slightly higher rates for bookings made less than 108 days out to capitalize on advance planning.
- Target marketing efforts for the Winter season well in advance (at least 85 days) to capture early planners.
- Monitor your own booking lead times against these South Padre Island averages to identify opportunities for dynamic pricing adjustments.
Popular & Essential Airbnb Amenities in South Padre Island (2026)
Amenity Prevalence
Amenity Insights for South Padre Island
- Essential amenities in South Padre Island that guests expect include: Air conditioning, Wifi, TV, Free parking on premises, Kitchen. Lacking these (any) could significantly impact bookings.
- Popular amenities like Smoke alarm, Refrigerator, Coffee maker are common but not universal. Offering these can provide a competitive edge.
- A pool is a highly desired but not standard amenity, making it a key feature for attracting guests seeking leisure in South Padre Island.
Recommendations for Hosts
- Ensure your listing includes all essential amenities for South Padre Island: Air conditioning, Wifi, TV, Free parking on premises, Kitchen.
- Prioritize adding missing essentials: Air conditioning, Wifi, TV, Free parking on premises, Kitchen.
- Consider adding popular differentiators like Smoke alarm or Refrigerator to increase appeal.
- Highlight unique or less common amenities you offer (e.g., hot tub, dedicated workspace, EV charger) in your listing description and photos.
- Regularly check competitor amenities in South Padre Island to stay competitive.
South Padre Island Airbnb Guest Demographics & Profile Analysis (2026)
Guest Profile Summary for South Padre Island
- The typical guest profile for Airbnb in South Padre Island consists of primarily domestic travelers (90%), often arriving from nearby San Antonio, typically belonging to the Post-2000s (Gen Z/Alpha) group (50%), primarily speaking English or Spanish.
- Domestic travelers account for 89.6% of guests.
- Key international markets include United States (89.6%) and Mexico (8.8%).
- Top languages spoken are English (60.6%) followed by Spanish (33.7%).
- A significant demographic segment is the Post-2000s (Gen Z/Alpha) group, representing 50% of guests.
Recommendations for Hosts
- Target domestic marketing efforts towards travelers from San Antonio and Austin.
- Tailor amenities and listing descriptions to appeal to the dominant Post-2000s (Gen Z/Alpha) demographic (e.g., highlight fast WiFi, smart home features, local guides).
- Highlight unique local experiences or amenities relevant to the primary guest profile.
- Consider seasonal promotions aligned with peak travel times for key origin markets.
Nearby Short-Term Rental Market Comparison
How does the South Padre Island Airbnb market stack up against its neighbors? Compare key performance metrics like average monthly revenue, ADR, and occupancy rates in surrounding areas to understand the broader regional STR landscape.
| Market | Active Properties | Monthly Revenue | Daily Rate | Avg. Occupancy |
|---|---|---|---|---|
| City-by-the Sea | 24 | $4,479 | $520.08 | 35% |
| Port Aransas | 2,361 | $3,422 | $437.85 | 34% |
| Port Mansfield | 29 | $2,788 | $374.59 | 32% |
| Alton | 13 | $2,484 | $392.58 | 23% |
| Rio Hondo | 46 | $2,381 | $309.67 | 31% |
| Port Isabel | 249 | $2,138 | $253.87 | 38% |
| Portland | 10 | $2,123 | $239.57 | 50% |
| Corpus Christi | 1,950 | $2,047 | $224.99 | 39% |
| Kingsville | 16 | $2,008 | $152.10 | 46% |
| La Feria | 12 | $1,810 | $138.16 | 45% |