Schertz Airbnb Market Analysis 2026: Short Term Rental Data & Vacation Rental Statistics in Texas, United States
Is Airbnb profitable in Schertz in 2026? Explore comprehensive Airbnb analytics for Schertz, Texas, United States to uncover income potential. This 2026 STR market report for Schertz, based on AirROI data from February 2025 to January 2026, reveals key trends in the niche market of 60 active listings.
Whether you're considering an Airbnb investment in Schertz, optimizing your existing vacation rental, or exploring rental arbitrage opportunities, understanding the Schertz Airbnb data is crucial. Leveraging the low regulation environment is key to maximizing your short term rental income potential. Let's dive into the specifics.
Key Schertz Airbnb Performance Metrics Overview
Monthly Airbnb Revenue Variations & Income Potential in Schertz (2026)
Understanding the monthly revenue variations for Airbnb listings in Schertz is key to maximizing your short term rental income potential. Seasonality significantly impacts earnings. Our analysis, based on data from the past 12 months, shows that the peak revenue month for STRs in Schertz is typically July, while January often presents the lowest earnings, highlighting opportunities for strategic pricing adjustments during shoulder and low seasons. Explore the typical Airbnb income in Schertz across different performance tiers:
- Best-in-class properties (Top 10%) achieve $6,044+ monthly, often utilizing dynamic pricing and superior guest experiences.
- Strong performing properties (Top 25%) earn $3,856 or more, indicating effective management and desirable locations/amenities.
- Typical properties (Median) generate around $2,339 per month, representing the average market performance.
- Entry-level properties (Bottom 25%) see earnings around $988, often with potential for optimization.
Average Monthly Airbnb Earnings Trend in Schertz
Schertz Airbnb Occupancy Rate Trends (2026)
Maximize your bookings by understanding the Schertz STR occupancy trends. Seasonal demand shifts significantly influence how often properties are booked. Typically, Junesees the highest demand (peak season occupancy), while January experiences the lowest (low season). Effective strategies, like adjusting minimum stays or offering promotions, can boost occupancy during slower periods. Here's how different property tiers perform in Schertz:
- Best-in-class properties (Top 10%) achieve 84%+ occupancy, indicating high desirability and potentially optimized availability.
- Strong performing properties (Top 25%) maintain 71% or higher occupancy, suggesting good market fit and guest satisfaction.
- Typical properties (Median) have an occupancy rate around 46%.
- Entry-level properties (Bottom 25%) average 27% occupancy, potentially facing higher vacancy.
Average Monthly Occupancy Rate Trend in Schertz
Average Daily Rate (ADR) Airbnb Trends in Schertz (2026)
Effective short term rental pricing strategy in Schertz involves understanding monthly ADR fluctuations. The Average Daily Rate (ADR) for Airbnb in Schertz typically peaks in July and dips lowest during February. Leveraging Airbnb dynamic pricing tools or strategies based on this seasonality can significantly boost revenue. Here's a look at the typical nightly rates achieved:
- Best-in-class properties (Top 10%) command rates of $351+ per night, often due to premium features or locations.
- Strong performing properties (Top 25%) achieve nightly rates of $220 or more.
- Typical properties (Median) charge around $148 per night.
- Entry-level properties (Bottom 25%) earn around $82 per night.
Average Daily Rate (ADR) Trend by Month in Schertz
Get Live Schertz Market Intelligence 👇

Explore Real-time Analytics
Airbnb Seasonality Analysis & Trends in Schertz (2026)
Peak Season (July, June, March)
- Revenue averages $3,777 per month
- Occupancy rates average 56.1%
- Daily rates average $199
Shoulder Season
- Revenue averages $3,063 per month
- Occupancy maintains around 49.0%
- Daily rates hold near $191
Low Season (January, February, November)
- Revenue drops to average $2,288 per month
- Occupancy decreases to average 40.5%
- Daily rates adjust to average $182
Seasonality Insights for Schertz
- The Airbnb seasonality in Schertz shows highly seasonal trends requiring careful strategy. While the sections above show seasonal averages, it's also insightful to look at the extremes:
- During the high season, the absolute peak month showcases Schertz's highest earning potential, with monthly revenues capable of climbing to $4,130, occupancy reaching a high of 56.5%, and ADRs peaking at $211.
- Conversely, the slowest single month of the year, typically falling within the low season, marks the market's lowest point. In this month, revenue might dip to $1,794, occupancy could drop to 31.8%, and ADRs may adjust down to $173.
- Understanding both the seasonal averages and these monthly peaks and troughs in revenue, occupancy, and ADR is crucial for maximizing your Airbnb profit potential in Schertz.
Seasonal Strategies for Maximizing Profit
- Peak Season: Maximize revenue through premium pricing and potentially longer minimum stays. Ensure high availability.
- Low Season: Offer competitive pricing, special promotions (e.g., extended stay discounts), and flexible cancellation policies. Target off-season travelers like remote workers or budget-conscious guests.
- Shoulder Seasons: Implement dynamic pricing that balances peak and low rates. Target weekend travelers or specific events. Offer slightly more flexible terms than peak season.
- Regularly analyze your own performance against these Schertz seasonality benchmarks and adjust your pricing and availability strategy accordingly.
Best Areas for Airbnb Investment in Schertz (2026)
Exploring the top neighborhoods for short-term rentals in Schertz? This section highlights key areas, outlining why they are attractive for hosts and guests, along with notable local attractions. Consider these locations based on your target guest profile and investment strategy.
| Neighborhood / Area | Why Host Here? (Target Guests & Appeal) | Key Attractions & Landmarks |
|---|---|---|
| The Forum | A bustling shopping and dining destination in Schertz, ideal for attracting visitors looking for conveniences and entertainment. | The Forum at Olympia Parkway, Civic Center, Schertz Recreation Center, City Park, Sam Houston High School |
| Schertz Historic District | A charming area with historical significance, offering a unique local experience for visitors interested in the history and culture of Schertz. | Old Town District, Schertz Museum, Schertz Civic Center, Schertz Community Theatre, Local shops and eateries |
| Cibolo Green | A family-friendly community with parks and amenities, popular among families seeking spacious accommodations for longer stays. | Cibolo Green Park, Walking trails, Local schools, Neighborhood events, Family-friendly restaurants |
| Woodlake | A quiet suburban area with easy access to major roads, appealing to visitors seeking a peaceful retreat while still being close to urban conveniences. | Woodlake Park, Schertz Public Library, Local shopping and dining, Swimming pools, Community events |
| Rettig | A burgeoning neighborhood with new developments, attracting visitors looking for modern amenities and new experiences in Schertz. | New shopping complexes, Community parks, Nearby schools, Local cafes, Sports facilities |
| Olympia Hills | Home to a beautiful golf course and natural settings, Olympia Hills appeals to those seeking a recreational getaway. | Olympia Hills Golf Course, Natural trails, Community events, Outdoor sports, Family-friendly parks |
| Fairlawn | A suburban neighborhood that offers a mix of local charm and proximity to urban amenities, suitable for diverse types of travelers. | Local parks, Community centers, Schertz Farmers Market, Nearby shopping, Local cuisine |
| Tanglewood | A peaceful community with residential charm, great for visitors looking for a relaxing environment with nearby conveniences. | Tanglewood Park, Sports facilities, Family-friendly events, Local dining options, Shopping nearby |
Understanding Airbnb License Requirements & STR Laws in Schertz (2026)
While Schertz, Texas, United States currently shows low STR regulations, specific Airbnb license requirements might still exist or change. Always verify the latest short term rental regulations and Airbnb license requirements directly with local government authorities for Schertz to ensure full compliance before hosting.
(Source: AirROI data, 2026, finding no licensed listings among those analyzed)
Top Performing Airbnb Properties in Schertz (2026)
Benchmark your potential! Explore examples of top-performing Airbnb properties in Schertzbased on Trailing Twelve Month (TTM) revenue. Analyze their characteristics, revenue, occupancy rate, and ADR to understand what drives success in this market.

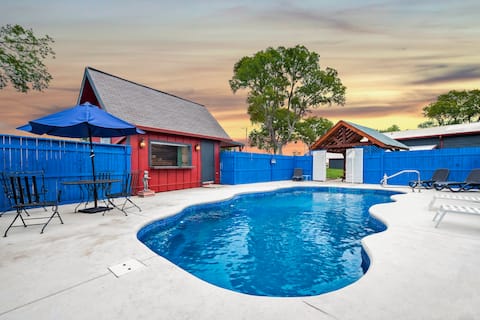
Serene Views | Luxe Stay•Private Pool•Sleeps 10
Entire Place • 5 bedrooms
Whole Home entertainment central!Schertz
Entire Place • 5 bedrooms
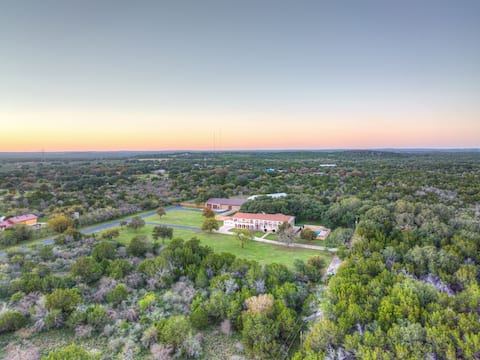
Hotel California at La Dolce Vita Estates
Entire Place • 5 bedrooms
Creekside Haven for Families and Gatherings!
Entire Place • 4 bedrooms
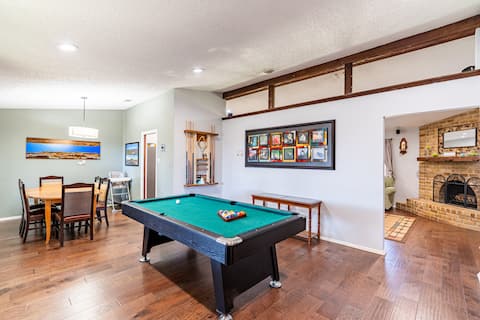
ArtLens Casa-Billiards-Campfire-TVs-bbq-Swings-WD
Entire Place • 4 bedrooms
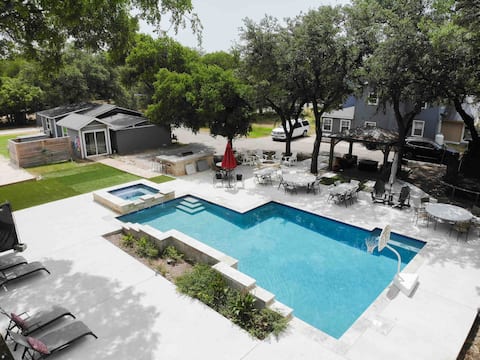
Home With Pool & Hot Tub
Entire Place • 4 bedrooms
Note: Performance varies based on location, size, amenities, seasonality, and management quality. Data reflects the past 12 months.
Top Performing Airbnb Hosts in Schertz (2026)
Learn from the best! This table showcases top-performing Airbnb hosts in Schertz based on the number of properties managed and estimated total revenue over the past year. Analyze their scale and performance metrics.
| Host Name | Properties | Grossing Revenue | Stay Reviews | Avg Rating |
|---|---|---|---|---|
| Louis Thompson | 1 | $129,677 | 196 | 4.91/5.0 |
| Teresa | 1 | $126,818 | 19 | 4.95/5.0 |
| Marie | 1 | $108,062 | 17 | 4.88/5.0 |
| Charles | 1 | $101,606 | 98 | 4.91/5.0 |
| Sophie | 2 | $64,226 | 153 | 4.96/5.0 |
| Sarah | 2 | $63,182 | 80 | 4.88/5.0 |
| Pete | 2 | $61,203 | 172 | 4.89/5.0 |
| Shawn | 1 | $58,064 | 108 | 4.99/5.0 |
| Chris | 1 | $57,421 | 117 | 4.67/5.0 |
| Erica | 1 | $57,133 | 84 | 4.87/5.0 |
Analyzing the strategies of top hosts, such as their property selection, pricing, and guest communication, can offer valuable lessons for optimizing your own Airbnb operations in Schertz.
Dive Deeper: Advanced Schertz STR Market Data (2026)
Ready to unlock more insights? AirROI provides access to advanced metrics and comprehensive Airbnb data for Schertz. Explore detailed analytics beyond this report to refine your investment strategy, optimize pricing, and maximize your vacation rental profits.
Explore Advanced MetricsSchertz Short-Term Rental Market Composition (2026): Property & Room Types
Room Type Distribution
Property Type Distribution
Market Composition Insights for Schertz
- The Schertz Airbnb market composition is heavily skewed towards Entire Home/Apt listings, which make up 75% of the 60 active rentals. This indicates strong guest preference for privacy and space.
- Looking at the property type distribution in Schertz, House properties are the most common (90%), reflecting the local real estate landscape.
- Houses represent a significant 90% portion, catering likely to families or larger groups.
- Smaller segments like hotel/boutique (combined 3.3%) offer potential for unique stay experiences.
Schertz Airbnb Room Capacity Analysis (2026): Bedroom Distribution
Distribution of Listings by Number of Bedrooms
Room Capacity Insights for Schertz
- The dominant room capacity in Schertz is 3 bedrooms listings, making up 31.7% of the market. This suggests a strong demand for properties suitable for families or small groups.
- Together, 3 bedrooms and 4 bedrooms properties represent 50.0% of the active Airbnb listings in Schertz, indicating a high concentration in these sizes.
- A significant 61.7% of listings offer 3+ bedrooms, catering to larger groups and families seeking more space in Schertz.
Schertz Vacation Rental Guest Capacity Trends (2026)
Distribution of Listings by Guest Capacity
Guest Capacity Insights for Schertz
- The most common guest capacity trend in Schertz vacation rentals is listings accommodating 8+ guests (41.7%). This suggests the primary traveler segment is likely larger groups.
- Properties designed for 8+ guests and 6 guests dominate the Schertz STR market, accounting for 56.7% of listings.
- 58.4% of properties accommodate 6+ guests, serving the market segment for larger families or group travel in Schertz.
- On average, properties in Schertz are equipped to host 5.1 guests.
Schertz Airbnb Booking Patterns (2026): Available vs. Booked Days
Available Days Distribution
Booked Days Distribution
Booking Pattern Insights for Schertz
- The most common availability pattern in Schertz falls within the 181-270 days range, representing 38.3% of listings. This suggests many properties have significant open periods on their calendars.
- Approximately 68.3% of listings show high availability (181+ days open annually), indicating potential for increased bookings or specific owner usage patterns.
- For booked days, the 91-180 days range is most frequent in Schertz (40%), reflecting common guest stay durations or potential owner blocking patterns.
- A notable 31.7% of properties secure long booking periods (181+ days booked per year), highlighting successful long-term rental strategies or significant owner usage.
Schertz Airbnb Minimum Stay Requirements Analysis
Distribution of Listings by Minimum Night Requirement
1 Night
18 listings
30% of total
2 Nights
13 listings
21.7% of total
3 Nights
4 listings
6.7% of total
4-6 Nights
6 listings
10% of total
7-29 Nights
2 listings
3.3% of total
30+ Nights
17 listings
28.3% of total
Key Insights
- The most prevalent minimum stay requirement in Schertz is 1 Night, adopted by 30% of listings. This highlights the market's preference for shorter, flexible bookings.
- A significant segment (28.3%) caters to monthly stays (30+ nights) in Schertz, pointing to opportunities in the extended-stay market.
Recommendations
- Align with the market by considering a 1 Night minimum stay, as 30% of Schertz hosts use this setting.
- Explore offering discounts for stays of 30+ nights to attract the 28.3% of the market seeking extended stays.
- Adjust minimum nights based on seasonality – potentially shorter during low season and longer during peak demand periods in Schertz.
Schertz Airbnb Cancellation Policy Trends Analysis (2026)
Flexible
19 listings
31.7% of total
Moderate
19 listings
31.7% of total
Firm
18 listings
30% of total
Strict
4 listings
6.7% of total
Cancellation Policy Insights for Schertz
- The prevailing Airbnb cancellation policy trend in Schertz is Flexible, used by 31.7% of listings.
- There's a relatively balanced mix between guest-friendly (63.4%) and stricter (36.7%) policies, offering choices for different guest needs.
- Strict cancellation policies are quite rare (6.7%), potentially making listings with this policy less competitive unless justified by high demand or property type.
Recommendations for Hosts
- Consider adopting a Flexible policy to align with the 31.7% market standard in Schertz.
- Using a Strict policy might deter some guests, as only 6.7% of listings use it. Evaluate if potential revenue protection outweighs possible lower booking rates.
- Regularly review your cancellation policy against competitors and market demand shifts in Schertz.
Schertz STR Booking Lead Time Analysis (2026)
Average Booking Lead Time by Month
Booking Lead Time Insights for Schertz
- The overall average booking lead time for vacation rentals in Schertz is 32 days.
- Guests book furthest in advance for stays during May (average 55 days), likely coinciding with peak travel demand or local events.
- The shortest booking windows occur for stays in January (average 21 days), indicating more last-minute travel plans during this time.
- Seasonally, Spring (41 days avg.) sees the longest lead times, while Winter (31 days avg.) has the shortest, reflecting typical travel planning cycles.
Recommendations for Hosts
- Use the overall average lead time (32 days) as a baseline for your pricing and availability strategy in Schertz.
- For May stays, consider implementing length-of-stay discounts or slightly higher rates for bookings made less than 55 days out to capitalize on advance planning.
- Target marketing efforts for the Spring season well in advance (at least 41 days) to capture early planners.
- Monitor your own booking lead times against these Schertz averages to identify opportunities for dynamic pricing adjustments.
Popular & Essential Airbnb Amenities in Schertz (2026)
Amenity Prevalence
Amenity Insights for Schertz
- Essential amenities in Schertz that guests expect include: Air conditioning, TV, Wifi, Heating, Free parking on premises, Hot water. Lacking these (any) could significantly impact bookings.
- Popular amenities like Kitchen, Refrigerator, Smoke alarm are common but not universal. Offering these can provide a competitive edge.
Recommendations for Hosts
- Ensure your listing includes all essential amenities for Schertz: Air conditioning, TV, Wifi, Heating, Free parking on premises, Hot water.
- Prioritize adding missing essentials: Wifi, Heating, Free parking on premises, Hot water.
- Consider adding popular differentiators like Kitchen or Refrigerator to increase appeal.
- Highlight unique or less common amenities you offer (e.g., hot tub, dedicated workspace, EV charger) in your listing description and photos.
- Regularly check competitor amenities in Schertz to stay competitive.
Schertz Airbnb Guest Demographics & Profile Analysis (2026)
Guest Profile Summary for Schertz
- The typical guest profile for Airbnb in Schertz consists of primarily domestic travelers (96%), often arriving from nearby Houston, typically belonging to the Post-2000s (Gen Z/Alpha) group (50%), primarily speaking English or Spanish.
- Domestic travelers account for 96.2% of guests.
- Key international markets include United States (96.2%) and Mexico (2.1%).
- Top languages spoken are English (67.8%) followed by Spanish (23.6%).
- A significant demographic segment is the Post-2000s (Gen Z/Alpha) group, representing 50% of guests.
Recommendations for Hosts
- Target domestic marketing efforts towards travelers from Houston and San Antonio.
- Tailor amenities and listing descriptions to appeal to the dominant Post-2000s (Gen Z/Alpha) demographic (e.g., highlight fast WiFi, smart home features, local guides).
- Highlight unique local experiences or amenities relevant to the primary guest profile.
- Consider seasonal promotions aligned with peak travel times for key origin markets.
Nearby Short-Term Rental Market Comparison
How does the Schertz Airbnb market stack up against its neighbors? Compare key performance metrics like average monthly revenue, ADR, and occupancy rates in surrounding areas to understand the broader regional STR landscape.
| Market | Active Properties | Monthly Revenue | Daily Rate | Avg. Occupancy |
|---|---|---|---|---|
| Hudson Bend | 59 | $5,436 | $611.45 | 31% |
| Jonestown | 60 | $5,240 | $513.31 | 32% |
| Gillespie County | 11 | $4,887 | $351.24 | 59% |
| West Lake Hills | 21 | $4,391 | $656.35 | 34% |
| Helotes | 48 | $4,095 | $322.31 | 42% |
| Kingsland | 255 | $4,055 | $564.92 | 27% |
| Cottonwood Shores | 26 | $4,012 | $408.66 | 35% |
| Round Mountain | 17 | $3,781 | $385.24 | 42% |
| Volente | 19 | $3,627 | $462.89 | 30% |
| Dripping Springs | 403 | $3,493 | $389.50 | 32% |