San Marcos Airbnb Market Analysis 2026: Short Term Rental Data & Vacation Rental Statistics in Texas, United States
Is Airbnb profitable in San Marcos in 2026? Explore comprehensive Airbnb analytics for San Marcos, Texas, United States to uncover income potential. This 2026 STR market report for San Marcos, based on AirROI data from February 2025 to January 2026, reveals key trends in the market of 236 active listings.
Whether you're considering an Airbnb investment in San Marcos, optimizing your existing vacation rental, or exploring rental arbitrage opportunities, understanding the San Marcos Airbnb data is crucial. Leveraging the low regulation environment is key to maximizing your short term rental income potential. Let's dive into the specifics.
Key San Marcos Airbnb Performance Metrics Overview
Monthly Airbnb Revenue Variations & Income Potential in San Marcos (2026)
Understanding the monthly revenue variations for Airbnb listings in San Marcos is key to maximizing your short term rental income potential. Seasonality significantly impacts earnings. Our analysis, based on data from the past 12 months, shows that the peak revenue month for STRs in San Marcos is typically July, while January often presents the lowest earnings, highlighting opportunities for strategic pricing adjustments during shoulder and low seasons. Explore the typical Airbnb income in San Marcos across different performance tiers:
- Best-in-class properties (Top 10%) achieve $5,748+ monthly, often utilizing dynamic pricing and superior guest experiences.
- Strong performing properties (Top 25%) earn $3,130 or more, indicating effective management and desirable locations/amenities.
- Typical properties (Median) generate around $1,853 per month, representing the average market performance.
- Entry-level properties (Bottom 25%) see earnings around $938, often with potential for optimization.
Average Monthly Airbnb Earnings Trend in San Marcos
San Marcos Airbnb Occupancy Rate Trends (2026)
Maximize your bookings by understanding the San Marcos STR occupancy trends. Seasonal demand shifts significantly influence how often properties are booked. Typically, Julysees the highest demand (peak season occupancy), while January experiences the lowest (low season). Effective strategies, like adjusting minimum stays or offering promotions, can boost occupancy during slower periods. Here's how different property tiers perform in San Marcos:
- Best-in-class properties (Top 10%) achieve 69%+ occupancy, indicating high desirability and potentially optimized availability.
- Strong performing properties (Top 25%) maintain 54% or higher occupancy, suggesting good market fit and guest satisfaction.
- Typical properties (Median) have an occupancy rate around 36%.
- Entry-level properties (Bottom 25%) average 19% occupancy, potentially facing higher vacancy.
Average Monthly Occupancy Rate Trend in San Marcos
Average Daily Rate (ADR) Airbnb Trends in San Marcos (2026)
Effective short term rental pricing strategy in San Marcos involves understanding monthly ADR fluctuations. The Average Daily Rate (ADR) for Airbnb in San Marcos typically peaks in October and dips lowest during February. Leveraging Airbnb dynamic pricing tools or strategies based on this seasonality can significantly boost revenue. Here's a look at the typical nightly rates achieved:
- Best-in-class properties (Top 10%) command rates of $412+ per night, often due to premium features or locations.
- Strong performing properties (Top 25%) achieve nightly rates of $257 or more.
- Typical properties (Median) charge around $161 per night.
- Entry-level properties (Bottom 25%) earn around $105 per night.
Average Daily Rate (ADR) Trend by Month in San Marcos
Get Live San Marcos Market Intelligence 👇

Explore Real-time Analytics
Airbnb Seasonality Analysis & Trends in San Marcos (2026)
Peak Season (July, June, May)
- Revenue averages $3,281 per month
- Occupancy rates average 43.5%
- Daily rates average $225
Shoulder Season
- Revenue averages $2,714 per month
- Occupancy maintains around 38.8%
- Daily rates hold near $220
Low Season (January, February, September)
- Revenue drops to average $1,931 per month
- Occupancy decreases to average 31.1%
- Daily rates adjust to average $213
Seasonality Insights for San Marcos
- The Airbnb seasonality in San Marcos shows moderate seasonality with distinct peak and low periods. While the sections above show seasonal averages, it's also insightful to look at the extremes:
- During the high season, the absolute peak month showcases San Marcos's highest earning potential, with monthly revenues capable of climbing to $3,404, occupancy reaching a high of 45.7%, and ADRs peaking at $232.
- Conversely, the slowest single month of the year, typically falling within the low season, marks the market's lowest point. In this month, revenue might dip to $1,694, occupancy could drop to 27.5%, and ADRs may adjust down to $202.
- Understanding both the seasonal averages and these monthly peaks and troughs in revenue, occupancy, and ADR is crucial for maximizing your Airbnb profit potential in San Marcos.
Seasonal Strategies for Maximizing Profit
- Peak Season: Maximize revenue through premium pricing and potentially longer minimum stays. Ensure high availability.
- Low Season: Offer competitive pricing, special promotions (e.g., extended stay discounts), and flexible cancellation policies. Target off-season travelers like remote workers or budget-conscious guests.
- Shoulder Seasons: Implement dynamic pricing that balances peak and low rates. Target weekend travelers or specific events. Offer slightly more flexible terms than peak season.
- Regularly analyze your own performance against these San Marcos seasonality benchmarks and adjust your pricing and availability strategy accordingly.
Best Areas for Airbnb Investment in San Marcos (2026)
Exploring the top neighborhoods for short-term rentals in San Marcos? This section highlights key areas, outlining why they are attractive for hosts and guests, along with notable local attractions. Consider these locations based on your target guest profile and investment strategy.
| Neighborhood / Area | Why Host Here? (Target Guests & Appeal) | Key Attractions & Landmarks |
|---|---|---|
| Downtown San Marcos | The heart of the city, known for its restaurants, shops, and vibrant nightlife. It's a prime spot for tourists and students due to its proximity to the university and river activities. | San Marcos River, Texas State University, Outlet Malls, Brazos Hall, The San Marcos Plaza Park |
| San Marcos River | Ideal for outdoor enthusiasts and families, this area offers easy access to the river for tubing, kayaking, and picnics, making it a popular destination during the warmer months. | Rio Vista Park, Tubing and Kayaking, Parks and Trails, Nature Areas, Waterfront Dining |
| Wonder World Cave | A unique attraction that combines a cave system with wildlife and amusement park features, drawing visitors looking for adventure and entertainment. | Wonder World Park, Cave Tours, Animal Park, Aerial Zip Line, Mini Golf |
| Outlet Malls | A shopper's paradise with numerous brands and discount shops, attracting bargain hunters from all over, especially on weekends and holidays. | Premium Outlets, Dining Options nearby, Shopping Events, Seasonal Sales, Family-friendly Activities |
| Old Town | Rich in history, this area features charming architecture and local shops, making it a delightful spot for tourists wanting to experience the town's heritage. | Historic Courthouse, Local Artisan Shops, Restaurants and Cafes, Live Music Venues, Markets |
| Aquarena Springs | A beautiful nature area focusing on eco-tourism, which attracts visitors interested in history, education, and the natural surroundings. | Aquarena Center, Glass Bottom Boat Tours, Nature Trails, Wildlife Viewing, Educational Programs |
| Texas State University | A thriving academic hub with a large student population, making it ideal for short-term rentals targeted at university visitors and events. | University Campus, Sports Events, Cultural Events, Educational Workshops, Student Life Activities |
| Seguin | Just a short drive from San Marcos, Seguin offers a small-town charm with its historic downtown and access to outdoor activities. | The Zorn Sports Park, Sebastopol House, Local Festivals, River Activities, Historical Sites |
Understanding Airbnb License Requirements & STR Laws in San Marcos (2026)
While San Marcos, Texas, United States currently shows low STR regulations, specific Airbnb license requirements might still exist or change. Always verify the latest short term rental regulations and Airbnb license requirements directly with local government authorities for San Marcos to ensure full compliance before hosting.
(Source: AirROI data, 2026, based on 1% licensed listings)
Top Performing Airbnb Properties in San Marcos (2026)
Benchmark your potential! Explore examples of top-performing Airbnb properties in San Marcosbased on Trailing Twelve Month (TTM) revenue. Analyze their characteristics, revenue, occupancy rate, and ADR to understand what drives success in this market.
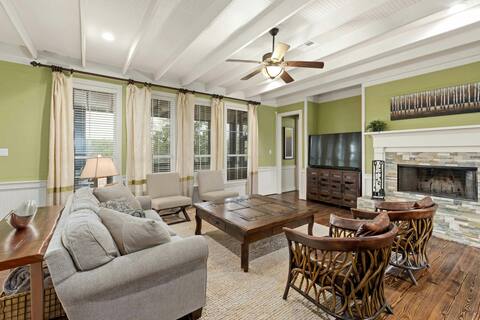
Enormous Estate w/Private Pool & Pickleball Court
Entire Place • 11 bedrooms
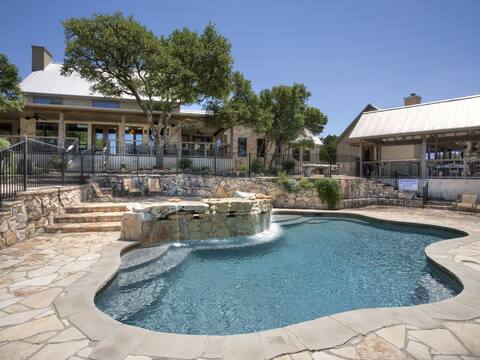
Rim Rock Lodge
Entire Place • 6 bedrooms

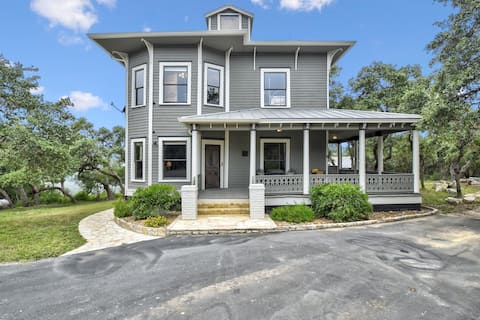
15 Acre Farm Stay with Hot Tub & Game Room
Entire Place • 3 bedrooms
Ridge View Escape
Entire Place • 6 bedrooms

San Marcos 5BR Retreat • Pool • Near TXST & River
Entire Place • 5 bedrooms

Extraordinary Home on 4 Acres w/Private Pool
Entire Place • 5 bedrooms
Note: Performance varies based on location, size, amenities, seasonality, and management quality. Data reflects the past 12 months.
Top Performing Airbnb Hosts in San Marcos (2026)
Learn from the best! This table showcases top-performing Airbnb hosts in San Marcos based on the number of properties managed and estimated total revenue over the past year. Analyze their scale and performance metrics.
| Host Name | Properties | Grossing Revenue | Stay Reviews | Avg Rating |
|---|---|---|---|---|
| Shiloh | 4 | $407,617 | 134 | 4.95/5.0 |
| Wendy Michelle | 2 | $335,471 | 118 | 4.95/5.0 |
| Hill Country Premier Lodging | 9 | $259,061 | 200 | 4.66/5.0 |
| Evolve | 7 | $224,844 | 147 | 4.91/5.0 |
| Dillar And Keri | 6 | $201,570 | 399 | 4.88/5.0 |
| Brittaney | 11 | $200,848 | 1780 | 4.81/5.0 |
| Kevin | 1 | $129,348 | 183 | 4.95/5.0 |
| Breezy | 1 | $114,516 | 49 | 4.82/5.0 |
| Evolve | 5 | $102,630 | 162 | 4.89/5.0 |
| Corley | 4 | $97,010 | 72 | 4.89/5.0 |
Analyzing the strategies of top hosts, such as their property selection, pricing, and guest communication, can offer valuable lessons for optimizing your own Airbnb operations in San Marcos.
Dive Deeper: Advanced San Marcos STR Market Data (2026)
Ready to unlock more insights? AirROI provides access to advanced metrics and comprehensive Airbnb data for San Marcos. Explore detailed analytics beyond this report to refine your investment strategy, optimize pricing, and maximize your vacation rental profits.
Explore Advanced MetricsSan Marcos Short-Term Rental Market Composition (2026): Property & Room Types
Room Type Distribution
Property Type Distribution
Market Composition Insights for San Marcos
- The San Marcos Airbnb market composition is heavily skewed towards Entire Home/Apt listings, which make up 88.6% of the 236 active rentals. This indicates strong guest preference for privacy and space.
- Looking at the property type distribution in San Marcos, House properties are the most common (64%), reflecting the local real estate landscape.
- Houses represent a significant 64% portion, catering likely to families or larger groups.
- The presence of 6.8% Hotel/Boutique listings indicates integration with traditional hospitality.
- Smaller segments like others, unique stays (combined 2.9%) offer potential for unique stay experiences.
San Marcos Airbnb Room Capacity Analysis (2026): Bedroom Distribution
Distribution of Listings by Number of Bedrooms
Room Capacity Insights for San Marcos
- The dominant room capacity in San Marcos is 2 bedrooms listings, making up 29.2% of the market. This suggests a strong demand for properties suitable for couples or solo travelers.
- Together, 2 bedrooms and 1 bedroom properties represent 55.9% of the active Airbnb listings in San Marcos, indicating a high concentration in these sizes.
- A significant 34.7% of listings offer 3+ bedrooms, catering to larger groups and families seeking more space in San Marcos.
San Marcos Vacation Rental Guest Capacity Trends (2026)
Distribution of Listings by Guest Capacity
Guest Capacity Insights for San Marcos
- The most common guest capacity trend in San Marcos vacation rentals is listings accommodating 8+ guests (24.6%). This suggests the primary traveler segment is likely larger groups.
- Properties designed for 8+ guests and 2 guests dominate the San Marcos STR market, accounting for 44.1% of listings.
- 39.0% of properties accommodate 6+ guests, serving the market segment for larger families or group travel in San Marcos.
- On average, properties in San Marcos are equipped to host 4.6 guests.
San Marcos Airbnb Booking Patterns (2026): Available vs. Booked Days
Available Days Distribution
Booked Days Distribution
Booking Pattern Insights for San Marcos
- The most common availability pattern in San Marcos falls within the 181-270 days range, representing 42.4% of listings. This suggests many properties have significant open periods on their calendars.
- Approximately 84.3% of listings show high availability (181+ days open annually), indicating potential for increased bookings or specific owner usage patterns.
- For booked days, the 91-180 days range is most frequent in San Marcos (41.5%), reflecting common guest stay durations or potential owner blocking patterns.
- A notable 18.2% of properties secure long booking periods (181+ days booked per year), highlighting successful long-term rental strategies or significant owner usage.
San Marcos Airbnb Minimum Stay Requirements Analysis
Distribution of Listings by Minimum Night Requirement
1 Night
72 listings
30.5% of total
2 Nights
93 listings
39.4% of total
3 Nights
1 listings
0.4% of total
4-6 Nights
9 listings
3.8% of total
7-29 Nights
9 listings
3.8% of total
30+ Nights
52 listings
22% of total
Key Insights
- The most prevalent minimum stay requirement in San Marcos is 2 Nights, adopted by 39.4% of listings. This highlights the market's preference for shorter, flexible bookings.
- A strong majority (69.9%) of the San Marcos Airbnb data shows acceptance of very short stays (1-2 nights), indicating a dynamic, high-turnover market.
- A significant segment (22%) caters to monthly stays (30+ nights) in San Marcos, pointing to opportunities in the extended-stay market.
Recommendations
- Align with the market by considering a 2 Nights minimum stay, as 39.4% of San Marcos hosts use this setting.
- Explore offering discounts for stays of 30+ nights to attract the 22% of the market seeking extended stays.
- Adjust minimum nights based on seasonality – potentially shorter during low season and longer during peak demand periods in San Marcos.
San Marcos Airbnb Cancellation Policy Trends Analysis (2026)
Limited
2 listings
0.8% of total
Super Strict 60 Days
1 listings
0.4% of total
Super Strict 30 Days
17 listings
7.2% of total
Flexible
60 listings
25.4% of total
Moderate
60 listings
25.4% of total
Firm
63 listings
26.7% of total
Strict
33 listings
14% of total
Cancellation Policy Insights for San Marcos
- The prevailing Airbnb cancellation policy trend in San Marcos is Firm, used by 26.7% of listings.
- There's a relatively balanced mix between guest-friendly (50.8%) and stricter (40.7%) policies, offering choices for different guest needs.
Recommendations for Hosts
- Consider adopting a Firm policy to align with the 26.7% market standard in San Marcos.
- Using a Strict policy might deter some guests, as only 14% of listings use it. Evaluate if potential revenue protection outweighs possible lower booking rates.
- Regularly review your cancellation policy against competitors and market demand shifts in San Marcos.
San Marcos STR Booking Lead Time Analysis (2026)
Average Booking Lead Time by Month
Booking Lead Time Insights for San Marcos
- The overall average booking lead time for vacation rentals in San Marcos is 37 days.
- Guests book furthest in advance for stays during May (average 50 days), likely coinciding with peak travel demand or local events.
- The shortest booking windows occur for stays in February (average 18 days), indicating more last-minute travel plans during this time.
- Seasonally, Fall (46 days avg.) sees the longest lead times, while Winter (29 days avg.) has the shortest, reflecting typical travel planning cycles.
Recommendations for Hosts
- Use the overall average lead time (37 days) as a baseline for your pricing and availability strategy in San Marcos.
- For May stays, consider implementing length-of-stay discounts or slightly higher rates for bookings made less than 50 days out to capitalize on advance planning.
- Target marketing efforts for the Fall season well in advance (at least 46 days) to capture early planners.
- Monitor your own booking lead times against these San Marcos averages to identify opportunities for dynamic pricing adjustments.
Popular & Essential Airbnb Amenities in San Marcos (2026)
Amenity Prevalence
Amenity Insights for San Marcos
- Essential amenities in San Marcos that guests expect include: Air conditioning, Free parking on premises, Wifi. Lacking these (any) could significantly impact bookings.
- Popular amenities like Smoke alarm, Heating, TV are common but not universal. Offering these can provide a competitive edge.
Recommendations for Hosts
- Ensure your listing includes all essential amenities for San Marcos: Air conditioning, Free parking on premises, Wifi.
- Prioritize adding missing essentials: Air conditioning, Free parking on premises, Wifi.
- Consider adding popular differentiators like Smoke alarm or Heating to increase appeal.
- Highlight unique or less common amenities you offer (e.g., hot tub, dedicated workspace, EV charger) in your listing description and photos.
- Regularly check competitor amenities in San Marcos to stay competitive.
San Marcos Airbnb Guest Demographics & Profile Analysis (2026)
Guest Profile Summary for San Marcos
- The typical guest profile for Airbnb in San Marcos consists of primarily domestic travelers (97%), often arriving from nearby Houston, typically belonging to the Post-2000s (Gen Z/Alpha) group (50%), primarily speaking English or Spanish.
- Domestic travelers account for 96.9% of guests.
- Key international markets include United States (96.9%) and Mexico (1.2%).
- Top languages spoken are English (70.1%) followed by Spanish (21.2%).
- A significant demographic segment is the Post-2000s (Gen Z/Alpha) group, representing 50% of guests.
Recommendations for Hosts
- Target domestic marketing efforts towards travelers from Houston and Austin.
- Tailor amenities and listing descriptions to appeal to the dominant Post-2000s (Gen Z/Alpha) demographic (e.g., highlight fast WiFi, smart home features, local guides).
- Highlight unique local experiences or amenities relevant to the primary guest profile.
- Consider seasonal promotions aligned with peak travel times for key origin markets.
Nearby Short-Term Rental Market Comparison
How does the San Marcos Airbnb market stack up against its neighbors? Compare key performance metrics like average monthly revenue, ADR, and occupancy rates in surrounding areas to understand the broader regional STR landscape.
| Market | Active Properties | Monthly Revenue | Daily Rate | Avg. Occupancy |
|---|---|---|---|---|
| Hudson Bend | 59 | $5,436 | $611.45 | 31% |
| Jonestown | 60 | $5,240 | $513.31 | 32% |
| Gillespie County | 11 | $4,887 | $351.24 | 59% |
| Midfield | 10 | $4,574 | $539.57 | 23% |
| West Lake Hills | 21 | $4,391 | $656.35 | 34% |
| Helotes | 48 | $4,095 | $322.31 | 42% |
| Kingsland | 255 | $4,055 | $564.92 | 27% |
| Cottonwood Shores | 26 | $4,012 | $408.66 | 35% |
| Round Mountain | 17 | $3,781 | $385.24 | 42% |
| Volente | 19 | $3,627 | $462.89 | 30% |