San Antonio Airbnb Market Analysis 2026: Short Term Rental Data & Vacation Rental Statistics in Texas, United States
Is Airbnb profitable in San Antonio in 2026? Explore comprehensive Airbnb analytics for San Antonio, Texas, United States to uncover income potential. This 2026 STR market report for San Antonio, based on AirROI data from February 2025 to January 2026, reveals key trends in the bustling market of 5,190 active listings.
Whether you're considering an Airbnb investment in San Antonio, optimizing your existing vacation rental, or exploring rental arbitrage opportunities, understanding the San Antonio Airbnb data is crucial. Navigating the high regulation landscape is key to maximizing your short term rental income potential. Let's dive into the specifics.
Key San Antonio Airbnb Performance Metrics Overview
Monthly Airbnb Revenue Variations & Income Potential in San Antonio (2026)
Understanding the monthly revenue variations for Airbnb listings in San Antonio is key to maximizing your short term rental income potential. Seasonality significantly impacts earnings. Our analysis, based on data from the past 12 months, shows that the peak revenue month for STRs in San Antonio is typically December, while January often presents the lowest earnings, highlighting opportunities for strategic pricing adjustments during shoulder and low seasons. Explore the typical Airbnb income in San Antonio across different performance tiers:
- Best-in-class properties (Top 10%) achieve $5,788+ monthly, often utilizing dynamic pricing and superior guest experiences.
- Strong performing properties (Top 25%) earn $3,720 or more, indicating effective management and desirable locations/amenities.
- Typical properties (Median) generate around $2,112 per month, representing the average market performance.
- Entry-level properties (Bottom 25%) see earnings around $1,015, often with potential for optimization.
Average Monthly Airbnb Earnings Trend in San Antonio
San Antonio Airbnb Occupancy Rate Trends (2026)
Maximize your bookings by understanding the San Antonio STR occupancy trends. Seasonal demand shifts significantly influence how often properties are booked. Typically, Marchsees the highest demand (peak season occupancy), while January experiences the lowest (low season). Effective strategies, like adjusting minimum stays or offering promotions, can boost occupancy during slower periods. Here's how different property tiers perform in San Antonio:
- Best-in-class properties (Top 10%) achieve 80%+ occupancy, indicating high desirability and potentially optimized availability.
- Strong performing properties (Top 25%) maintain 65% or higher occupancy, suggesting good market fit and guest satisfaction.
- Typical properties (Median) have an occupancy rate around 44%.
- Entry-level properties (Bottom 25%) average 23% occupancy, potentially facing higher vacancy.
Average Monthly Occupancy Rate Trend in San Antonio
Average Daily Rate (ADR) Airbnb Trends in San Antonio (2026)
Effective short term rental pricing strategy in San Antonio involves understanding monthly ADR fluctuations. The Average Daily Rate (ADR) for Airbnb in San Antonio typically peaks in December and dips lowest during February. Leveraging Airbnb dynamic pricing tools or strategies based on this seasonality can significantly boost revenue. Here's a look at the typical nightly rates achieved:
- Best-in-class properties (Top 10%) command rates of $334+ per night, often due to premium features or locations.
- Strong performing properties (Top 25%) achieve nightly rates of $229 or more.
- Typical properties (Median) charge around $161 per night.
- Entry-level properties (Bottom 25%) earn around $102 per night.
Average Daily Rate (ADR) Trend by Month in San Antonio
Get Live San Antonio Market Intelligence 👇

Explore Real-time Analytics
Airbnb Seasonality Analysis & Trends in San Antonio (2026)
Peak Season (December, July, June)
- Revenue averages $3,372 per month
- Occupancy rates average 48.6%
- Daily rates average $199
Shoulder Season
- Revenue averages $2,757 per month
- Occupancy maintains around 45.5%
- Daily rates hold near $186
Low Season (January, February, September)
- Revenue drops to average $2,255 per month
- Occupancy decreases to average 40.0%
- Daily rates adjust to average $184
Seasonality Insights for San Antonio
- The Airbnb seasonality in San Antonio shows moderate seasonality with distinct peak and low periods. While the sections above show seasonal averages, it's also insightful to look at the extremes:
- During the high season, the absolute peak month showcases San Antonio's highest earning potential, with monthly revenues capable of climbing to $3,464, occupancy reaching a high of 54.9%, and ADRs peaking at $217.
- Conversely, the slowest single month of the year, typically falling within the low season, marks the market's lowest point. In this month, revenue might dip to $2,131, occupancy could drop to 33.1%, and ADRs may adjust down to $172.
- Understanding both the seasonal averages and these monthly peaks and troughs in revenue, occupancy, and ADR is crucial for maximizing your Airbnb profit potential in San Antonio.
Seasonal Strategies for Maximizing Profit
- Peak Season: Maximize revenue through premium pricing and potentially longer minimum stays. Ensure high availability.
- Low Season: Offer competitive pricing, special promotions (e.g., extended stay discounts), and flexible cancellation policies. Target off-season travelers like remote workers or budget-conscious guests.
- Shoulder Seasons: Implement dynamic pricing that balances peak and low rates. Target weekend travelers or specific events. Offer slightly more flexible terms than peak season.
- Regularly analyze your own performance against these San Antonio seasonality benchmarks and adjust your pricing and availability strategy accordingly.
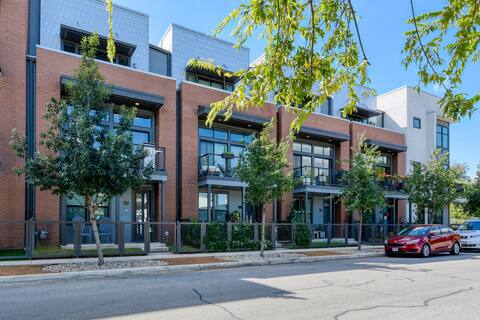
Best Areas for Airbnb Investment in San Antonio (2026)
Exploring the top neighborhoods for short-term rentals in San Antonio? This section highlights key areas, outlining why they are attractive for hosts and guests, along with notable local attractions. Consider these locations based on your target guest profile and investment strategy.
| Neighborhood / Area | Why Host Here? (Target Guests & Appeal) | Key Attractions & Landmarks |
|---|---|---|
| River Walk | A bustling urban waterway lined with restaurants, shops, and bars, making it a popular destination for tourists and locals alike. | The Alamo, San Antonio Museum of Art, La Villita Historic Arts Village, San Fernando Cathedral, River Walk boat tours |
| La Villita | An historic arts village with charming shops and galleries, attracting visitors looking for a cultural experience and local art. | Art galleries, Craft shops, Cultural events, The Arneson River Theatre |
| The Pearl District | A trendy neighborhood featuring a farmers market, restaurants, and shops set in a repurposed brewery, appealing to foodies and young professionals. | Pearl Brewery, The Culinary Institute of America, Farmers Market, The Hotel Emma |
| Alamo Heights | An affluent neighborhood known for its beautiful homes and excellent schools, appealing to families and long-term renters. | San Antonio Country Club, The McNay Art Museum, Restaurants and boutiques on Broadway |
| Downtown San Antonio | The vibrant heart of the city offers a mix of business, culture, and nightlife, attracting a diverse range of visitors and residents. | The Alamo, Tower Life Building, San Antonio City Hall, Local theaters and music venues |
| Stone Oak | A suburban area known for its family-friendly atmosphere and high-quality schools, attracting families and long-term renters. | Shopping centers, Parks and recreational areas, Stone Oak Park |
| Southtown | An artsy neighborhood in the near South Side known for its local eateries and art galleries, popular with creatives and those seeking a unique experience. | Blue Star Arts Complex, Local restaurants and bars, Art galleries, Cultural festivals |
| Northwest Side | A growing area with a mix of residential and commercial developments, attracting families and renters looking for affordable housing options. | Local parks, Shopping centers, Schools and recreational facilities |
Understanding Airbnb License Requirements & STR Laws in San Antonio (2026)
Yes, San Antonio, Texas, United States enforces high STR regulations. Obtaining a license and ensuring compliance is almost certainly required according to current 2026 STR laws. Always verify the latest short term rental regulations and Airbnb license requirements directly with local government authorities for San Antonio to ensure full compliance before hosting.
(Source: AirROI data, 2026, based on 55% licensed listings)
Top Performing Airbnb Properties in San Antonio (2026)
Benchmark your potential! Explore examples of top-performing Airbnb properties in San Antoniobased on Trailing Twelve Month (TTM) revenue. Analyze their characteristics, revenue, occupancy rate, and ADR to understand what drives success in this market.

Private Large Pool | King Bed Casita
Entire Place • 1 bedroom

7BR Luxury w/ Pool, Hot Tub, Mini Golf, Sleeps 22!
Entire Place • 7 bedrooms
Steps to Pearl - Two Townhomes - Sleeps 22
Entire Place • 8 bedrooms

Sleeps 20 Mansion w Golf Sim *2 Homes *Pool/HotTub
Entire Place • 6 bedrooms

Fortaleza l Infinity Pool w/ Mountain View
Entire Place • 8 bedrooms

Lone Star Luxe: Pool, Indoor Slide & Sport Court!
Entire Place • 6 bedrooms
Note: Performance varies based on location, size, amenities, seasonality, and management quality. Data reflects the past 12 months.
Top Performing Airbnb Hosts in San Antonio (2026)
Learn from the best! This table showcases top-performing Airbnb hosts in San Antonio based on the number of properties managed and estimated total revenue over the past year. Analyze their scale and performance metrics.
| Host Name | Properties | Grossing Revenue | Stay Reviews | Avg Rating |
|---|---|---|---|---|
| Daniel | 47 | $2,480,461 | 4514 | 4.79/5.0 |
| David | 67 | $1,981,423 | 6388 | 4.83/5.0 |
| Evolve | 76 | $1,834,858 | 1698 | 4.66/5.0 |
| Erika | 65 | $1,725,059 | 3413 | 4.76/5.0 |
| Zohaib | 28 | $1,423,469 | 1881 | 4.85/5.0 |
| Anna And Jeremy | 20 | $1,400,467 | 1095 | 4.94/5.0 |
| Sergio | 40 | $1,314,198 | 1381 | 4.77/5.0 |
| Alex | 26 | $1,310,615 | 1671 | 4.72/5.0 |
| RiverCity Hosting | 15 | $1,248,861 | 649 | 4.98/5.0 |
| Camila | 18 | $1,219,433 | 1950 | 4.81/5.0 |
Analyzing the strategies of top hosts, such as their property selection, pricing, and guest communication, can offer valuable lessons for optimizing your own Airbnb operations in San Antonio.
Dive Deeper: Advanced San Antonio STR Market Data (2026)
Ready to unlock more insights? AirROI provides access to advanced metrics and comprehensive Airbnb data for San Antonio. Explore detailed analytics beyond this report to refine your investment strategy, optimize pricing, and maximize your vacation rental profits.
Explore Advanced MetricsSan Antonio Short-Term Rental Market Composition (2026): Property & Room Types
Room Type Distribution
Property Type Distribution
Market Composition Insights for San Antonio
- The San Antonio Airbnb market composition is heavily skewed towards Entire Home/Apt listings, which make up 89.2% of the 5,190 active rentals. This indicates strong guest preference for privacy and space.
- Looking at the property type distribution in San Antonio, House properties are the most common (72.2%), reflecting the local real estate landscape.
- Houses represent a significant 72.2% portion, catering likely to families or larger groups.
- Smaller segments like others, outdoor/unique, unique stays (combined 2.5%) offer potential for unique stay experiences.
San Antonio Airbnb Room Capacity Analysis (2026): Bedroom Distribution
Distribution of Listings by Number of Bedrooms
Room Capacity Insights for San Antonio
- The dominant room capacity in San Antonio is 3 bedrooms listings, making up 29.9% of the market. This suggests a strong demand for properties suitable for families or small groups.
- Together, 3 bedrooms and 1 bedroom properties represent 49.8% of the active Airbnb listings in San Antonio, indicating a high concentration in these sizes.
- A significant 52.1% of listings offer 3+ bedrooms, catering to larger groups and families seeking more space in San Antonio.
San Antonio Vacation Rental Guest Capacity Trends (2026)
Distribution of Listings by Guest Capacity
Guest Capacity Insights for San Antonio
- The most common guest capacity trend in San Antonio vacation rentals is listings accommodating 8+ guests (38.5%). This suggests the primary traveler segment is likely larger groups.
- Properties designed for 8+ guests and 6 guests dominate the San Antonio STR market, accounting for 55.8% of listings.
- 60.3% of properties accommodate 6+ guests, serving the market segment for larger families or group travel in San Antonio.
- On average, properties in San Antonio are equipped to host 5.5 guests.
San Antonio Airbnb Booking Patterns (2026): Available vs. Booked Days
Available Days Distribution
Booked Days Distribution
Booking Pattern Insights for San Antonio
- The most common availability pattern in San Antonio falls within the 271-366 days range, representing 43.1% of listings. This suggests many properties have significant open periods on their calendars.
- Approximately 76.0% of listings show high availability (181+ days open annually), indicating potential for increased bookings or specific owner usage patterns.
- For booked days, the 91-180 days range is most frequent in San Antonio (33.5%), reflecting common guest stay durations or potential owner blocking patterns.
- A notable 25.3% of properties secure long booking periods (181+ days booked per year), highlighting successful long-term rental strategies or significant owner usage.
San Antonio Airbnb Minimum Stay Requirements Analysis
Distribution of Listings by Minimum Night Requirement
1 Night
1582 listings
30.5% of total
2 Nights
1367 listings
26.3% of total
3 Nights
193 listings
3.7% of total
4-6 Nights
118 listings
2.3% of total
7-29 Nights
430 listings
8.3% of total
30+ Nights
1500 listings
28.9% of total
Key Insights
- The most prevalent minimum stay requirement in San Antonio is 1 Night, adopted by 30.5% of listings. This highlights the market's preference for shorter, flexible bookings.
- A significant segment (28.9%) caters to monthly stays (30+ nights) in San Antonio, pointing to opportunities in the extended-stay market.
Recommendations
- Align with the market by considering a 1 Night minimum stay, as 30.5% of San Antonio hosts use this setting.
- Explore offering discounts for stays of 30+ nights to attract the 28.9% of the market seeking extended stays.
- Adjust minimum nights based on seasonality – potentially shorter during low season and longer during peak demand periods in San Antonio.
San Antonio Airbnb Cancellation Policy Trends Analysis (2026)
Super Strict 60 Days
158 listings
3.1% of total
Super Strict 30 Days
40 listings
0.8% of total
Limited
110 listings
2.1% of total
Flexible
1040 listings
20.1% of total
Moderate
1568 listings
30.3% of total
Firm
1541 listings
29.8% of total
Strict
718 listings
13.9% of total
Cancellation Policy Insights for San Antonio
- The prevailing Airbnb cancellation policy trend in San Antonio is Moderate, used by 30.3% of listings.
- There's a relatively balanced mix between guest-friendly (50.4%) and stricter (43.7%) policies, offering choices for different guest needs.
Recommendations for Hosts
- Consider adopting a Moderate policy to align with the 30.3% market standard in San Antonio.
- Using a Strict policy might deter some guests, as only 13.9% of listings use it. Evaluate if potential revenue protection outweighs possible lower booking rates.
- Regularly review your cancellation policy against competitors and market demand shifts in San Antonio.
San Antonio STR Booking Lead Time Analysis (2026)
Average Booking Lead Time by Month
Booking Lead Time Insights for San Antonio
- The overall average booking lead time for vacation rentals in San Antonio is 27 days.
- Guests book furthest in advance for stays during April (average 41 days), likely coinciding with peak travel demand or local events.
- The shortest booking windows occur for stays in August (average 23 days), indicating more last-minute travel plans during this time.
- Seasonally, Fall (32 days avg.) sees the longest lead times, while Summer (25 days avg.) has the shortest, reflecting typical travel planning cycles.
Recommendations for Hosts
- Use the overall average lead time (27 days) as a baseline for your pricing and availability strategy in San Antonio.
- For April stays, consider implementing length-of-stay discounts or slightly higher rates for bookings made less than 41 days out to capitalize on advance planning.
- Target marketing efforts for the Fall season well in advance (at least 32 days) to capture early planners.
- Monitor your own booking lead times against these San Antonio averages to identify opportunities for dynamic pricing adjustments.
Popular & Essential Airbnb Amenities in San Antonio (2026)
Amenity Prevalence
Amenity Insights for San Antonio
- Essential amenities in San Antonio that guests expect include: Air conditioning, Wifi, Smoke alarm, TV. Lacking these (any) could significantly impact bookings.
- Popular amenities like Heating, Kitchen, Hot water are common but not universal. Offering these can provide a competitive edge.
Recommendations for Hosts
- Ensure your listing includes all essential amenities for San Antonio: Air conditioning, Wifi, Smoke alarm, TV.
- Prioritize adding missing essentials: Air conditioning, Wifi, Smoke alarm, TV.
- Consider adding popular differentiators like Heating or Kitchen to increase appeal.
- Highlight unique or less common amenities you offer (e.g., hot tub, dedicated workspace, EV charger) in your listing description and photos.
- Regularly check competitor amenities in San Antonio to stay competitive.
San Antonio Airbnb Guest Demographics & Profile Analysis (2026)
Guest Profile Summary for San Antonio
- The typical guest profile for Airbnb in San Antonio consists of primarily domestic travelers (92%), often arriving from nearby Houston, typically belonging to the Post-2000s (Gen Z/Alpha) group (50%), primarily speaking English or Spanish.
- Domestic travelers account for 92.1% of guests.
- Key international markets include United States (92.1%) and Mexico (3.8%).
- Top languages spoken are English (63.7%) followed by Spanish (26.3%).
- A significant demographic segment is the Post-2000s (Gen Z/Alpha) group, representing 50% of guests.
Recommendations for Hosts
- Target domestic marketing efforts towards travelers from Houston and San Antonio.
- Tailor amenities and listing descriptions to appeal to the dominant Post-2000s (Gen Z/Alpha) demographic (e.g., highlight fast WiFi, smart home features, local guides).
- Highlight unique local experiences or amenities relevant to the primary guest profile.
- Consider seasonal promotions aligned with peak travel times for key origin markets.
Nearby Short-Term Rental Market Comparison
How does the San Antonio Airbnb market stack up against its neighbors? Compare key performance metrics like average monthly revenue, ADR, and occupancy rates in surrounding areas to understand the broader regional STR landscape.
| Market | Active Properties | Monthly Revenue | Daily Rate | Avg. Occupancy |
|---|---|---|---|---|
| Hudson Bend | 59 | $5,436 | $611.45 | 31% |
| Jonestown | 60 | $5,240 | $513.31 | 32% |
| Gillespie County | 11 | $4,887 | $351.24 | 59% |
| West Lake Hills | 21 | $4,391 | $656.35 | 34% |
| Helotes | 48 | $4,095 | $322.31 | 42% |
| Kingsland | 255 | $4,055 | $564.92 | 27% |
| Cottonwood Shores | 26 | $4,012 | $408.66 | 35% |
| Round Mountain | 17 | $3,781 | $385.24 | 42% |
| Volente | 19 | $3,627 | $462.89 | 30% |
| Dripping Springs | 403 | $3,493 | $389.50 | 32% |