Round Top Airbnb Market Analysis 2026: Short Term Rental Data & Vacation Rental Statistics in Texas, United States
Is Airbnb profitable in Round Top in 2026? Explore comprehensive Airbnb analytics for Round Top, Texas, United States to uncover income potential. This 2026 STR market report for Round Top, based on AirROI data from February 2025 to January 2026, reveals key trends in the niche market of 195 active listings.
Whether you're considering an Airbnb investment in Round Top, optimizing your existing vacation rental, or exploring rental arbitrage opportunities, understanding the Round Top Airbnb data is crucial. Leveraging the low regulation environment is key to maximizing your short term rental income potential. Let's dive into the specifics.
Key Round Top Airbnb Performance Metrics Overview
Monthly Airbnb Revenue Variations & Income Potential in Round Top (2026)
Understanding the monthly revenue variations for Airbnb listings in Round Top is key to maximizing your short term rental income potential. Seasonality significantly impacts earnings. Our analysis, based on data from the past 12 months, shows that the peak revenue month for STRs in Round Top is typically October, while December often presents the lowest earnings, highlighting opportunities for strategic pricing adjustments during shoulder and low seasons. Explore the typical Airbnb income in Round Top across different performance tiers:
- Best-in-class properties (Top 10%) achieve $8,581+ monthly, often utilizing dynamic pricing and superior guest experiences.
- Strong performing properties (Top 25%) earn $4,183 or more, indicating effective management and desirable locations/amenities.
- Typical properties (Median) generate around $2,134 per month, representing the average market performance.
- Entry-level properties (Bottom 25%) see earnings around $1,145, often with potential for optimization.
Average Monthly Airbnb Earnings Trend in Round Top
Round Top Airbnb Occupancy Rate Trends (2026)
Maximize your bookings by understanding the Round Top STR occupancy trends. Seasonal demand shifts significantly influence how often properties are booked. Typically, Octobersees the highest demand (peak season occupancy), while December experiences the lowest (low season). Effective strategies, like adjusting minimum stays or offering promotions, can boost occupancy during slower periods. Here's how different property tiers perform in Round Top:
- Best-in-class properties (Top 10%) achieve 51%+ occupancy, indicating high desirability and potentially optimized availability.
- Strong performing properties (Top 25%) maintain 33% or higher occupancy, suggesting good market fit and guest satisfaction.
- Typical properties (Median) have an occupancy rate around 22%.
- Entry-level properties (Bottom 25%) average 12% occupancy, potentially facing higher vacancy.
Average Monthly Occupancy Rate Trend in Round Top
Average Daily Rate (ADR) Airbnb Trends in Round Top (2026)
Effective short term rental pricing strategy in Round Top involves understanding monthly ADR fluctuations. The Average Daily Rate (ADR) for Airbnb in Round Top typically peaks in October and dips lowest during February. Leveraging Airbnb dynamic pricing tools or strategies based on this seasonality can significantly boost revenue. Here's a look at the typical nightly rates achieved:
- Best-in-class properties (Top 10%) command rates of $775+ per night, often due to premium features or locations.
- Strong performing properties (Top 25%) achieve nightly rates of $462 or more.
- Typical properties (Median) charge around $275 per night.
- Entry-level properties (Bottom 25%) earn around $217 per night.
Average Daily Rate (ADR) Trend by Month in Round Top
Get Live Round Top Market Intelligence 👇

Explore Real-time Analytics
Airbnb Seasonality Analysis & Trends in Round Top (2026)
Peak Season (October, March, November)
- Revenue averages $5,796 per month
- Occupancy rates average 37.9%
- Daily rates average $451
Shoulder Season
- Revenue averages $3,084 per month
- Occupancy maintains around 23.0%
- Daily rates hold near $388
Low Season (January, February, December)
- Revenue drops to average $2,146 per month
- Occupancy decreases to average 17.3%
- Daily rates adjust to average $391
Seasonality Insights for Round Top
- The Airbnb seasonality in Round Top shows highly seasonal trends requiring careful strategy. While the sections above show seasonal averages, it's also insightful to look at the extremes:
- During the high season, the absolute peak month showcases Round Top's highest earning potential, with monthly revenues capable of climbing to $7,885, occupancy reaching a high of 48.0%, and ADRs peaking at $503.
- Conversely, the slowest single month of the year, typically falling within the low season, marks the market's lowest point. In this month, revenue might dip to $2,012, occupancy could drop to 16.4%, and ADRs may adjust down to $354.
- Understanding both the seasonal averages and these monthly peaks and troughs in revenue, occupancy, and ADR is crucial for maximizing your Airbnb profit potential in Round Top.
Seasonal Strategies for Maximizing Profit
- Peak Season: Maximize revenue through premium pricing and potentially longer minimum stays. Ensure high availability.
- Low Season: Offer competitive pricing, special promotions (e.g., extended stay discounts), and flexible cancellation policies. Target off-season travelers like remote workers or budget-conscious guests.
- Shoulder Seasons: Implement dynamic pricing that balances peak and low rates. Target weekend travelers or specific events. Offer slightly more flexible terms than peak season.
- Regularly analyze your own performance against these Round Top seasonality benchmarks and adjust your pricing and availability strategy accordingly.
Best Areas for Airbnb Investment in Round Top (2026)
Exploring the top neighborhoods for short-term rentals in Round Top? This section highlights key areas, outlining why they are attractive for hosts and guests, along with notable local attractions. Consider these locations based on your target guest profile and investment strategy.
| Neighborhood / Area | Why Host Here? (Target Guests & Appeal) | Key Attractions & Landmarks |
|---|---|---|
| Downtown Round Top | The heart of Round Top filled with quaint shops, art galleries, and restaurants. A popular spot for visitors wanting to experience local culture and events like the Antiques Show. | Round Top Antique Show, The Round Top Festival Institute, local boutiques, art galleries, farmer's market |
| Warrenton | Close to Round Top, Warrenton is known for its antique stores and the famous trade days. Ideal for those looking to explore the surrounding area and find unique treasures. | Warrenton Antique Show, local vineyards, historic sites, antique shops |
| Lake Sunflower | Scenic area known for its natural beauty and peaceful environment. Great for families and those looking to relax near nature. | Lake Sunflower, hiking trails, wildlife watching, picnic areas |
| Round Top Woods | A picturesque, wooded area that offers peace and serenity. Popular for those seeking a countryside retreat while being close to town. | nature trails, rural landscapes, privately owned event spaces |
| High Hill | A historic area located north of Round Top, often frequented by visitors hunting for antiques and unique art pieces. | High Hill Church, art galleries, antique shops, local food vendors |
| Chappell Hill | A bit further out but has rich history and charm. It's recognized for its historic buildings and offers a quaint feel with nearby hikes and local events. | Chappell Hill Historical Society, Bluebonnet Festival, local wineries, historic district |
| Fredericksburg | While slightly further away, Fredericksburg is a major tourist hub known for its German heritage, wineries, and beautiful countryside, making it a great complimentary destination for Round Top visitors. | National Museum of the Pacific War, Fredericksburg wine road, historic architecture, shopping and dining |
| Brenham | Known for its historical significance and as the birthplace of Blue Bell ice cream. A friendly town with local events that attract visitors year-round, especially during cherry blossom season. | Blue Bell Creameries, Washington County Courthouse, Brenham Heritage Museum, local festivals and events |
Understanding Airbnb License Requirements & STR Laws in Round Top (2026)
While Round Top, Texas, United States currently shows low STR regulations, specific Airbnb license requirements might still exist or change. Always verify the latest short term rental regulations and Airbnb license requirements directly with local government authorities for Round Top to ensure full compliance before hosting.
(Source: AirROI data, 2026, finding no licensed listings among those analyzed)
Top Performing Airbnb Properties in Round Top (2026)
Benchmark your potential! Explore examples of top-performing Airbnb properties in Round Topbased on Trailing Twelve Month (TTM) revenue. Analyze their characteristics, revenue, occupancy rate, and ADR to understand what drives success in this market.
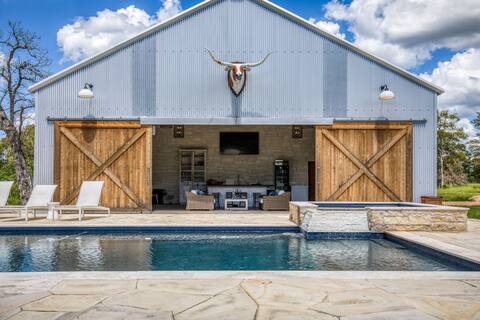
The Longhorn: Luxurious Texas Getaway in Round Top
Entire Place • 7 bedrooms

Cozy Winter Hideaway at The Ranchette | Hot Tub
Entire Place • 4 bedrooms
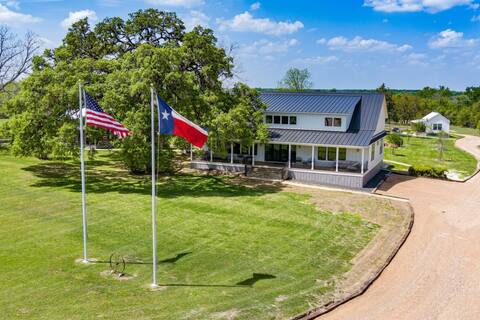
Full Farm Rental in Round Top!
Entire Place • 6 bedrooms

Casa Tres Hermanas | Pool + Hot Tub + Fire Pit + Grill
Entire Place • 4 bedrooms
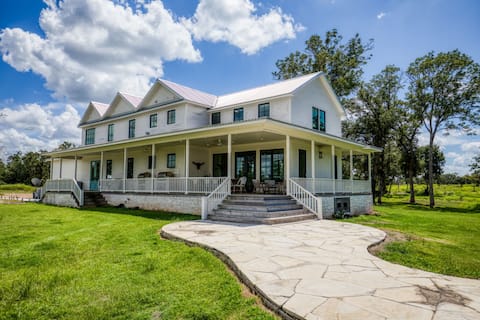
The Longhorn: Luxurious Texas Getaway in Round Top
Entire Place • 5 bedrooms

Pool. Fire Pit. Plush Robes. 6 Min. to Round Top
Entire Place • 5 bedrooms
Note: Performance varies based on location, size, amenities, seasonality, and management quality. Data reflects the past 12 months.
Top Performing Airbnb Hosts in Round Top (2026)
Learn from the best! This table showcases top-performing Airbnb hosts in Round Top based on the number of properties managed and estimated total revenue over the past year. Analyze their scale and performance metrics.
| Host Name | Properties | Grossing Revenue | Stay Reviews | Avg Rating |
|---|---|---|---|---|
| Dakota Zachary | 18 | $1,039,997 | 281 | 4.67/5.0 |
| HOSTÎE Vacation Rentals | 16 | $965,371 | 661 | 4.97/5.0 |
| Jack | 5 | $366,293 | 66 | 4.87/5.0 |
| Jana | 5 | $294,247 | 60 | 4.99/5.0 |
| Wander Inn | 10 | $273,024 | 198 | 4.94/5.0 |
| Brandi | 6 | $208,368 | 177 | 4.88/5.0 |
| Kaci | 19 | $187,056 | 99 | 4.93/5.0 |
| Kyla | 1 | $162,159 | 48 | 4.96/5.0 |
| Blake & Pierce | 9 | $161,687 | 82 | 4.95/5.0 |
| Oakbones | 8 | $130,740 | 169 | 4.77/5.0 |
Analyzing the strategies of top hosts, such as their property selection, pricing, and guest communication, can offer valuable lessons for optimizing your own Airbnb operations in Round Top.
Dive Deeper: Advanced Round Top STR Market Data (2026)
Ready to unlock more insights? AirROI provides access to advanced metrics and comprehensive Airbnb data for Round Top. Explore detailed analytics beyond this report to refine your investment strategy, optimize pricing, and maximize your vacation rental profits.
Explore Advanced MetricsRound Top Short-Term Rental Market Composition (2026): Property & Room Types
Room Type Distribution
Property Type Distribution
Market Composition Insights for Round Top
- The Round Top Airbnb market composition is heavily skewed towards Entire Home/Apt listings, which make up 66.2% of the 195 active rentals. This indicates strong guest preference for privacy and space.
- However, a notable 32.8% share for Private Rooms suggests opportunities for budget-conscious travelers or hosts renting out spare rooms.
- Looking at the property type distribution in Round Top, House properties are the most common (42.6%), reflecting the local real estate landscape.
- Houses represent a significant 42.6% portion, catering likely to families or larger groups.
- The presence of 33.3% Hotel/Boutique listings indicates integration with traditional hospitality.
- Smaller segments like unique stays, others (combined 4.1%) offer potential for unique stay experiences.
Round Top Airbnb Room Capacity Analysis (2026): Bedroom Distribution
Distribution of Listings by Number of Bedrooms
Room Capacity Insights for Round Top
- The dominant room capacity in Round Top is 1 bedroom listings, making up 51.8% of the market. This suggests a strong demand for properties suitable for couples or solo travelers.
- Together, 1 bedroom and 2 bedrooms properties represent 68.2% of the active Airbnb listings in Round Top, indicating a high concentration in these sizes.
- With over half the market (51.8%) consisting of studios or 1-bedroom units, Round Top is particularly well-suited for individuals or couples.
- A significant 23.5% of listings offer 3+ bedrooms, catering to larger groups and families seeking more space in Round Top.
Round Top Vacation Rental Guest Capacity Trends (2026)
Distribution of Listings by Guest Capacity
Guest Capacity Insights for Round Top
- The most common guest capacity trend in Round Top vacation rentals is listings accommodating 2 guests (32.3%). This suggests the primary traveler segment is likely couples or solo travelers.
- Properties designed for 2 guests and 4 guests dominate the Round Top STR market, accounting for 52.3% of listings.
- 30.3% of properties accommodate 6+ guests, serving the market segment for larger families or group travel in Round Top.
- On average, properties in Round Top are equipped to host 4.1 guests.
Round Top Airbnb Booking Patterns (2026): Available vs. Booked Days
Available Days Distribution
Booked Days Distribution
Booking Pattern Insights for Round Top
- The most common availability pattern in Round Top falls within the 271-366 days range, representing 79.5% of listings. This suggests many properties have significant open periods on their calendars.
- Approximately 98.0% of listings show high availability (181+ days open annually), indicating potential for increased bookings or specific owner usage patterns.
- For booked days, the 31-90 days range is most frequent in Round Top (51.8%), reflecting common guest stay durations or potential owner blocking patterns.
- A notable 2.1% of properties secure long booking periods (181+ days booked per year), highlighting successful long-term rental strategies or significant owner usage.
Round Top Airbnb Minimum Stay Requirements Analysis
Distribution of Listings by Minimum Night Requirement
1 Night
89 listings
45.6% of total
2 Nights
40 listings
20.5% of total
3 Nights
4 listings
2.1% of total
4-6 Nights
1 listings
0.5% of total
7-29 Nights
1 listings
0.5% of total
30+ Nights
60 listings
30.8% of total
Key Insights
- The most prevalent minimum stay requirement in Round Top is 1 Night, adopted by 45.6% of listings. This highlights the market's preference for shorter, flexible bookings.
- A strong majority (66.1%) of the Round Top Airbnb data shows acceptance of very short stays (1-2 nights), indicating a dynamic, high-turnover market.
- A significant segment (30.8%) caters to monthly stays (30+ nights) in Round Top, pointing to opportunities in the extended-stay market.
Recommendations
- Align with the market by considering a 1 Night minimum stay, as 45.6% of Round Top hosts use this setting.
- Explore offering discounts for stays of 30+ nights to attract the 30.8% of the market seeking extended stays.
- Adjust minimum nights based on seasonality – potentially shorter during low season and longer during peak demand periods in Round Top.
Round Top Airbnb Cancellation Policy Trends Analysis (2026)
Super Strict 30 Days
11 listings
5.6% of total
Super Strict 60 Days
23 listings
11.8% of total
Limited
1 listings
0.5% of total
Flexible
12 listings
6.2% of total
Moderate
18 listings
9.2% of total
Firm
106 listings
54.4% of total
Strict
24 listings
12.3% of total
Cancellation Policy Insights for Round Top
- The prevailing Airbnb cancellation policy trend in Round Top is Firm, used by 54.4% of listings.
- A majority (66.7%) of hosts in Round Top utilize Firm or Strict policies, indicating a market where hosts prioritize booking security.
Recommendations for Hosts
- Consider adopting a Firm policy to align with the 54.4% market standard in Round Top.
- Using a Strict policy might deter some guests, as only 12.3% of listings use it. Evaluate if potential revenue protection outweighs possible lower booking rates.
- Regularly review your cancellation policy against competitors and market demand shifts in Round Top.
Round Top STR Booking Lead Time Analysis (2026)
Average Booking Lead Time by Month
Booking Lead Time Insights for Round Top
- The overall average booking lead time for vacation rentals in Round Top is 88 days.
- Guests book furthest in advance for stays during October (average 124 days), likely coinciding with peak travel demand or local events.
- The shortest booking windows occur for stays in June (average 31 days), indicating more last-minute travel plans during this time.
- Seasonally, Spring (93 days avg.) sees the longest lead times, while Summer (37 days avg.) has the shortest, reflecting typical travel planning cycles.
Recommendations for Hosts
- Use the overall average lead time (88 days) as a baseline for your pricing and availability strategy in Round Top.
- For October stays, consider implementing length-of-stay discounts or slightly higher rates for bookings made less than 124 days out to capitalize on advance planning.
- Target marketing efforts for the Spring season well in advance (at least 93 days) to capture early planners.
- Monitor your own booking lead times against these Round Top averages to identify opportunities for dynamic pricing adjustments.
Popular & Essential Airbnb Amenities in Round Top (2026)
Amenity Prevalence
Amenity Insights for Round Top
- Essential amenities in Round Top that guests expect include: Air conditioning, Free parking on premises, Heating, Wifi. Lacking these (any) could significantly impact bookings.
- Popular amenities like Smoke alarm, Essentials, Hair dryer are common but not universal. Offering these can provide a competitive edge.
Recommendations for Hosts
- Ensure your listing includes all essential amenities for Round Top: Air conditioning, Free parking on premises, Heating, Wifi.
- Prioritize adding missing essentials: Air conditioning, Free parking on premises, Heating, Wifi.
- Consider adding popular differentiators like Smoke alarm or Essentials to increase appeal.
- Highlight unique or less common amenities you offer (e.g., hot tub, dedicated workspace, EV charger) in your listing description and photos.
- Regularly check competitor amenities in Round Top to stay competitive.
Round Top Airbnb Guest Demographics & Profile Analysis (2026)
Guest Profile Summary for Round Top
- The typical guest profile for Airbnb in Round Top consists of primarily domestic travelers (99%), often arriving from nearby Houston, typically belonging to the Post-2000s (Gen Z/Alpha) group (50%), primarily speaking English or Spanish.
- Domestic travelers account for 98.5% of guests.
- Key international markets include United States (98.5%) and Australia (0.3%).
- Top languages spoken are English (80.4%) followed by Spanish (11.8%).
- A significant demographic segment is the Post-2000s (Gen Z/Alpha) group, representing 50% of guests.
Recommendations for Hosts
- Target domestic marketing efforts towards travelers from Houston and Austin.
- Tailor amenities and listing descriptions to appeal to the dominant Post-2000s (Gen Z/Alpha) demographic (e.g., highlight fast WiFi, smart home features, local guides).
- Highlight unique local experiences or amenities relevant to the primary guest profile.
- Consider seasonal promotions aligned with peak travel times for key origin markets.
Nearby Short-Term Rental Market Comparison
How does the Round Top Airbnb market stack up against its neighbors? Compare key performance metrics like average monthly revenue, ADR, and occupancy rates in surrounding areas to understand the broader regional STR landscape.
| Market | Active Properties | Monthly Revenue | Daily Rate | Avg. Occupancy |
|---|---|---|---|---|
| Hudson Bend | 59 | $5,436 | $611.45 | 31% |
| Jonestown | 60 | $5,240 | $513.31 | 32% |
| Fairfield | 10 | $4,761 | $360.96 | 42% |
| West Lake Hills | 21 | $4,391 | $656.35 | 34% |
| Volente | 19 | $3,627 | $462.89 | 30% |
| Valley Mills | 25 | $3,329 | $334.75 | 40% |
| Martindale | 39 | $3,223 | $429.47 | 28% |
| Columbus | 17 | $3,218 | $413.88 | 29% |
| Deer Park | 14 | $3,208 | $228.63 | 51% |
| Schulenburg | 25 | $3,157 | $349.06 | 31% |