Rockwall Airbnb Market Analysis 2026: Short Term Rental Data & Vacation Rental Statistics in Texas, United States
Is Airbnb profitable in Rockwall in 2026? Explore comprehensive Airbnb analytics for Rockwall, Texas, United States to uncover income potential. This 2026 STR market report for Rockwall, based on AirROI data from February 2025 to January 2026, reveals key trends in the niche market of 69 active listings.
Whether you're considering an Airbnb investment in Rockwall, optimizing your existing vacation rental, or exploring rental arbitrage opportunities, understanding the Rockwall Airbnb data is crucial. Leveraging the low regulation environment is key to maximizing your short term rental income potential. Let's dive into the specifics.
Key Rockwall Airbnb Performance Metrics Overview
Monthly Airbnb Revenue Variations & Income Potential in Rockwall (2026)
Understanding the monthly revenue variations for Airbnb listings in Rockwall is key to maximizing your short term rental income potential. Seasonality significantly impacts earnings. Our analysis, based on data from the past 12 months, shows that the peak revenue month for STRs in Rockwall is typically October, while February often presents the lowest earnings, highlighting opportunities for strategic pricing adjustments during shoulder and low seasons. Explore the typical Airbnb income in Rockwall across different performance tiers:
- Best-in-class properties (Top 10%) achieve $7,814+ monthly, often utilizing dynamic pricing and superior guest experiences.
- Strong performing properties (Top 25%) earn $5,294 or more, indicating effective management and desirable locations/amenities.
- Typical properties (Median) generate around $3,067 per month, representing the average market performance.
- Entry-level properties (Bottom 25%) see earnings around $1,261, often with potential for optimization.
Average Monthly Airbnb Earnings Trend in Rockwall
Rockwall Airbnb Occupancy Rate Trends (2026)
Maximize your bookings by understanding the Rockwall STR occupancy trends. Seasonal demand shifts significantly influence how often properties are booked. Typically, Junesees the highest demand (peak season occupancy), while January experiences the lowest (low season). Effective strategies, like adjusting minimum stays or offering promotions, can boost occupancy during slower periods. Here's how different property tiers perform in Rockwall:
- Best-in-class properties (Top 10%) achieve 82%+ occupancy, indicating high desirability and potentially optimized availability.
- Strong performing properties (Top 25%) maintain 67% or higher occupancy, suggesting good market fit and guest satisfaction.
- Typical properties (Median) have an occupancy rate around 44%.
- Entry-level properties (Bottom 25%) average 22% occupancy, potentially facing higher vacancy.
Average Monthly Occupancy Rate Trend in Rockwall
Average Daily Rate (ADR) Airbnb Trends in Rockwall (2026)
Effective short term rental pricing strategy in Rockwall involves understanding monthly ADR fluctuations. The Average Daily Rate (ADR) for Airbnb in Rockwall typically peaks in October and dips lowest during February. Leveraging Airbnb dynamic pricing tools or strategies based on this seasonality can significantly boost revenue. Here's a look at the typical nightly rates achieved:
- Best-in-class properties (Top 10%) command rates of $531+ per night, often due to premium features or locations.
- Strong performing properties (Top 25%) achieve nightly rates of $289 or more.
- Typical properties (Median) charge around $218 per night.
- Entry-level properties (Bottom 25%) earn around $137 per night.
Average Daily Rate (ADR) Trend by Month in Rockwall
Get Live Rockwall Market Intelligence 👇

Explore Real-time Analytics
Airbnb Seasonality Analysis & Trends in Rockwall (2026)
Peak Season (October, June, May)
- Revenue averages $4,857 per month
- Occupancy rates average 49.7%
- Daily rates average $270
Shoulder Season
- Revenue averages $3,822 per month
- Occupancy maintains around 45.8%
- Daily rates hold near $261
Low Season (January, February, September)
- Revenue drops to average $3,152 per month
- Occupancy decreases to average 41.2%
- Daily rates adjust to average $255
Seasonality Insights for Rockwall
- The Airbnb seasonality in Rockwall shows moderate seasonality with distinct peak and low periods. While the sections above show seasonal averages, it's also insightful to look at the extremes:
- During the high season, the absolute peak month showcases Rockwall's highest earning potential, with monthly revenues capable of climbing to $5,640, occupancy reaching a high of 50.9%, and ADRs peaking at $288.
- Conversely, the slowest single month of the year, typically falling within the low season, marks the market's lowest point. In this month, revenue might dip to $3,024, occupancy could drop to 37.5%, and ADRs may adjust down to $237.
- Understanding both the seasonal averages and these monthly peaks and troughs in revenue, occupancy, and ADR is crucial for maximizing your Airbnb profit potential in Rockwall.
Seasonal Strategies for Maximizing Profit
- Peak Season: Maximize revenue through premium pricing and potentially longer minimum stays. Ensure high availability.
- Low Season: Offer competitive pricing, special promotions (e.g., extended stay discounts), and flexible cancellation policies. Target off-season travelers like remote workers or budget-conscious guests.
- Shoulder Seasons: Implement dynamic pricing that balances peak and low rates. Target weekend travelers or specific events. Offer slightly more flexible terms than peak season.
- Regularly analyze your own performance against these Rockwall seasonality benchmarks and adjust your pricing and availability strategy accordingly.
Best Areas for Airbnb Investment in Rockwall (2026)
Exploring the top neighborhoods for short-term rentals in Rockwall? This section highlights key areas, outlining why they are attractive for hosts and guests, along with notable local attractions. Consider these locations based on your target guest profile and investment strategy.
| Neighborhood / Area | Why Host Here? (Target Guests & Appeal) | Key Attractions & Landmarks |
|---|---|---|
| Lake Ray Hubbard | Scenic lakeside area offering recreational activities, fishing, and boating. Popular with families and vacationers looking for a relaxing getaway close to nature. | Lake Ray Hubbard, Harbor Bay, Party Cove, East Fork Park, Tawakoni Wildlife Management Area |
| Historic Downtown Rockwall | Charming downtown area with shops, restaurants, and local events. Attracts visitors for its quaint ambiance and community feel, making it a great location for short-term rentals. | Rockwall County Courthouse, Shops on the Square, Rockwall Farmers Market, Old Town, Downtown Park |
| The Shores | Residential community located along Lake Ray Hubbard known for its beautiful homes and friendly environment. Attractive to families and visitors looking for a suburban but close-to-water experience. | The Shores Park, Cypress Lake, Rockwall Golf and Athletic Club |
| Rockwall Harbor | Vibrant area along the lake featuring shops, dining, and entertainment options. Highly appealing for visitors looking for waterfront dining and activities. | Rockwall Harbor District, The Harbor Marina, The Docks at Rockwall Harbor, Various waterfront restaurants |
| North Rockwall | Growing area with new developments and suburban charm. Increasingly popular among families and professionals working in nearby Dallas. | The 18th Hole Golf Course, Rockwall Historic Cemetery, County Parks, Wellness & Recreation Center |
| South Shore | Community offering waterfront views and access to Lake Ray Hubbard. Known for its peaceful environment and recreational options, ideal for those seeking tranquility. | Lakefront Parks, Fishing Spots, Walking Trails, Dining with Lake Views |
| Chandlers Landing | Upscale lakeside community with exclusive amenities and stunning lake views. A desirable location for those looking for luxury accommodations. | Chandlers Landing Marina, Waterfront Mansions, Private Parks, Community Events |
| Ridgeview | Pleasant residential neighborhood with parks and proximity to schools, making it appealing for families. Attractive for long-term stays and educational visits. | Ridgeview Park, Local Schools, Family-Friendly Dining Options, Community Events |
Understanding Airbnb License Requirements & STR Laws in Rockwall (2026)
While Rockwall, Texas, United States currently shows low STR regulations, specific Airbnb license requirements might still exist or change. Always verify the latest short term rental regulations and Airbnb license requirements directly with local government authorities for Rockwall to ensure full compliance before hosting.
(Source: AirROI data, 2026, based on 1% licensed listings)
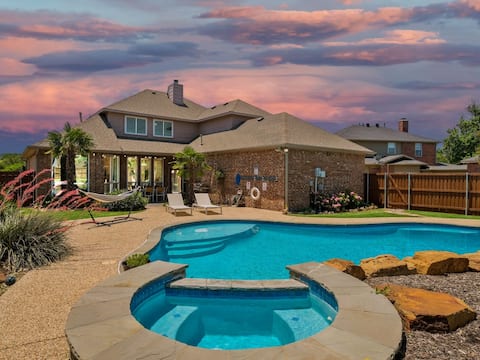
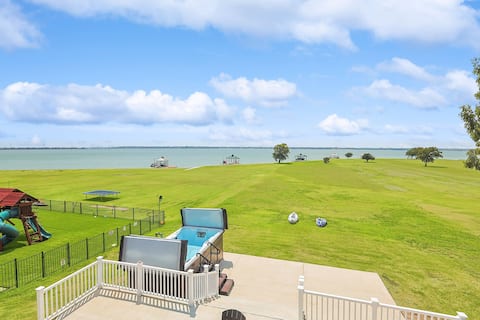
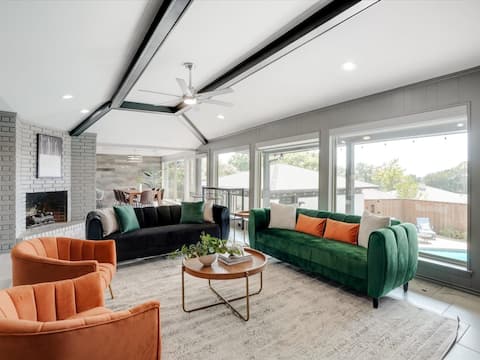
Top Performing Airbnb Properties in Rockwall (2026)
Benchmark your potential! Explore examples of top-performing Airbnb properties in Rockwallbased on Trailing Twelve Month (TTM) revenue. Analyze their characteristics, revenue, occupancy rate, and ADR to understand what drives success in this market.
Southern Charm & Luxury Living - BBQ & Pool
Entire Place • 5 bedrooms

Lakeview Resort Home with Pickleball and Pool
Entire Place • 5 bedrooms

Rockwall Lakehouse - 4600 Sq Ft & 1 acre of fun!
Entire Place • 6 bedrooms
The Best of Lakeside Living - Luxury at its Finest
Entire Place • 5 bedrooms
The Alamo Abode - Lake View, Pool, Newly Renovated
Entire Place • 4 bedrooms

Rockwall Urban Oasis-Pool/Spa/Games/Park/Lakeside
Entire Place • 5 bedrooms
Note: Performance varies based on location, size, amenities, seasonality, and management quality. Data reflects the past 12 months.
Top Performing Airbnb Hosts in Rockwall (2026)
Learn from the best! This table showcases top-performing Airbnb hosts in Rockwall based on the number of properties managed and estimated total revenue over the past year. Analyze their scale and performance metrics.
| Host Name | Properties | Grossing Revenue | Stay Reviews | Avg Rating |
|---|---|---|---|---|
| Roxanne | 2 | $176,592 | 268 | 4.95/5.0 |
| Tal | 1 | $145,430 | 67 | 4.87/5.0 |
| Laurie Ann | 3 | $128,987 | 298 | 4.94/5.0 |
| Taylor | 1 | $128,719 | 35 | 4.97/5.0 |
| Matt | 1 | $127,114 | 217 | 4.83/5.0 |
| Goldnest | 1 | $117,500 | 24 | 4.79/5.0 |
| Marina | 1 | $116,768 | 44 | 4.52/5.0 |
| Joy | 1 | $71,097 | 208 | 4.90/5.0 |
| Laura | 1 | $70,358 | 113 | 4.91/5.0 |
| Song | 1 | $63,679 | 37 | 4.92/5.0 |
Analyzing the strategies of top hosts, such as their property selection, pricing, and guest communication, can offer valuable lessons for optimizing your own Airbnb operations in Rockwall.
Dive Deeper: Advanced Rockwall STR Market Data (2026)
Ready to unlock more insights? AirROI provides access to advanced metrics and comprehensive Airbnb data for Rockwall. Explore detailed analytics beyond this report to refine your investment strategy, optimize pricing, and maximize your vacation rental profits.
Explore Advanced MetricsRockwall Short-Term Rental Market Composition (2026): Property & Room Types
Room Type Distribution
Property Type Distribution
Market Composition Insights for Rockwall
- The Rockwall Airbnb market composition is heavily skewed towards Entire Home/Apt listings, which make up 85.5% of the 69 active rentals. This indicates strong guest preference for privacy and space.
- Looking at the property type distribution in Rockwall, House properties are the most common (89.9%), reflecting the local real estate landscape.
- Houses represent a significant 89.9% portion, catering likely to families or larger groups.
- Smaller segments like apartment/condo, hotel/boutique, others, unique stays (combined 10.0%) offer potential for unique stay experiences.
Rockwall Airbnb Room Capacity Analysis (2026): Bedroom Distribution
Distribution of Listings by Number of Bedrooms
Room Capacity Insights for Rockwall
- The dominant room capacity in Rockwall is 3 bedrooms listings, making up 43.5% of the market. This suggests a strong demand for properties suitable for families or small groups.
- Together, 3 bedrooms and 4 bedrooms properties represent 59.4% of the active Airbnb listings in Rockwall, indicating a high concentration in these sizes.
- A significant 73.9% of listings offer 3+ bedrooms, catering to larger groups and families seeking more space in Rockwall.
Rockwall Vacation Rental Guest Capacity Trends (2026)
Distribution of Listings by Guest Capacity
Guest Capacity Insights for Rockwall
- The most common guest capacity trend in Rockwall vacation rentals is listings accommodating 8+ guests (46.4%). This suggests the primary traveler segment is likely larger groups.
- Properties designed for 8+ guests and 6 guests dominate the Rockwall STR market, accounting for 66.7% of listings.
- 72.5% of properties accommodate 6+ guests, serving the market segment for larger families or group travel in Rockwall.
- On average, properties in Rockwall are equipped to host 5.8 guests.
Rockwall Airbnb Booking Patterns (2026): Available vs. Booked Days
Available Days Distribution
Booked Days Distribution
Booking Pattern Insights for Rockwall
- The most common availability pattern in Rockwall falls within the 271-366 days range, representing 42% of listings. This suggests many properties have significant open periods on their calendars.
- Approximately 72.4% of listings show high availability (181+ days open annually), indicating potential for increased bookings or specific owner usage patterns.
- For booked days, the 91-180 days range is most frequent in Rockwall (31.9%), reflecting common guest stay durations or potential owner blocking patterns.
- A notable 27.5% of properties secure long booking periods (181+ days booked per year), highlighting successful long-term rental strategies or significant owner usage.
Rockwall Airbnb Minimum Stay Requirements Analysis
Distribution of Listings by Minimum Night Requirement
1 Night
11 listings
15.9% of total
2 Nights
21 listings
30.4% of total
4-6 Nights
1 listings
1.4% of total
7-29 Nights
11 listings
15.9% of total
30+ Nights
25 listings
36.2% of total
Key Insights
- The most prevalent minimum stay requirement in Rockwall is 30+ Nights, adopted by 36.2% of listings. This highlights the market's preference for longer commitments.
- A significant segment (36.2%) caters to monthly stays (30+ nights) in Rockwall, pointing to opportunities in the extended-stay market.
Recommendations
- Align with the market by considering a 30+ Nights minimum stay, as 36.2% of Rockwall hosts use this setting.
- If feasible, allowing 1-night stays, especially midweek or during low season, could capture last-minute bookings, as only 15.9% currently do.
- A 2-night minimum appears standard (30.4%). Consider this for weekends or peak periods.
- Explore offering discounts for stays of 30+ nights to attract the 36.2% of the market seeking extended stays.
- Adjust minimum nights based on seasonality – potentially shorter during low season and longer during peak demand periods in Rockwall.
Rockwall Airbnb Cancellation Policy Trends Analysis (2026)
Super Strict 30 Days
2 listings
2.9% of total
Flexible
16 listings
23.5% of total
Moderate
14 listings
20.6% of total
Firm
27 listings
39.7% of total
Strict
9 listings
13.2% of total
Cancellation Policy Insights for Rockwall
- The prevailing Airbnb cancellation policy trend in Rockwall is Firm, used by 39.7% of listings.
- A majority (52.9%) of hosts in Rockwall utilize Firm or Strict policies, indicating a market where hosts prioritize booking security.
Recommendations for Hosts
- Consider adopting a Firm policy to align with the 39.7% market standard in Rockwall.
- Using a Strict policy might deter some guests, as only 13.2% of listings use it. Evaluate if potential revenue protection outweighs possible lower booking rates.
- Regularly review your cancellation policy against competitors and market demand shifts in Rockwall.
Rockwall STR Booking Lead Time Analysis (2026)
Average Booking Lead Time by Month
Booking Lead Time Insights for Rockwall
- The overall average booking lead time for vacation rentals in Rockwall is 37 days.
- Guests book furthest in advance for stays during December (average 60 days), likely coinciding with peak travel demand or local events.
- The shortest booking windows occur for stays in February (average 20 days), indicating more last-minute travel plans during this time.
- Seasonally, Fall (45 days avg.) sees the longest lead times, while Summer (28 days avg.) has the shortest, reflecting typical travel planning cycles.
Recommendations for Hosts
- Use the overall average lead time (37 days) as a baseline for your pricing and availability strategy in Rockwall.
- For December stays, consider implementing length-of-stay discounts or slightly higher rates for bookings made less than 60 days out to capitalize on advance planning.
- Target marketing efforts for the Fall season well in advance (at least 45 days) to capture early planners.
- Monitor your own booking lead times against these Rockwall averages to identify opportunities for dynamic pricing adjustments.
Popular & Essential Airbnb Amenities in Rockwall (2026)
Amenity Prevalence
Amenity Insights for Rockwall
- Essential amenities in Rockwall that guests expect include: Wifi, Air conditioning, Free parking on premises, Heating, Smoke alarm, TV. Lacking these (any) could significantly impact bookings.
- Popular amenities like Washer, Hot water, Kitchen are common but not universal. Offering these can provide a competitive edge.
Recommendations for Hosts
- Ensure your listing includes all essential amenities for Rockwall: Wifi, Air conditioning, Free parking on premises, Heating, Smoke alarm, TV.
- Prioritize adding missing essentials: Free parking on premises, Heating, Smoke alarm, TV.
- Consider adding popular differentiators like Washer or Hot water to increase appeal.
- Highlight unique or less common amenities you offer (e.g., hot tub, dedicated workspace, EV charger) in your listing description and photos.
- Regularly check competitor amenities in Rockwall to stay competitive.
Rockwall Airbnb Guest Demographics & Profile Analysis (2026)
Guest Profile Summary for Rockwall
- The typical guest profile for Airbnb in Rockwall consists of primarily domestic travelers (98%), often arriving from nearby Rockwall, typically belonging to the Post-2000s (Gen Z/Alpha) group (50%), primarily speaking English or Spanish.
- Domestic travelers account for 97.7% of guests.
- Key international markets include United States (97.7%) and Australia (0.5%).
- Top languages spoken are English (72.9%) followed by Spanish (16.9%).
- A significant demographic segment is the Post-2000s (Gen Z/Alpha) group, representing 50% of guests.
Recommendations for Hosts
- Target domestic marketing efforts towards travelers from Rockwall and Dallas.
- Tailor amenities and listing descriptions to appeal to the dominant Post-2000s (Gen Z/Alpha) demographic (e.g., highlight fast WiFi, smart home features, local guides).
- Highlight unique local experiences or amenities relevant to the primary guest profile.
- Consider seasonal promotions aligned with peak travel times for key origin markets.
Nearby Short-Term Rental Market Comparison
How does the Rockwall Airbnb market stack up against its neighbors? Compare key performance metrics like average monthly revenue, ADR, and occupancy rates in surrounding areas to understand the broader regional STR landscape.
| Market | Active Properties | Monthly Revenue | Daily Rate | Avg. Occupancy |
|---|---|---|---|---|
| Star Harbor | 11 | $5,474 | $741.72 | 33% |
| Valley View | 25 | $5,111 | $484.73 | 39% |
| Bluff Dale | 18 | $4,063 | $411.68 | 29% |
| Red Oak | 17 | $3,978 | $288.35 | 50% |
| DeSoto | 29 | $3,947 | $332.58 | 47% |
| Holly Lake Ranch | 11 | $3,836 | $358.93 | 36% |
| Flower Mound | 79 | $3,760 | $326.24 | 45% |
| Azle | 62 | $3,533 | $323.80 | 41% |
| Westworth Village | 11 | $3,530 | $240.30 | 48% |
| Highland Village | 15 | $3,363 | $345.42 | 48% |