Porter Airbnb Market Analysis 2025: Short Term Rental Data & Vacation Rental Statistics in Texas, United States
Is Airbnb profitable in Porter in 2025? Explore comprehensive Airbnb analytics for Porter, Texas, United States to uncover income potential. This 2025 STR market report for Porter, based on AirROI data from September 2024 to August 2025, reveals key trends in the niche market of 20 active listings.
Whether you're considering an Airbnb investment in Porter, optimizing your existing vacation rental, or exploring rental arbitrage opportunities, understanding the Porter Airbnb data is crucial. Leveraging the low regulation environment is key to maximizing your short term rental income potential. Let's dive into the specifics.
Key Porter Airbnb Performance Metrics Overview
Monthly Airbnb Revenue Variations & Income Potential in Porter (2025)
Understanding the monthly revenue variations for Airbnb listings in Porter is key to maximizing your short term rental income potential. Seasonality significantly impacts earnings. Our analysis, based on data from the past 12 months, shows that the peak revenue month for STRs in Porter is typically November, while October often presents the lowest earnings, highlighting opportunities for strategic pricing adjustments during shoulder and low seasons. Explore the typical Airbnb income in Porter across different performance tiers:
- Best-in-class properties (Top 10%) achieve $4,630+ monthly, often utilizing dynamic pricing and superior guest experiences.
- Strong performing properties (Top 25%) earn $3,394 or more, indicating effective management and desirable locations/amenities.
- Typical properties (Median) generate around $1,627 per month, representing the average market performance.
- Entry-level properties (Bottom 25%) see earnings around $776, often with potential for optimization.
Average Monthly Airbnb Earnings Trend in Porter
Porter Airbnb Occupancy Rate Trends (2025)
Maximize your bookings by understanding the Porter STR occupancy trends. Seasonal demand shifts significantly influence how often properties are booked. Typically, Novembersees the highest demand (peak season occupancy), while July experiences the lowest (low season). Effective strategies, like adjusting minimum stays or offering promotions, can boost occupancy during slower periods. Here's how different property tiers perform in Porter:
- Best-in-class properties (Top 10%) achieve 79%+ occupancy, indicating high desirability and potentially optimized availability.
- Strong performing properties (Top 25%) maintain 67% or higher occupancy, suggesting good market fit and guest satisfaction.
- Typical properties (Median) have an occupancy rate around 48%.
- Entry-level properties (Bottom 25%) average 26% occupancy, potentially facing higher vacancy.
Average Monthly Occupancy Rate Trend in Porter
Average Daily Rate (ADR) Airbnb Trends in Porter (2025)
Effective short term rental pricing strategy in Porter involves understanding monthly ADR fluctuations. The Average Daily Rate (ADR) for Airbnb in Porter typically peaks in June and dips lowest during February. Leveraging Airbnb dynamic pricing tools or strategies based on this seasonality can significantly boost revenue. Here's a look at the typical nightly rates achieved:
- Best-in-class properties (Top 10%) command rates of $311+ per night, often due to premium features or locations.
- Strong performing properties (Top 25%) achieve nightly rates of $215 or more.
- Typical properties (Median) charge around $139 per night.
- Entry-level properties (Bottom 25%) earn around $62 per night.
Average Daily Rate (ADR) Trend by Month in Porter
Get Live Porter Market Intelligence 👇

Explore Real-time Analytics
Airbnb Seasonality Analysis & Trends in Porter (2025)
Peak Season (November, June, July)
- Revenue averages $3,988 per month
- Occupancy rates average 49.0%
- Daily rates average $195
Shoulder Season
- Revenue averages $3,425 per month
- Occupancy maintains around 47.7%
- Daily rates hold near $180
Low Season (February, September, October)
- Revenue drops to average $2,520 per month
- Occupancy decreases to average 47.5%
- Daily rates adjust to average $168
Seasonality Insights for Porter
- The Airbnb seasonality in Porter shows moderate seasonality with distinct peak and low periods. While the sections above show seasonal averages, it's also insightful to look at the extremes:
- During the high season, the absolute peak month showcases Porter's highest earning potential, with monthly revenues capable of climbing to $4,012, occupancy reaching a high of 55.7%, and ADRs peaking at $210.
- Conversely, the slowest single month of the year, typically falling within the low season, marks the market's lowest point. In this month, revenue might dip to $2,347, occupancy could drop to 40.7%, and ADRs may adjust down to $163.
- Understanding both the seasonal averages and these monthly peaks and troughs in revenue, occupancy, and ADR is crucial for maximizing your Airbnb profit potential in Porter.
Seasonal Strategies for Maximizing Profit
- Peak Season: Maximize revenue through premium pricing and potentially longer minimum stays. Ensure high availability.
- Low Season: Offer competitive pricing, special promotions (e.g., extended stay discounts), and flexible cancellation policies. Target off-season travelers like remote workers or budget-conscious guests.
- Shoulder Seasons: Implement dynamic pricing that balances peak and low rates. Target weekend travelers or specific events. Offer slightly more flexible terms than peak season.
- Regularly analyze your own performance against these Porter seasonality benchmarks and adjust your pricing and availability strategy accordingly.
Best Areas for Airbnb Investment in Porter (2025)
Exploring the top neighborhoods for short-term rentals in Porter? This section highlights key areas, outlining why they are attractive for hosts and guests, along with notable local attractions. Consider these locations based on your target guest profile and investment strategy.
| Neighborhood / Area | Why Host Here? (Target Guests & Appeal) | Key Attractions & Landmarks |
|---|---|---|
| Porter Town Center | A central hub with shopping, dining, and entertainment options. Ideal for families and travelers looking for convenience and access to local attractions. | Porter Town Center, Galleria at Houston, The Woodlands Mall, Lake Livingston State Park, Humble Museum |
| Kingwood | Known as the "Livable Forest", this community offers beautiful parks and nature trails. Great for nature lovers and those seeking a tranquil escape. | Kingwood Park, East End Park, River Grove Park, Lake Houston, Kingwood Green |
| New Caney | An up-and-coming area with a growing number of visitors to nearby attractions like the Grand Texas Theme Park. A good choice for families. | Grand Texas, Big Rivers Waterpark, Carter Park, Lake Livingston State Park, New Caney High School Football games |
| Humble | A vibrant suburban area with diverse dining and shopping, within easy reach of Houston and attractions. A family-friendly option. | Humble Civic Center, Deerbrook Mall, Old MacDonald's Farm, Humble Museum |
| Atascocita | A suburban area with access to Lake Houston and family-friendly parks. Ideal for those looking for outdoor activities. | Walden on Lake Houston, Atascocita Park, Humble ISD Sports Complex, Lake Houston |
| The Woodlands | A master-planned community known for its luxury and nature integration. Offers upscale dining, shopping, and outdoor activities, making it a popular destination. | The Woodlands Mall, Market Street, Cynthia Woods Mitchell Pavilion, George Mitchell Nature Preserve |
| Crosby | A more rural area with charm and affordability. Good for those looking for a quieter experience away from urban bustle. | Lake Livingston, Crosby Historical Society, Crosby Park |
| Summerwood | A suburban area adjacent to Lake Houston, offering family-friendly amenities and quick access to Houston. Ideal for those seeking community and convenience. | Summerwood Park, Lake Houston, Estates at Summerwood Clubhouse |
Understanding Airbnb License Requirements & STR Laws in Porter (2025)
While Porter, Texas, United States currently shows low STR regulations, specific Airbnb license requirements might still exist or change. Always verify the latest short term rental regulations and Airbnb license requirements directly with local government authorities for Porter to ensure full compliance before hosting.
(Source: AirROI data, 2025, finding no licensed listings among those analyzed)
Top Performing Airbnb Properties in Porter (2025)
Benchmark your potential! Explore examples of top-performing Airbnb properties in Porterbased on Trailing Twelve Month (TTM) revenue. Analyze their characteristics, revenue, occupancy rate, and ADR to understand what drives success in this market.

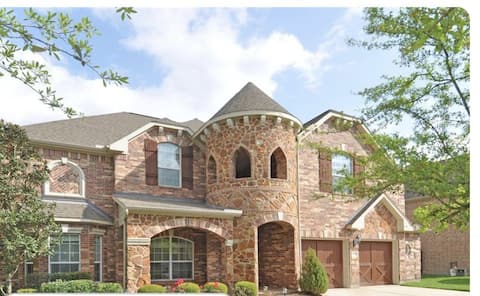
Luxury Oasis Retreat in Houston
Entire Place • 6 bedrooms
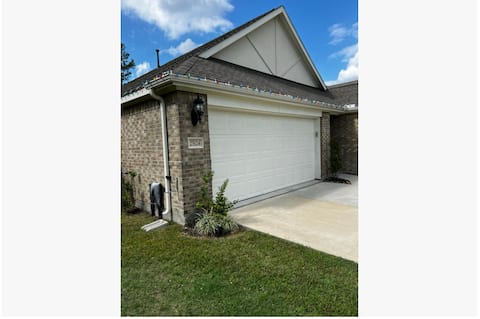
Home Oasis, near IAH airport
Entire Place • 3 bedrooms
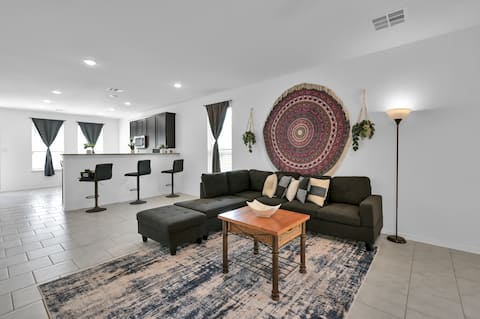
Spacious new home close to IAH!
Entire Place • 2 bedrooms
Beautiful 5 bdrm New Build in Central Location
Entire Place • 5 bedrooms

Porter Heights Retreat,
Entire Place • 5 bedrooms

King Bed Spacious Apt Modern Design near Kingwood
Entire Place • 2 bedrooms
Note: Performance varies based on location, size, amenities, seasonality, and management quality. Data reflects the past 12 months.
Top Performing Airbnb Hosts in Porter (2025)
Learn from the best! This table showcases top-performing Airbnb hosts in Porter based on the number of properties managed and estimated total revenue over the past year. Analyze their scale and performance metrics.
| Host Name | Properties | Grossing Revenue | Stay Reviews | Avg Rating |
|---|---|---|---|---|
| Brock | 1 | $247,792 | 62 | 4.89/5.0 |
| Christopher | 1 | $47,108 | 44 | 4.75/5.0 |
| Juan | 1 | $33,721 | 40 | 4.75/5.0 |
| Collins | 1 | $33,154 | 76 | 4.68/5.0 |
| Agustin | 1 | $30,629 | 31 | 4.90/5.0 |
| Danny | 1 | $20,916 | 73 | 4.95/5.0 |
| Susana | 1 | $20,274 | 52 | 4.90/5.0 |
| Ruth | 1 | $16,753 | 6 | 4.83/5.0 |
| Alain | 1 | $14,611 | 54 | 4.94/5.0 |
| Ludith | 1 | $13,979 | 14 | 5.00/5.0 |
Analyzing the strategies of top hosts, such as their property selection, pricing, and guest communication, can offer valuable lessons for optimizing your own Airbnb operations in Porter.
Dive Deeper: Advanced Porter STR Market Data (2025)
Ready to unlock more insights? AirROI provides access to advanced metrics and comprehensive Airbnb data for Porter. Explore detailed analytics beyond this report to refine your investment strategy, optimize pricing, and maximize your vacation rental profits.
Explore Advanced MetricsPorter Short-Term Rental Market Composition (2025): Property & Room Types
Room Type Distribution
Property Type Distribution
Market Composition Insights for Porter
- The Porter Airbnb market composition is heavily skewed towards Entire Home/Apt listings, which make up 70% of the 20 active rentals. This indicates strong guest preference for privacy and space.
- Looking at the property type distribution in Porter, House properties are the most common (95%), reflecting the local real estate landscape.
- Houses represent a significant 95% portion, catering likely to families or larger groups.
Porter Airbnb Room Capacity Analysis (2025): Bedroom Distribution
Distribution of Listings by Number of Bedrooms
Room Capacity Insights for Porter
- The dominant room capacity in Porter is 5+ bedrooms listings, making up 25% of the market. This suggests a strong demand for properties suitable for families or small groups.
- Together, 5+ bedrooms and 3 bedrooms properties represent 45.0% of the active Airbnb listings in Porter, indicating a high concentration in these sizes.
- A significant 50.0% of listings offer 3+ bedrooms, catering to larger groups and families seeking more space in Porter.
Porter Vacation Rental Guest Capacity Trends (2025)
Distribution of Listings by Guest Capacity
Guest Capacity Insights for Porter
- The most common guest capacity trend in Porter vacation rentals is listings accommodating 6 guests (30%). This suggests the primary traveler segment is likely larger groups.
- Properties designed for 6 guests and 8+ guests dominate the Porter STR market, accounting for 55.0% of listings.
- 55.0% of properties accommodate 6+ guests, serving the market segment for larger families or group travel in Porter.
- On average, properties in Porter are equipped to host 4.5 guests.
Porter Airbnb Booking Patterns (2025): Available vs. Booked Days
Available Days Distribution
Booked Days Distribution
Booking Pattern Insights for Porter
- The most common availability pattern in Porter falls within the 271-366 days range, representing 45% of listings. This suggests many properties have significant open periods on their calendars.
- Approximately 75.0% of listings show high availability (181+ days open annually), indicating potential for increased bookings or specific owner usage patterns.
- For booked days, the 31-90 days range is most frequent in Porter (40%), reflecting common guest stay durations or potential owner blocking patterns.
- A notable 25.0% of properties secure long booking periods (181+ days booked per year), highlighting successful long-term rental strategies or significant owner usage.
Porter Airbnb Minimum Stay Requirements Analysis
Distribution of Listings by Minimum Night Requirement
1 Night
8 listings
42.1% of total
2 Nights
6 listings
31.6% of total
3 Nights
1 listings
5.3% of total
30+ Nights
4 listings
21.1% of total
Key Insights
- The most prevalent minimum stay requirement in Porter is 1 Night, adopted by 42.1% of listings. This highlights the market's preference for shorter, flexible bookings.
- A strong majority (73.7%) of the Porter Airbnb data shows acceptance of very short stays (1-2 nights), indicating a dynamic, high-turnover market.
- A significant segment (21.1%) caters to monthly stays (30+ nights) in Porter, pointing to opportunities in the extended-stay market.
Recommendations
- Align with the market by considering a 1 Night minimum stay, as 42.1% of Porter hosts use this setting.
- Explore offering discounts for stays of 30+ nights to attract the 21.1% of the market seeking extended stays.
- Adjust minimum nights based on seasonality – potentially shorter during low season and longer during peak demand periods in Porter.
Porter Airbnb Cancellation Policy Trends Analysis (2025)
Super Strict 30 Days
1 listings
5.3% of total
Flexible
7 listings
36.8% of total
Moderate
7 listings
36.8% of total
Firm
1 listings
5.3% of total
Strict
3 listings
15.8% of total
Cancellation Policy Insights for Porter
- The prevailing Airbnb cancellation policy trend in Porter is Flexible, used by 36.8% of listings.
- The market strongly favors guest-friendly terms, with 73.6% of listings offering Flexible or Moderate policies. This suggests guests in Porter may expect booking flexibility.
Recommendations for Hosts
- Consider adopting a Flexible policy to align with the 36.8% market standard in Porter.
- Regularly review your cancellation policy against competitors and market demand shifts in Porter.
Porter STR Booking Lead Time Analysis (2025)
Average Booking Lead Time by Month
Booking Lead Time Insights for Porter
- The overall average booking lead time for vacation rentals in Porter is 19 days.
- Guests book furthest in advance for stays during January (average 33 days), likely coinciding with peak travel demand or local events.
- The shortest booking windows occur for stays in February (average 11 days), indicating more last-minute travel plans during this time.
- Seasonally, Fall (28 days avg.) sees the longest lead times, while Winter (20 days avg.) has the shortest, reflecting typical travel planning cycles.
Recommendations for Hosts
- Use the overall average lead time (19 days) as a baseline for your pricing and availability strategy in Porter.
- For January stays, consider implementing length-of-stay discounts or slightly higher rates for bookings made less than 33 days out to capitalize on advance planning.
- During February, focus on last-minute booking availability and promotions, as guests book with very short notice (11 days avg.).
- Target marketing efforts for the Fall season well in advance (at least 28 days) to capture early planners.
- Monitor your own booking lead times against these Porter averages to identify opportunities for dynamic pricing adjustments.
Popular & Essential Airbnb Amenities in Porter (2025)
Amenity Prevalence
Amenity Insights for Porter
- Essential amenities in Porter that guests expect include: Wifi, TV, Air conditioning, Free parking on premises, Smoke alarm. Lacking these (any) could significantly impact bookings.
- Popular amenities like Hot water, Kitchen, Washer are common but not universal. Offering these can provide a competitive edge.
Recommendations for Hosts
- Ensure your listing includes all essential amenities for Porter: Wifi, TV, Air conditioning, Free parking on premises, Smoke alarm.
- Prioritize adding missing essentials: Smoke alarm.
- Consider adding popular differentiators like Hot water or Kitchen to increase appeal.
- Highlight unique or less common amenities you offer (e.g., hot tub, dedicated workspace, EV charger) in your listing description and photos.
- Regularly check competitor amenities in Porter to stay competitive.
Porter Airbnb Guest Demographics & Profile Analysis (2025)
Guest Profile Summary for Porter
- The typical guest profile for Airbnb in Porter consists of primarily domestic travelers (95%), often arriving from nearby Houston, typically belonging to the Post-2000s (Gen Z/Alpha) group (50%), primarily speaking English or Spanish.
- Domestic travelers account for 95.3% of guests.
- Key international markets include United States (95.3%) and Mexico (2%).
- Top languages spoken are English (69.4%) followed by Spanish (21.8%).
- A significant demographic segment is the Post-2000s (Gen Z/Alpha) group, representing 50% of guests.
Recommendations for Hosts
- Target domestic marketing efforts towards travelers from Houston and San Antonio.
- Tailor amenities and listing descriptions to appeal to the dominant Post-2000s (Gen Z/Alpha) demographic (e.g., highlight fast WiFi, smart home features, local guides).
- Highlight unique local experiences or amenities relevant to the primary guest profile.
- Consider seasonal promotions aligned with peak travel times for key origin markets.
Nearby Short-Term Rental Market Comparison
How does the Porter Airbnb market stack up against its neighbors? Compare key performance metrics like average monthly revenue, ADR, and occupancy rates in surrounding areas to understand the broader regional STR landscape.
| Market | Active Properties | Monthly Revenue | Daily Rate | Avg. Occupancy |
|---|---|---|---|---|
| Fairfield | 11 | $4,291 | $346.56 | 46% |
| Jamaica Beach | 191 | $3,767 | $381.07 | 37% |
| Crystal Beach | 148 | $3,495 | $385.21 | 33% |
| Bolivar Peninsula | 823 | $3,266 | $383.54 | 33% |
| Columbus | 19 | $3,224 | $394.41 | 30% |
| Friendswood | 31 | $3,165 | $247.74 | 48% |
| Streetman | 21 | $3,120 | $335.83 | 35% |
| Franklin | 11 | $3,096 | $297.49 | 42% |
| Weimar | 14 | $2,803 | $255.90 | 38% |
| Chappell Hill | 11 | $2,785 | $509.47 | 29% |