Port Mansfield Airbnb Market Analysis 2026: Short Term Rental Data & Vacation Rental Statistics in Texas, United States
Is Airbnb profitable in Port Mansfield in 2026? Explore comprehensive Airbnb analytics for Port Mansfield, Texas, United States to uncover income potential. This 2026 STR market report for Port Mansfield, based on AirROI data from February 2025 to January 2026, reveals key trends in the niche market of 29 active listings.
Whether you're considering an Airbnb investment in Port Mansfield, optimizing your existing vacation rental, or exploring rental arbitrage opportunities, understanding the Port Mansfield Airbnb data is crucial. Leveraging the low regulation environment is key to maximizing your short term rental income potential. Let's dive into the specifics.
Key Port Mansfield Airbnb Performance Metrics Overview
Monthly Airbnb Revenue Variations & Income Potential in Port Mansfield (2026)
Understanding the monthly revenue variations for Airbnb listings in Port Mansfield is key to maximizing your short term rental income potential. Seasonality significantly impacts earnings. Our analysis, based on data from the past 12 months, shows that the peak revenue month for STRs in Port Mansfield is typically June, while April often presents the lowest earnings, highlighting opportunities for strategic pricing adjustments during shoulder and low seasons. Explore the typical Airbnb income in Port Mansfield across different performance tiers:
- Best-in-class properties (Top 10%) achieve $6,800+ monthly, often utilizing dynamic pricing and superior guest experiences.
- Strong performing properties (Top 25%) earn $4,408 or more, indicating effective management and desirable locations/amenities.
- Typical properties (Median) generate around $2,697 per month, representing the average market performance.
- Entry-level properties (Bottom 25%) see earnings around $1,318, often with potential for optimization.
Average Monthly Airbnb Earnings Trend in Port Mansfield
Port Mansfield Airbnb Occupancy Rate Trends (2026)
Maximize your bookings by understanding the Port Mansfield STR occupancy trends. Seasonal demand shifts significantly influence how often properties are booked. Typically, Julysees the highest demand (peak season occupancy), while April experiences the lowest (low season). Effective strategies, like adjusting minimum stays or offering promotions, can boost occupancy during slower periods. Here's how different property tiers perform in Port Mansfield:
- Best-in-class properties (Top 10%) achieve 66%+ occupancy, indicating high desirability and potentially optimized availability.
- Strong performing properties (Top 25%) maintain 47% or higher occupancy, suggesting good market fit and guest satisfaction.
- Typical properties (Median) have an occupancy rate around 28%.
- Entry-level properties (Bottom 25%) average 16% occupancy, potentially facing higher vacancy.
Average Monthly Occupancy Rate Trend in Port Mansfield
Average Daily Rate (ADR) Airbnb Trends in Port Mansfield (2026)
Effective short term rental pricing strategy in Port Mansfield involves understanding monthly ADR fluctuations. The Average Daily Rate (ADR) for Airbnb in Port Mansfield typically peaks in September and dips lowest during February. Leveraging Airbnb dynamic pricing tools or strategies based on this seasonality can significantly boost revenue. Here's a look at the typical nightly rates achieved:
- Best-in-class properties (Top 10%) command rates of $475+ per night, often due to premium features or locations.
- Strong performing properties (Top 25%) achieve nightly rates of $413 or more.
- Typical properties (Median) charge around $264 per night.
- Entry-level properties (Bottom 25%) earn around $189 per night.
Average Daily Rate (ADR) Trend by Month in Port Mansfield
Get Live Port Mansfield Market Intelligence 👇

Explore Real-time Analytics
Airbnb Seasonality Analysis & Trends in Port Mansfield (2026)
Peak Season (June, October, July)
- Revenue averages $5,370 per month
- Occupancy rates average 39.6%
- Daily rates average $361
Shoulder Season
- Revenue averages $3,737 per month
- Occupancy maintains around 33.2%
- Daily rates hold near $354
Low Season (January, April, December)
- Revenue drops to average $2,426 per month
- Occupancy decreases to average 27.0%
- Daily rates adjust to average $350
Seasonality Insights for Port Mansfield
- The Airbnb seasonality in Port Mansfield shows highly seasonal trends requiring careful strategy. While the sections above show seasonal averages, it's also insightful to look at the extremes:
- During the high season, the absolute peak month showcases Port Mansfield's highest earning potential, with monthly revenues capable of climbing to $5,521, occupancy reaching a high of 42.7%, and ADRs peaking at $372.
- Conversely, the slowest single month of the year, typically falling within the low season, marks the market's lowest point. In this month, revenue might dip to $2,314, occupancy could drop to 26.5%, and ADRs may adjust down to $343.
- Understanding both the seasonal averages and these monthly peaks and troughs in revenue, occupancy, and ADR is crucial for maximizing your Airbnb profit potential in Port Mansfield.
Seasonal Strategies for Maximizing Profit
- Peak Season: Maximize revenue through premium pricing and potentially longer minimum stays. Ensure high availability.
- Low Season: Offer competitive pricing, special promotions (e.g., extended stay discounts), and flexible cancellation policies. Target off-season travelers like remote workers or budget-conscious guests.
- Shoulder Seasons: Implement dynamic pricing that balances peak and low rates. Target weekend travelers or specific events. Offer slightly more flexible terms than peak season.
- Regularly analyze your own performance against these Port Mansfield seasonality benchmarks and adjust your pricing and availability strategy accordingly.
Best Areas for Airbnb Investment in Port Mansfield (2026)
Exploring the top neighborhoods for short-term rentals in Port Mansfield? This section highlights key areas, outlining why they are attractive for hosts and guests, along with notable local attractions. Consider these locations based on your target guest profile and investment strategy.
| Neighborhood / Area | Why Host Here? (Target Guests & Appeal) | Key Attractions & Landmarks |
|---|---|---|
| Port Mansfield Harbor | Located on the Texas Gulf Coast, this area is ideal for fishing enthusiasts and families looking for leisure activities. Its beautiful waterfront and access to fishing spots make it a prime Airbnb investment location. | Fishing in the Laguna Madre, Port Mansfield Marina, Birdwatching in the area, Accessibility to the Gulf of Mexico, Beautiful sandy beaches |
| South Padre Island | A popular tourist destination known for its beautiful beaches, water sports, and vibrant nightlife. This area attracts a heavy flow of tourists year-round, making it highly lucrative for Airbnb hosts. | South Padre Island Beach, Sea Turtle, Inc., Schlitterbahn Waterpark, Dolphin Watch Tours, Laguna Madre Nature Trail |
| Laguna Vista | A charming town adjacent to the Laguna Madre Bay, perfect for families and groups seeking a quiet getaway. Offers stunning views and easy access to outdoor activities, making it appealing for Airbnb guests. | Laguna Vista Golf Course, Birding at the Laguna Atascosa National Wildlife Refuge, Proximity to South Padre Island, Natural Parks and Reserves |
| Brownsville | A larger city with a mix of cultural attractions, shopping, and dining. It offers a different experience compared to coastal areas and can cater to travelers seeking urban amenities. | Gladys Porter Zoo, Historic Brownsville Museum, Children's Museum of Brownsville, Revitalize Downtown Brownsville |
| Harlingen | This city provides access to various regional attractions and has a growing number of visitors. Harlingen’s proximity to beaches and attractions makes it a potential spot for investment. | Harlingen Arts & Heritage Museum, Valley International Airport, Shopping at Valle Vista Mall, Nearby South Texas attractions |
| Los Fresnos | A small town with a laid-back atmosphere that is perfect for those looking to escape the hustle and bustle. Close to nature and rural attractions, ideal for nature lovers. | Los Fresnos High School Football Games, Proximity to nature trails, Small-town charm and community events |
| Port Isabel | A small coastal city with stunning bay views and proximity to South Padre Island. It attracts visitors looking for a quieter, more authentic beach experience. | Port Isabel Lighthouse, Dolphin Research and Sea Life Nature Center, Laguna Madre, Fishing Piers |
| Rio Hondo | A quiet area located inland, close to the coast but away from the tourist crowd. Great for those looking for a peaceful retreat with easy access to larger cities and attractions. | Rio Hondo Historical Museum, Proximity to hunting and fishing locations, Nature trails and activities |
Understanding Airbnb License Requirements & STR Laws in Port Mansfield (2026)
While Port Mansfield, Texas, United States currently shows low STR regulations, specific Airbnb license requirements might still exist or change. Always verify the latest short term rental regulations and Airbnb license requirements directly with local government authorities for Port Mansfield to ensure full compliance before hosting.
(Source: AirROI data, 2026, finding no licensed listings among those analyzed)
Top Performing Airbnb Properties in Port Mansfield (2026)
Benchmark your potential! Explore examples of top-performing Airbnb properties in Port Mansfieldbased on Trailing Twelve Month (TTM) revenue. Analyze their characteristics, revenue, occupancy rate, and ADR to understand what drives success in this market.
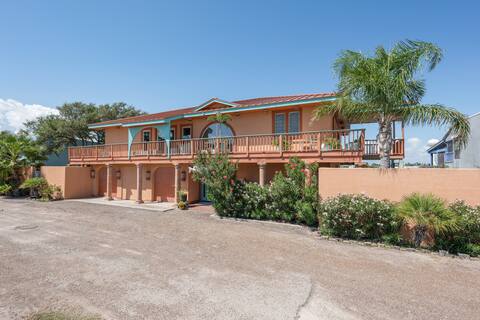
Gorgeous Waterfront 4-bedroom Villa with pool
Entire Place • 4 bedrooms
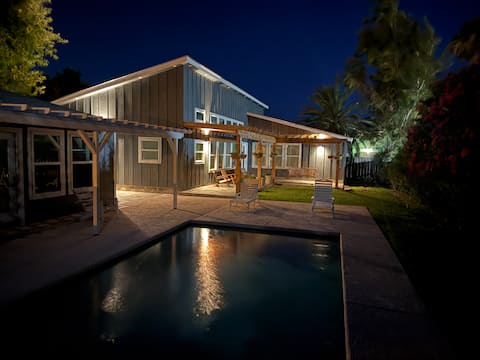
Where Family Comes First
Entire Place • 4 bedrooms
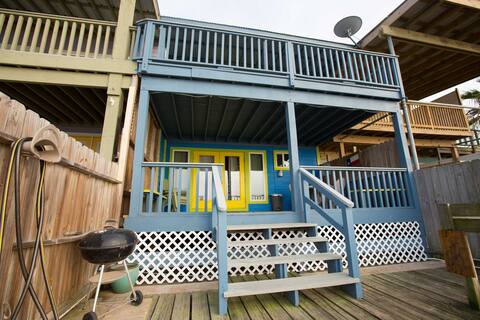
Mansfield Condo House - Harborfront - Boatslip
Entire Place • 2 bedrooms
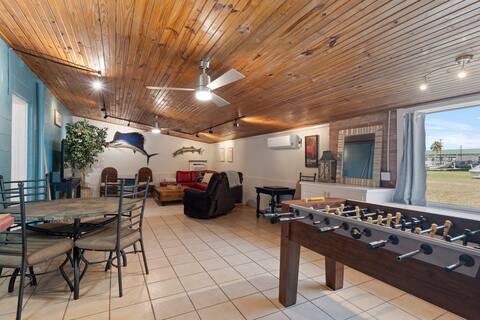
Get "Off the Hook" walking distance to marina
Entire Place • 3 bedrooms

Welcome to "DEAN'S DOCK"
Entire Place • 2 bedrooms

Laguna Ranch- Rattlesnake
Entire Place • 4 bedrooms
Note: Performance varies based on location, size, amenities, seasonality, and management quality. Data reflects the past 12 months.
Top Performing Airbnb Hosts in Port Mansfield (2026)
Learn from the best! This table showcases top-performing Airbnb hosts in Port Mansfield based on the number of properties managed and estimated total revenue over the past year. Analyze their scale and performance metrics.
| Host Name | Properties | Grossing Revenue | Stay Reviews | Avg Rating |
|---|---|---|---|---|
| Kathie | 1 | $221,094 | 18 | 4.89/5.0 |
| Matias | 4 | $107,702 | 188 | 4.84/5.0 |
| Kyle | 2 | $96,814 | 31 | 5.00/5.0 |
| Nasario | 1 | $70,183 | 57 | 4.93/5.0 |
| Ben | 1 | $63,712 | 50 | 5.00/5.0 |
| Mandi | 3 | $60,112 | 38 | 4.89/5.0 |
| Brianna | 1 | $57,330 | 41 | 4.98/5.0 |
| Esther | 1 | $55,706 | 27 | 5.00/5.0 |
| Daniel | 1 | $44,968 | 7 | 4.71/5.0 |
| Jessica | 3 | $43,492 | 12 | 4.70/5.0 |
Analyzing the strategies of top hosts, such as their property selection, pricing, and guest communication, can offer valuable lessons for optimizing your own Airbnb operations in Port Mansfield.
Dive Deeper: Advanced Port Mansfield STR Market Data (2026)
Ready to unlock more insights? AirROI provides access to advanced metrics and comprehensive Airbnb data for Port Mansfield. Explore detailed analytics beyond this report to refine your investment strategy, optimize pricing, and maximize your vacation rental profits.
Explore Advanced MetricsPort Mansfield Short-Term Rental Market Composition (2026): Property & Room Types
Room Type Distribution
Property Type Distribution
Market Composition Insights for Port Mansfield
- The Port Mansfield Airbnb market composition is heavily skewed towards Entire Home/Apt listings, which make up 100% of the 29 active rentals. This indicates strong guest preference for privacy and space.
- Looking at the property type distribution in Port Mansfield, House properties are the most common (69%), reflecting the local real estate landscape.
- Houses represent a significant 69% portion, catering likely to families or larger groups.
- Smaller segments like outdoor/unique (combined 3.4%) offer potential for unique stay experiences.
Port Mansfield Airbnb Room Capacity Analysis (2026): Bedroom Distribution
Distribution of Listings by Number of Bedrooms
Room Capacity Insights for Port Mansfield
- The dominant room capacity in Port Mansfield is 2 bedrooms listings, making up 31% of the market. This suggests a strong demand for properties suitable for couples or solo travelers.
- Together, 2 bedrooms and 3 bedrooms properties represent 62.0% of the active Airbnb listings in Port Mansfield, indicating a high concentration in these sizes.
- A significant 58.5% of listings offer 3+ bedrooms, catering to larger groups and families seeking more space in Port Mansfield.
Port Mansfield Vacation Rental Guest Capacity Trends (2026)
Distribution of Listings by Guest Capacity
Guest Capacity Insights for Port Mansfield
- The most common guest capacity trend in Port Mansfield vacation rentals is listings accommodating 8+ guests (44.8%). This suggests the primary traveler segment is likely larger groups.
- Properties designed for 8+ guests and 6 guests dominate the Port Mansfield STR market, accounting for 75.8% of listings.
- 82.7% of properties accommodate 6+ guests, serving the market segment for larger families or group travel in Port Mansfield.
- On average, properties in Port Mansfield are equipped to host 6.7 guests.
Port Mansfield Airbnb Booking Patterns (2026): Available vs. Booked Days
Available Days Distribution
Booked Days Distribution
Booking Pattern Insights for Port Mansfield
- The most common availability pattern in Port Mansfield falls within the 271-366 days range, representing 65.5% of listings. This suggests many properties have significant open periods on their calendars.
- Approximately 93.1% of listings show high availability (181+ days open annually), indicating potential for increased bookings or specific owner usage patterns.
- For booked days, the 31-90 days range is most frequent in Port Mansfield (48.3%), reflecting common guest stay durations or potential owner blocking patterns.
- A notable 6.9% of properties secure long booking periods (181+ days booked per year), highlighting successful long-term rental strategies or significant owner usage.
Port Mansfield Airbnb Minimum Stay Requirements Analysis
Distribution of Listings by Minimum Night Requirement
1 Night
4 listings
13.8% of total
2 Nights
19 listings
65.5% of total
3 Nights
3 listings
10.3% of total
30+ Nights
3 listings
10.3% of total
Key Insights
- The most prevalent minimum stay requirement in Port Mansfield is 2 Nights, adopted by 65.5% of listings. This highlights the market's preference for shorter, flexible bookings.
- A strong majority (79.3%) of the Port Mansfield Airbnb data shows acceptance of very short stays (1-2 nights), indicating a dynamic, high-turnover market.
- A significant segment (10.3%) caters to monthly stays (30+ nights) in Port Mansfield, pointing to opportunities in the extended-stay market.
Recommendations
- Align with the market by considering a 2 Nights minimum stay, as 65.5% of Port Mansfield hosts use this setting.
- If feasible, allowing 1-night stays, especially midweek or during low season, could capture last-minute bookings, as only 13.8% currently do.
- A 2-night minimum appears standard (65.5%). Consider this for weekends or peak periods.
- Explore offering discounts for stays of 30+ nights to attract the 10.3% of the market seeking extended stays.
- Adjust minimum nights based on seasonality – potentially shorter during low season and longer during peak demand periods in Port Mansfield.
Port Mansfield Airbnb Cancellation Policy Trends Analysis (2026)
Flexible
8 listings
27.6% of total
Moderate
7 listings
24.1% of total
Firm
9 listings
31% of total
Strict
5 listings
17.2% of total
Cancellation Policy Insights for Port Mansfield
- The prevailing Airbnb cancellation policy trend in Port Mansfield is Firm, used by 31% of listings.
- There's a relatively balanced mix between guest-friendly (51.7%) and stricter (48.2%) policies, offering choices for different guest needs.
Recommendations for Hosts
- Consider adopting a Firm policy to align with the 31% market standard in Port Mansfield.
- Regularly review your cancellation policy against competitors and market demand shifts in Port Mansfield.
Port Mansfield STR Booking Lead Time Analysis (2026)
Average Booking Lead Time by Month
Booking Lead Time Insights for Port Mansfield
- The overall average booking lead time for vacation rentals in Port Mansfield is 54 days.
- Guests book furthest in advance for stays during January (average 73 days), likely coinciding with peak travel demand or local events.
- The shortest booking windows occur for stays in February (average 36 days), indicating more last-minute travel plans during this time.
- Seasonally, Fall (61 days avg.) sees the longest lead times, while Spring (43 days avg.) has the shortest, reflecting typical travel planning cycles.
Recommendations for Hosts
- Use the overall average lead time (54 days) as a baseline for your pricing and availability strategy in Port Mansfield.
- For January stays, consider implementing length-of-stay discounts or slightly higher rates for bookings made less than 73 days out to capitalize on advance planning.
- Target marketing efforts for the Fall season well in advance (at least 61 days) to capture early planners.
- Monitor your own booking lead times against these Port Mansfield averages to identify opportunities for dynamic pricing adjustments.
Popular & Essential Airbnb Amenities in Port Mansfield (2026)
Amenity Prevalence
Amenity Insights for Port Mansfield
- Essential amenities in Port Mansfield that guests expect include: Free parking on premises, Smoke alarm, Heating, Air conditioning, Dishes and silverware, Coffee maker, Microwave. Lacking these (any) could significantly impact bookings.
- Popular amenities like Hot water, Kitchen, TV are common but not universal. Offering these can provide a competitive edge.
Recommendations for Hosts
- Ensure your listing includes all essential amenities for Port Mansfield: Free parking on premises, Smoke alarm, Heating, Air conditioning, Dishes and silverware, Coffee maker, Microwave.
- Prioritize adding missing essentials: Free parking on premises, Smoke alarm, Heating, Air conditioning, Dishes and silverware, Coffee maker, Microwave.
- Consider adding popular differentiators like Hot water or Kitchen to increase appeal.
- Highlight unique or less common amenities you offer (e.g., hot tub, dedicated workspace, EV charger) in your listing description and photos.
- Regularly check competitor amenities in Port Mansfield to stay competitive.
Port Mansfield Airbnb Guest Demographics & Profile Analysis (2026)
Guest Profile Summary for Port Mansfield
- The typical guest profile for Airbnb in Port Mansfield consists of primarily domestic travelers (99%), often arriving from nearby Houston, typically belonging to the Post-2000s (Gen Z/Alpha) group (50%), primarily speaking English or Spanish.
- Domestic travelers account for 98.5% of guests.
- Key international markets include United States (98.5%) and Mexico (1.5%).
- Top languages spoken are English (77.4%) followed by Spanish (22.6%).
- A significant demographic segment is the Post-2000s (Gen Z/Alpha) group, representing 50% of guests.
Recommendations for Hosts
- Target domestic marketing efforts towards travelers from Houston and San Antonio.
- Tailor amenities and listing descriptions to appeal to the dominant Post-2000s (Gen Z/Alpha) demographic (e.g., highlight fast WiFi, smart home features, local guides).
- Highlight unique local experiences or amenities relevant to the primary guest profile.
- Consider seasonal promotions aligned with peak travel times for key origin markets.
Nearby Short-Term Rental Market Comparison
How does the Port Mansfield Airbnb market stack up against its neighbors? Compare key performance metrics like average monthly revenue, ADR, and occupancy rates in surrounding areas to understand the broader regional STR landscape.
| Market | Active Properties | Monthly Revenue | Daily Rate | Avg. Occupancy |
|---|---|---|---|---|
| City-by-the Sea | 24 | $4,479 | $520.08 | 35% |
| Port Aransas | 2,361 | $3,422 | $437.85 | 34% |
| South Padre Island | 2,347 | $2,957 | $341.64 | 36% |
| Alton | 13 | $2,484 | $392.58 | 23% |
| Rio Hondo | 46 | $2,381 | $309.67 | 31% |
| Port Isabel | 249 | $2,138 | $253.87 | 38% |
| Portland | 10 | $2,123 | $239.57 | 50% |
| Corpus Christi | 1,950 | $2,047 | $224.99 | 39% |
| Kingsville | 16 | $2,008 | $152.10 | 46% |
| La Feria | 12 | $1,810 | $138.16 | 45% |