Nederland Airbnb Market Analysis 2026: Short Term Rental Data & Vacation Rental Statistics in Texas, United States
Is Airbnb profitable in Nederland in 2026? Explore comprehensive Airbnb analytics for Nederland, Texas, United States to uncover income potential. This 2026 STR market report for Nederland, based on AirROI data from February 2025 to January 2026, reveals key trends in the niche market of 56 active listings.
Whether you're considering an Airbnb investment in Nederland, optimizing your existing vacation rental, or exploring rental arbitrage opportunities, understanding the Nederland Airbnb data is crucial. Leveraging the low regulation environment is key to maximizing your short term rental income potential. Let's dive into the specifics.
Key Nederland Airbnb Performance Metrics Overview
Monthly Airbnb Revenue Variations & Income Potential in Nederland (2026)
Understanding the monthly revenue variations for Airbnb listings in Nederland is key to maximizing your short term rental income potential. Seasonality significantly impacts earnings. Our analysis, based on data from the past 12 months, shows that the peak revenue month for STRs in Nederland is typically March, while December often presents the lowest earnings, highlighting opportunities for strategic pricing adjustments during shoulder and low seasons. Explore the typical Airbnb income in Nederland across different performance tiers:
- Best-in-class properties (Top 10%) achieve $4,001+ monthly, often utilizing dynamic pricing and superior guest experiences.
- Strong performing properties (Top 25%) earn $2,542 or more, indicating effective management and desirable locations/amenities.
- Typical properties (Median) generate around $1,407 per month, representing the average market performance.
- Entry-level properties (Bottom 25%) see earnings around $661, often with potential for optimization.
Average Monthly Airbnb Earnings Trend in Nederland
Nederland Airbnb Occupancy Rate Trends (2026)
Maximize your bookings by understanding the Nederland STR occupancy trends. Seasonal demand shifts significantly influence how often properties are booked. Typically, Septembersees the highest demand (peak season occupancy), while January experiences the lowest (low season). Effective strategies, like adjusting minimum stays or offering promotions, can boost occupancy during slower periods. Here's how different property tiers perform in Nederland:
- Best-in-class properties (Top 10%) achieve 83%+ occupancy, indicating high desirability and potentially optimized availability.
- Strong performing properties (Top 25%) maintain 66% or higher occupancy, suggesting good market fit and guest satisfaction.
- Typical properties (Median) have an occupancy rate around 40%.
- Entry-level properties (Bottom 25%) average 21% occupancy, potentially facing higher vacancy.
Average Monthly Occupancy Rate Trend in Nederland
Average Daily Rate (ADR) Airbnb Trends in Nederland (2026)
Effective short term rental pricing strategy in Nederland involves understanding monthly ADR fluctuations. The Average Daily Rate (ADR) for Airbnb in Nederland typically peaks in September and dips lowest during March. Leveraging Airbnb dynamic pricing tools or strategies based on this seasonality can significantly boost revenue. Here's a look at the typical nightly rates achieved:
- Best-in-class properties (Top 10%) command rates of $202+ per night, often due to premium features or locations.
- Strong performing properties (Top 25%) achieve nightly rates of $159 or more.
- Typical properties (Median) charge around $106 per night.
- Entry-level properties (Bottom 25%) earn around $67 per night.
Average Daily Rate (ADR) Trend by Month in Nederland
Get Live Nederland Market Intelligence 👇

Explore Real-time Analytics
Airbnb Seasonality Analysis & Trends in Nederland (2026)
Peak Season (March, February, September)
- Revenue averages $2,229 per month
- Occupancy rates average 53.0%
- Daily rates average $115
Shoulder Season
- Revenue averages $1,808 per month
- Occupancy maintains around 43.6%
- Daily rates hold near $119
Low Season (January, May, December)
- Revenue drops to average $1,424 per month
- Occupancy decreases to average 35.2%
- Daily rates adjust to average $123
Seasonality Insights for Nederland
- The Airbnb seasonality in Nederland shows moderate seasonality with distinct peak and low periods. While the sections above show seasonal averages, it's also insightful to look at the extremes:
- During the high season, the absolute peak month showcases Nederland's highest earning potential, with monthly revenues capable of climbing to $2,333, occupancy reaching a high of 54.6%, and ADRs peaking at $132.
- Conversely, the slowest single month of the year, typically falling within the low season, marks the market's lowest point. In this month, revenue might dip to $1,244, occupancy could drop to 30.4%, and ADRs may adjust down to $105.
- Understanding both the seasonal averages and these monthly peaks and troughs in revenue, occupancy, and ADR is crucial for maximizing your Airbnb profit potential in Nederland.
Seasonal Strategies for Maximizing Profit
- Peak Season: Maximize revenue through premium pricing and potentially longer minimum stays. Ensure high availability.
- Low Season: Offer competitive pricing, special promotions (e.g., extended stay discounts), and flexible cancellation policies. Target off-season travelers like remote workers or budget-conscious guests.
- Shoulder Seasons: Implement dynamic pricing that balances peak and low rates. Target weekend travelers or specific events. Offer slightly more flexible terms than peak season.
- Regularly analyze your own performance against these Nederland seasonality benchmarks and adjust your pricing and availability strategy accordingly.
Best Areas for Airbnb Investment in Nederland (2026)
Exploring the top neighborhoods for short-term rentals in Nederland? This section highlights key areas, outlining why they are attractive for hosts and guests, along with notable local attractions. Consider these locations based on your target guest profile and investment strategy.
| Neighborhood / Area | Why Host Here? (Target Guests & Appeal) | Key Attractions & Landmarks |
|---|---|---|
| Downtown Nederland | The central area of Nederland, which hosts various events and offers a vibrant community feel. It attracts visitors for local festivals and activities throughout the year. | Nederville Park, City Hall Park, Nederland Historical Society, local dining options, art galleries |
| Lake Nederland | A beautiful area for outdoor enthusiasts, popular for fishing, boating, and relaxation by the water. Ideal for families and nature lovers. | Lake Nederland, fishing spots, picnic areas, water sports, nature trails |
| Holland Park | A neighborhood known for its parks and family-friendly atmosphere, great for short-term rentals catering to families visiting local attractions. | Holland Park, family-friendly activities, local playgrounds, community events |
| Midtown Nederland | A convenient and developing area that is close to amenities and services, appealing to visitors looking for local culture and business. | shopping centers, restaurants, local cafes, business districts |
| West Nederland | A residential area that offers easy access to nearby attractions in Port Arthur and Beaumont, making it suitable for visitors exploring the region. | residential neighborhoods, proximity to Port Arthur attractions, local dining options |
| North Nederland | This area is quieter and more suburban, attracting those looking for relaxation and convenient access to local parks and nature. | local parks, community centers, suburban charm, peaceful environment |
| South Nederland | A budding area with new developments and easy access to major highways, appealing to travelers looking for both comfort and convenience. | new developments, highway access, shopping options |
| Nederland Historical District | Rich in history and culture, this area attracts history buffs and visitors interested in the local heritage of Nederland. | historical sites, cultural events, local museums, heritage tours |
Understanding Airbnb License Requirements & STR Laws in Nederland (2026)
While Nederland, Texas, United States currently shows low STR regulations, specific Airbnb license requirements might still exist or change. Always verify the latest short term rental regulations and Airbnb license requirements directly with local government authorities for Nederland to ensure full compliance before hosting.
(Source: AirROI data, 2026, finding no licensed listings among those analyzed)
Top Performing Airbnb Properties in Nederland (2026)
Benchmark your potential! Explore examples of top-performing Airbnb properties in Nederlandbased on Trailing Twelve Month (TTM) revenue. Analyze their characteristics, revenue, occupancy rate, and ADR to understand what drives success in this market.

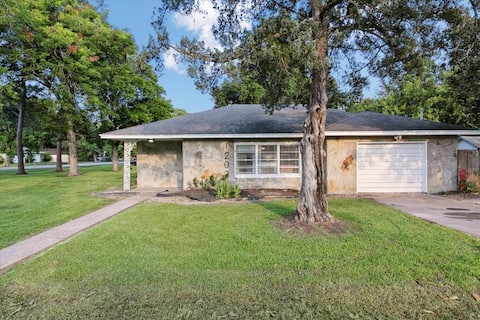
Lavish Living on 37th with Private Pool
Entire Place • 3 bedrooms

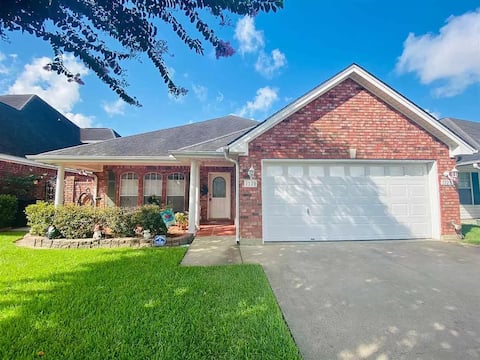
Updated 4 bedroom home in Nederland
Entire Place • 4 bedrooms
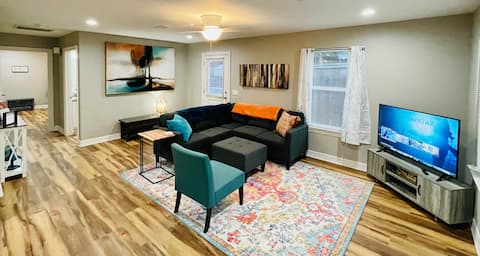
Charming 3 bedroom 2 bath home in Nederland
Entire Place • 3 bedrooms
Beautiful house in esteemed cul-de-sac.
Entire Place • 2 bedrooms

Pet friendly, no pet fees. 3bedrooms/2 full baths
Entire Place • 3 bedrooms
Combo Duplex Sleeps 8 4BR/4BA
Entire Place • 4 bedrooms
Note: Performance varies based on location, size, amenities, seasonality, and management quality. Data reflects the past 12 months.
Top Performing Airbnb Hosts in Nederland (2026)
Learn from the best! This table showcases top-performing Airbnb hosts in Nederland based on the number of properties managed and estimated total revenue over the past year. Analyze their scale and performance metrics.
| Host Name | Properties | Grossing Revenue | Stay Reviews | Avg Rating |
|---|---|---|---|---|
| Heidi | 11 | $128,227 | 123 | 4.99/5.0 |
| Amber | 2 | $79,278 | 60 | 4.85/5.0 |
| Karla | 7 | $68,757 | 312 | 4.83/5.0 |
| Nash & Rogers LLC | 2 | $61,630 | 178 | 4.87/5.0 |
| Abigail | 5 | $52,444 | 47 | 4.98/5.0 |
| Nathan | 3 | $29,516 | 34 | 4.96/5.0 |
| Faheem Hussain | 1 | $27,011 | 17 | 4.88/5.0 |
| Annette | 1 | $26,969 | 60 | 4.88/5.0 |
| Kelsey | 2 | $24,792 | 42 | 5.00/5.0 |
| Joanna | 2 | $24,348 | 40 | 4.97/5.0 |
Analyzing the strategies of top hosts, such as their property selection, pricing, and guest communication, can offer valuable lessons for optimizing your own Airbnb operations in Nederland.
Dive Deeper: Advanced Nederland STR Market Data (2026)
Ready to unlock more insights? AirROI provides access to advanced metrics and comprehensive Airbnb data for Nederland. Explore detailed analytics beyond this report to refine your investment strategy, optimize pricing, and maximize your vacation rental profits.
Explore Advanced MetricsNederland Short-Term Rental Market Composition (2026): Property & Room Types
Room Type Distribution
Property Type Distribution
Market Composition Insights for Nederland
- The Nederland Airbnb market composition is heavily skewed towards Entire Home/Apt listings, which make up 75% of the 56 active rentals. This indicates strong guest preference for privacy and space.
- Looking at the property type distribution in Nederland, House properties are the most common (76.8%), reflecting the local real estate landscape.
- Houses represent a significant 76.8% portion, catering likely to families or larger groups.
- The presence of 5.4% Hotel/Boutique listings indicates integration with traditional hospitality.
- Smaller segments like outdoor/unique, others (combined 5.4%) offer potential for unique stay experiences.
Nederland Airbnb Room Capacity Analysis (2026): Bedroom Distribution
Distribution of Listings by Number of Bedrooms
Room Capacity Insights for Nederland
- The dominant room capacity in Nederland is 2 bedrooms listings, making up 33.9% of the market. This suggests a strong demand for properties suitable for couples or solo travelers.
- Together, 2 bedrooms and 3 bedrooms properties represent 62.5% of the active Airbnb listings in Nederland, indicating a high concentration in these sizes.
- A significant 32.2% of listings offer 3+ bedrooms, catering to larger groups and families seeking more space in Nederland.
Nederland Vacation Rental Guest Capacity Trends (2026)
Distribution of Listings by Guest Capacity
Guest Capacity Insights for Nederland
- The most common guest capacity trend in Nederland vacation rentals is listings accommodating 4 guests (25%). This suggests the primary traveler segment is likely small families or groups.
- Properties designed for 4 guests and 6 guests dominate the Nederland STR market, accounting for 35.7% of listings.
- 23.2% of properties accommodate 6+ guests, serving the market segment for larger families or group travel in Nederland.
- On average, properties in Nederland are equipped to host 3.5 guests.
Nederland Airbnb Booking Patterns (2026): Available vs. Booked Days
Available Days Distribution
Booked Days Distribution
Booking Pattern Insights for Nederland
- The most common availability pattern in Nederland falls within the 271-366 days range, representing 51.8% of listings. This suggests many properties have significant open periods on their calendars.
- Approximately 89.3% of listings show high availability (181+ days open annually), indicating potential for increased bookings or specific owner usage patterns.
- For booked days, the 31-90 days range is most frequent in Nederland (37.5%), reflecting common guest stay durations or potential owner blocking patterns.
- A notable 12.5% of properties secure long booking periods (181+ days booked per year), highlighting successful long-term rental strategies or significant owner usage.
Nederland Airbnb Minimum Stay Requirements Analysis
Distribution of Listings by Minimum Night Requirement
1 Night
21 listings
37.5% of total
2 Nights
8 listings
14.3% of total
3 Nights
2 listings
3.6% of total
4-6 Nights
11 listings
19.6% of total
7-29 Nights
9 listings
16.1% of total
30+ Nights
5 listings
8.9% of total
Key Insights
- The most prevalent minimum stay requirement in Nederland is 1 Night, adopted by 37.5% of listings. This highlights the market's preference for shorter, flexible bookings.
Recommendations
- Align with the market by considering a 1 Night minimum stay, as 37.5% of Nederland hosts use this setting.
- Explore offering discounts for stays of 30+ nights to attract the 8.9% of the market seeking extended stays.
- Adjust minimum nights based on seasonality – potentially shorter during low season and longer during peak demand periods in Nederland.
Nederland Airbnb Cancellation Policy Trends Analysis (2026)
Super Strict 30 Days
2 listings
3.6% of total
Flexible
17 listings
30.9% of total
Moderate
25 listings
45.5% of total
Firm
8 listings
14.5% of total
Strict
3 listings
5.5% of total
Cancellation Policy Insights for Nederland
- The prevailing Airbnb cancellation policy trend in Nederland is Moderate, used by 45.5% of listings.
- The market strongly favors guest-friendly terms, with 76.4% of listings offering Flexible or Moderate policies. This suggests guests in Nederland may expect booking flexibility.
- Strict cancellation policies are quite rare (5.5%), potentially making listings with this policy less competitive unless justified by high demand or property type.
Recommendations for Hosts
- Consider adopting a Moderate policy to align with the 45.5% market standard in Nederland.
- Using a Strict policy might deter some guests, as only 5.5% of listings use it. Evaluate if potential revenue protection outweighs possible lower booking rates.
- Regularly review your cancellation policy against competitors and market demand shifts in Nederland.
Nederland STR Booking Lead Time Analysis (2026)
Average Booking Lead Time by Month
Booking Lead Time Insights for Nederland
- The overall average booking lead time for vacation rentals in Nederland is 14 days.
- Guests book furthest in advance for stays during April (average 22 days), likely coinciding with peak travel demand or local events.
- The shortest booking windows occur for stays in January (average 6 days), indicating more last-minute travel plans during this time.
- Seasonally, Summer (19 days avg.) sees the longest lead times, while Fall (10 days avg.) has the shortest, reflecting typical travel planning cycles.
Recommendations for Hosts
- Use the overall average lead time (14 days) as a baseline for your pricing and availability strategy in Nederland.
- During January, focus on last-minute booking availability and promotions, as guests book with very short notice (6 days avg.).
- Target marketing efforts for the Summer season well in advance (at least 19 days) to capture early planners.
- Monitor your own booking lead times against these Nederland averages to identify opportunities for dynamic pricing adjustments.
Popular & Essential Airbnb Amenities in Nederland (2026)
Amenity Prevalence
Amenity Insights for Nederland
- Essential amenities in Nederland that guests expect include: Free parking on premises, Air conditioning, TV, Wifi, Kitchen. Lacking these (any) could significantly impact bookings.
- Popular amenities like Dryer, Heating, Washer are common but not universal. Offering these can provide a competitive edge.
Recommendations for Hosts
- Ensure your listing includes all essential amenities for Nederland: Free parking on premises, Air conditioning, TV, Wifi, Kitchen.
- Prioritize adding missing essentials: Kitchen.
- Consider adding popular differentiators like Dryer or Heating to increase appeal.
- Highlight unique or less common amenities you offer (e.g., hot tub, dedicated workspace, EV charger) in your listing description and photos.
- Regularly check competitor amenities in Nederland to stay competitive.
Nederland Airbnb Guest Demographics & Profile Analysis (2026)
Guest Profile Summary for Nederland
- The typical guest profile for Airbnb in Nederland consists of primarily domestic travelers (99%), often arriving from nearby Houston, typically belonging to the Post-2000s (Gen Z/Alpha) group (50%), primarily speaking English or Spanish.
- Domestic travelers account for 99.2% of guests.
- Key international markets include United States (99.2%) and Texas (0.8%).
- Top languages spoken are English (75.4%) followed by Spanish (23.1%).
- A significant demographic segment is the Post-2000s (Gen Z/Alpha) group, representing 50% of guests.
Recommendations for Hosts
- Target domestic marketing efforts towards travelers from Houston and Magnolia.
- Tailor amenities and listing descriptions to appeal to the dominant Post-2000s (Gen Z/Alpha) demographic (e.g., highlight fast WiFi, smart home features, local guides).
- Highlight unique local experiences or amenities relevant to the primary guest profile.
- Consider seasonal promotions aligned with peak travel times for key origin markets.
Nearby Short-Term Rental Market Comparison
How does the Nederland Airbnb market stack up against its neighbors? Compare key performance metrics like average monthly revenue, ADR, and occupancy rates in surrounding areas to understand the broader regional STR landscape.
| Market | Active Properties | Monthly Revenue | Daily Rate | Avg. Occupancy |
|---|---|---|---|---|
| Fairfield | 10 | $4,761 | $360.96 | 42% |
| Jamaica Beach | 199 | $3,774 | $394.20 | 37% |
| Crystal Beach | 143 | $3,768 | $408.48 | 35% |
| Bolivar Peninsula | 913 | $3,311 | $396.49 | 34% |
| Deer Park | 14 | $3,208 | $228.63 | 51% |
| Seabrook | 54 | $2,872 | $263.19 | 39% |
| Hackberry | 26 | $2,869 | $332.54 | 31% |
| Friendswood | 31 | $2,816 | $247.85 | 46% |
| Surfside Beach | 405 | $2,779 | $325.48 | 35% |
| Porter | 17 | $2,773 | $213.98 | 43% |