Midland Airbnb Market Analysis 2026: Short Term Rental Data & Vacation Rental Statistics in Texas, United States
Is Airbnb profitable in Midland in 2026? Explore comprehensive Airbnb analytics for Midland, Texas, United States to uncover income potential. This 2026 STR market report for Midland, based on AirROI data from February 2025 to January 2026, reveals key trends in the market of 357 active listings.
Whether you're considering an Airbnb investment in Midland, optimizing your existing vacation rental, or exploring rental arbitrage opportunities, understanding the Midland Airbnb data is crucial. Leveraging the low regulation environment is key to maximizing your short term rental income potential. Let's dive into the specifics.
Key Midland Airbnb Performance Metrics Overview
Monthly Airbnb Revenue Variations & Income Potential in Midland (2026)
Understanding the monthly revenue variations for Airbnb listings in Midland is key to maximizing your short term rental income potential. Seasonality significantly impacts earnings. Our analysis, based on data from the past 12 months, shows that the peak revenue month for STRs in Midland is typically June, while January often presents the lowest earnings, highlighting opportunities for strategic pricing adjustments during shoulder and low seasons. Explore the typical Airbnb income in Midland across different performance tiers:
- Best-in-class properties (Top 10%) achieve $4,734+ monthly, often utilizing dynamic pricing and superior guest experiences.
- Strong performing properties (Top 25%) earn $3,227 or more, indicating effective management and desirable locations/amenities.
- Typical properties (Median) generate around $2,037 per month, representing the average market performance.
- Entry-level properties (Bottom 25%) see earnings around $1,037, often with potential for optimization.
Average Monthly Airbnb Earnings Trend in Midland
Midland Airbnb Occupancy Rate Trends (2026)
Maximize your bookings by understanding the Midland STR occupancy trends. Seasonal demand shifts significantly influence how often properties are booked. Typically, Marchsees the highest demand (peak season occupancy), while January experiences the lowest (low season). Effective strategies, like adjusting minimum stays or offering promotions, can boost occupancy during slower periods. Here's how different property tiers perform in Midland:
- Best-in-class properties (Top 10%) achieve 87%+ occupancy, indicating high desirability and potentially optimized availability.
- Strong performing properties (Top 25%) maintain 71% or higher occupancy, suggesting good market fit and guest satisfaction.
- Typical properties (Median) have an occupancy rate around 48%.
- Entry-level properties (Bottom 25%) average 24% occupancy, potentially facing higher vacancy.
Average Monthly Occupancy Rate Trend in Midland
Average Daily Rate (ADR) Airbnb Trends in Midland (2026)
Effective short term rental pricing strategy in Midland involves understanding monthly ADR fluctuations. The Average Daily Rate (ADR) for Airbnb in Midland typically peaks in October and dips lowest during February. Leveraging Airbnb dynamic pricing tools or strategies based on this seasonality can significantly boost revenue. Here's a look at the typical nightly rates achieved:
- Best-in-class properties (Top 10%) command rates of $310+ per night, often due to premium features or locations.
- Strong performing properties (Top 25%) achieve nightly rates of $224 or more.
- Typical properties (Median) charge around $142 per night.
- Entry-level properties (Bottom 25%) earn around $98 per night.
Average Daily Rate (ADR) Trend by Month in Midland
Get Live Midland Market Intelligence 👇

Explore Real-time Analytics
Airbnb Seasonality Analysis & Trends in Midland (2026)
Peak Season (June, March, July)
- Revenue averages $2,696 per month
- Occupancy rates average 53.0%
- Daily rates average $166
Shoulder Season
- Revenue averages $2,364 per month
- Occupancy maintains around 46.5%
- Daily rates hold near $175
Low Season (January, February, November)
- Revenue drops to average $2,125 per month
- Occupancy decreases to average 45.8%
- Daily rates adjust to average $176
Seasonality Insights for Midland
- The Airbnb seasonality in Midland shows moderate seasonality with distinct peak and low periods. While the sections above show seasonal averages, it's also insightful to look at the extremes:
- During the high season, the absolute peak month showcases Midland's highest earning potential, with monthly revenues capable of climbing to $2,877, occupancy reaching a high of 58.6%, and ADRs peaking at $189.
- Conversely, the slowest single month of the year, typically falling within the low season, marks the market's lowest point. In this month, revenue might dip to $1,832, occupancy could drop to 37.7%, and ADRs may adjust down to $154.
- Understanding both the seasonal averages and these monthly peaks and troughs in revenue, occupancy, and ADR is crucial for maximizing your Airbnb profit potential in Midland.
Seasonal Strategies for Maximizing Profit
- Peak Season: Maximize revenue through premium pricing and potentially longer minimum stays. Ensure high availability.
- Low Season: Offer competitive pricing, special promotions (e.g., extended stay discounts), and flexible cancellation policies. Target off-season travelers like remote workers or budget-conscious guests.
- Shoulder Seasons: Implement dynamic pricing that balances peak and low rates. Target weekend travelers or specific events. Offer slightly more flexible terms than peak season.
- Regularly analyze your own performance against these Midland seasonality benchmarks and adjust your pricing and availability strategy accordingly.
Best Areas for Airbnb Investment in Midland (2026)
Exploring the top neighborhoods for short-term rentals in Midland? This section highlights key areas, outlining why they are attractive for hosts and guests, along with notable local attractions. Consider these locations based on your target guest profile and investment strategy.
| Neighborhood / Area | Why Host Here? (Target Guests & Appeal) | Key Attractions & Landmarks |
|---|---|---|
| Midland Downtown | The central business district offers a vibrant atmosphere with restaurants, shopping, and proximity to major employers. Ideal for business travelers and tourists alike. | Midland County Courthouse, Winkler County Museum, Midland Community Theatre, The Petroleum Museum, The Midland Center |
| Legacy Ranch | A suburban neighborhood with spacious homes and family-friendly amenities. Great for families visiting Midland or professionals relocating for work. | Shopping centers, Parks and recreational areas, Local dining options, Community events |
| North Midland | Close to major highways and offering access to the Midland International Airport, this area attracts both transient visitors and long-term stays. | Midland Airport, Shopping outlets, Restaurants and cafes, Cinemas |
| South Midland | A growing area with many new developments and quiet streets, perfect for families or long-term guests who prefer a quieter environment. | Local parks, Schools and educational facilities, Community activities |
| Fitzhugh Estates | An upscale neighborhood featuring larger homes and amenities, appealing to affluent travelers and those looking for premium accommodations. | Luxury dining options, Golf courses, Art galleries, Outdoor recreational areas |
| Midland Oasis | Known for its beautiful landscapes and recreational options, this area attracts tourists looking for a relaxing stay close to nature. | Local lakes and parks, Scenic trails, Nature activities |
| Greathouse Estates | A residential neighborhood known for its affordability and convenience, suitable for budget-conscious travelers and families. | Community parks, Affordable dining options, Schools |
| West Midland | A burgeoning area with access to new retail developments and dining, appealing to both visitors and residents. | New shopping areas, Cafes and restaurants, Local events |
Understanding Airbnb License Requirements & STR Laws in Midland (2026)
While Midland, Texas, United States currently shows low STR regulations, specific Airbnb license requirements might still exist or change. Always verify the latest short term rental regulations and Airbnb license requirements directly with local government authorities for Midland to ensure full compliance before hosting.
(Source: AirROI data, 2026, finding no licensed listings among those analyzed)
Top Performing Airbnb Properties in Midland (2026)
Benchmark your potential! Explore examples of top-performing Airbnb properties in Midlandbased on Trailing Twelve Month (TTM) revenue. Analyze their characteristics, revenue, occupancy rate, and ADR to understand what drives success in this market.
Twin Oaks Oasis
Entire Place • 4 bedrooms

Zen Midland Retreat | 4BR•King Beds•Fast Wi-Fi•ADA
Entire Place • 4 bedrooms
The Stanley House - Entire Home
Entire Place • 4 bedrooms
AirSinclair - Putting Green, Basketball & 55" TV
Entire Place • 5 bedrooms
Legacy Lodge
Entire Place • 4 bedrooms
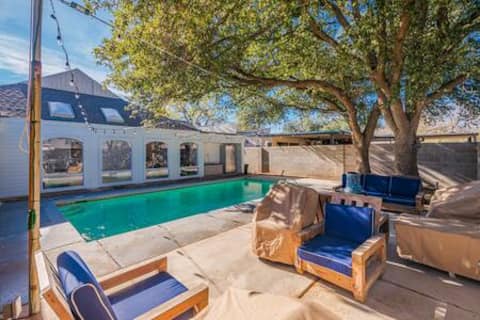
House in Midland with swimming pool
Entire Place • 3 bedrooms
Note: Performance varies based on location, size, amenities, seasonality, and management quality. Data reflects the past 12 months.
Top Performing Airbnb Hosts in Midland (2026)
Learn from the best! This table showcases top-performing Airbnb hosts in Midland based on the number of properties managed and estimated total revenue over the past year. Analyze their scale and performance metrics.
| Host Name | Properties | Grossing Revenue | Stay Reviews | Avg Rating |
|---|---|---|---|---|
| Lillian | 31 | $478,274 | 784 | 4.87/5.0 |
| Beckett | 11 | $461,245 | 1038 | 4.97/5.0 |
| Eniola | 33 | $234,915 | 268 | 4.83/5.0 |
| Tee | 9 | $199,148 | 133 | 4.72/5.0 |
| Thomas | 4 | $147,366 | 572 | 4.94/5.0 |
| Olumide | 3 | $136,224 | 159 | 4.94/5.0 |
| Paula | 6 | $120,311 | 152 | 4.86/5.0 |
| Kelly | 4 | $117,042 | 150 | 4.91/5.0 |
| Colton | 3 | $113,309 | 235 | 4.73/5.0 |
| Tyler | 1 | $111,529 | 60 | 4.98/5.0 |
Analyzing the strategies of top hosts, such as their property selection, pricing, and guest communication, can offer valuable lessons for optimizing your own Airbnb operations in Midland.
Dive Deeper: Advanced Midland STR Market Data (2026)
Ready to unlock more insights? AirROI provides access to advanced metrics and comprehensive Airbnb data for Midland. Explore detailed analytics beyond this report to refine your investment strategy, optimize pricing, and maximize your vacation rental profits.
Explore Advanced MetricsMidland Short-Term Rental Market Composition (2026): Property & Room Types
Room Type Distribution
Property Type Distribution
Market Composition Insights for Midland
- The Midland Airbnb market composition is heavily skewed towards Entire Home/Apt listings, which make up 93.8% of the 357 active rentals. This indicates strong guest preference for privacy and space.
- Looking at the property type distribution in Midland, House properties are the most common (67.2%), reflecting the local real estate landscape.
- Houses represent a significant 67.2% portion, catering likely to families or larger groups.
- Smaller segments like hotel/boutique, outdoor/unique, others (combined 9.9%) offer potential for unique stay experiences.
Midland Airbnb Room Capacity Analysis (2026): Bedroom Distribution
Distribution of Listings by Number of Bedrooms
Room Capacity Insights for Midland
- The dominant room capacity in Midland is 1 bedroom listings, making up 24.9% of the market. This suggests a strong demand for properties suitable for couples or solo travelers.
- Together, 1 bedroom and 2 bedrooms properties represent 49.0% of the active Airbnb listings in Midland, indicating a high concentration in these sizes.
- A significant 41.1% of listings offer 3+ bedrooms, catering to larger groups and families seeking more space in Midland.
Midland Vacation Rental Guest Capacity Trends (2026)
Distribution of Listings by Guest Capacity
Guest Capacity Insights for Midland
- The most common guest capacity trend in Midland vacation rentals is listings accommodating 8+ guests (28.6%). This suggests the primary traveler segment is likely larger groups.
- Properties designed for 8+ guests and 2 guests dominate the Midland STR market, accounting for 53.0% of listings.
- 42.9% of properties accommodate 6+ guests, serving the market segment for larger families or group travel in Midland.
- On average, properties in Midland are equipped to host 4.7 guests.
Midland Airbnb Booking Patterns (2026): Available vs. Booked Days
Available Days Distribution
Booked Days Distribution
Booking Pattern Insights for Midland
- The most common availability pattern in Midland falls within the 271-366 days range, representing 46.2% of listings. This suggests many properties have significant open periods on their calendars.
- Approximately 74.5% of listings show high availability (181+ days open annually), indicating potential for increased bookings or specific owner usage patterns.
- For booked days, the 91-180 days range is most frequent in Midland (29.4%), reflecting common guest stay durations or potential owner blocking patterns.
- A notable 27.2% of properties secure long booking periods (181+ days booked per year), highlighting successful long-term rental strategies or significant owner usage.
Midland Airbnb Minimum Stay Requirements Analysis
Distribution of Listings by Minimum Night Requirement
1 Night
83 listings
23.2% of total
2 Nights
128 listings
35.9% of total
3 Nights
42 listings
11.8% of total
4-6 Nights
13 listings
3.6% of total
7-29 Nights
14 listings
3.9% of total
30+ Nights
77 listings
21.6% of total
Key Insights
- The most prevalent minimum stay requirement in Midland is 2 Nights, adopted by 35.9% of listings. This highlights the market's preference for shorter, flexible bookings.
- A significant segment (21.6%) caters to monthly stays (30+ nights) in Midland, pointing to opportunities in the extended-stay market.
Recommendations
- Align with the market by considering a 2 Nights minimum stay, as 35.9% of Midland hosts use this setting.
- If feasible, allowing 1-night stays, especially midweek or during low season, could capture last-minute bookings, as only 23.2% currently do.
- Explore offering discounts for stays of 30+ nights to attract the 21.6% of the market seeking extended stays.
- Adjust minimum nights based on seasonality – potentially shorter during low season and longer during peak demand periods in Midland.
Midland Airbnb Cancellation Policy Trends Analysis (2026)
Limited
3 listings
0.8% of total
Flexible
146 listings
40.9% of total
Moderate
83 listings
23.2% of total
Firm
109 listings
30.5% of total
Strict
16 listings
4.5% of total
Cancellation Policy Insights for Midland
- The prevailing Airbnb cancellation policy trend in Midland is Flexible, used by 40.9% of listings.
- There's a relatively balanced mix between guest-friendly (64.1%) and stricter (35.0%) policies, offering choices for different guest needs.
- Strict cancellation policies are quite rare (4.5%), potentially making listings with this policy less competitive unless justified by high demand or property type.
Recommendations for Hosts
- Consider adopting a Flexible policy to align with the 40.9% market standard in Midland.
- Using a Strict policy might deter some guests, as only 4.5% of listings use it. Evaluate if potential revenue protection outweighs possible lower booking rates.
- Regularly review your cancellation policy against competitors and market demand shifts in Midland.
Midland STR Booking Lead Time Analysis (2026)
Average Booking Lead Time by Month
Booking Lead Time Insights for Midland
- The overall average booking lead time for vacation rentals in Midland is 17 days.
- Guests book furthest in advance for stays during June (average 25 days), likely coinciding with peak travel demand or local events.
- The shortest booking windows occur for stays in February (average 11 days), indicating more last-minute travel plans during this time.
- Seasonally, Spring (18 days avg.) sees the longest lead times, while Winter (13 days avg.) has the shortest, reflecting typical travel planning cycles.
Recommendations for Hosts
- Use the overall average lead time (17 days) as a baseline for your pricing and availability strategy in Midland.
- Target marketing efforts for the Spring season well in advance (at least 18 days) to capture early planners.
- Monitor your own booking lead times against these Midland averages to identify opportunities for dynamic pricing adjustments.
Popular & Essential Airbnb Amenities in Midland (2026)
Amenity Prevalence
Amenity Insights for Midland
- Essential amenities in Midland that guests expect include: Air conditioning, Wifi, TV, Free parking on premises. Lacking these (any) could significantly impact bookings.
- Popular amenities like Kitchen, Smoke alarm, Heating are common but not universal. Offering these can provide a competitive edge.
Recommendations for Hosts
- Ensure your listing includes all essential amenities for Midland: Air conditioning, Wifi, TV, Free parking on premises.
- Prioritize adding missing essentials: Air conditioning, Wifi, TV, Free parking on premises.
- Consider adding popular differentiators like Kitchen or Smoke alarm to increase appeal.
- Highlight unique or less common amenities you offer (e.g., hot tub, dedicated workspace, EV charger) in your listing description and photos.
- Regularly check competitor amenities in Midland to stay competitive.
Midland Airbnb Guest Demographics & Profile Analysis (2026)
Guest Profile Summary for Midland
- The typical guest profile for Airbnb in Midland consists of primarily domestic travelers (97%), often arriving from nearby Houston, typically belonging to the Post-2000s (Gen Z/Alpha) group (50%), primarily speaking English or Spanish.
- Domestic travelers account for 96.8% of guests.
- Key international markets include United States (96.8%) and Mexico (1%).
- Top languages spoken are English (72.3%) followed by Spanish (22.7%).
- A significant demographic segment is the Post-2000s (Gen Z/Alpha) group, representing 50% of guests.
Recommendations for Hosts
- Target domestic marketing efforts towards travelers from Houston and Midland.
- Tailor amenities and listing descriptions to appeal to the dominant Post-2000s (Gen Z/Alpha) demographic (e.g., highlight fast WiFi, smart home features, local guides).
- Highlight unique local experiences or amenities relevant to the primary guest profile.
- Consider seasonal promotions aligned with peak travel times for key origin markets.
Nearby Short-Term Rental Market Comparison
How does the Midland Airbnb market stack up against its neighbors? Compare key performance metrics like average monthly revenue, ADR, and occupancy rates in surrounding areas to understand the broader regional STR landscape.
| Market | Active Properties | Monthly Revenue | Daily Rate | Avg. Occupancy |
|---|---|---|---|---|
| Wolfforth | 12 | $2,234 | $161.59 | 49% |
| Lubbock | 936 | $1,882 | $184.69 | 41% |
| Hobbs | 57 | $1,833 | $146.32 | 53% |
| Lovington | 14 | $1,542 | $116.12 | 49% |
| Odessa | 198 | $1,438 | $164.18 | 41% |
| Buffalo Springs | 12 | $1,383 | $292.34 | 21% |
| Seminole | 10 | $1,296 | $149.37 | 29% |
| West Odessa | 26 | $1,104 | $84.79 | 52% |
| Big Spring | 50 | $1,062 | $134.70 | 41% |
| Pecos | 15 | $857 | $132.16 | 34% |