McAllen Airbnb Market Analysis 2026: Short Term Rental Data & Vacation Rental Statistics in Texas, United States
Is Airbnb profitable in McAllen in 2026? Explore comprehensive Airbnb analytics for McAllen, Texas, United States to uncover income potential. This 2026 STR market report for McAllen, based on AirROI data from February 2025 to January 2026, reveals key trends in the market of 484 active listings.
Whether you're considering an Airbnb investment in McAllen, optimizing your existing vacation rental, or exploring rental arbitrage opportunities, understanding the McAllen Airbnb data is crucial. Leveraging the low regulation environment is key to maximizing your short term rental income potential. Let's dive into the specifics.
Key McAllen Airbnb Performance Metrics Overview
Monthly Airbnb Revenue Variations & Income Potential in McAllen (2026)
Understanding the monthly revenue variations for Airbnb listings in McAllen is key to maximizing your short term rental income potential. Seasonality significantly impacts earnings. Our analysis, based on data from the past 12 months, shows that the peak revenue month for STRs in McAllen is typically July, while January often presents the lowest earnings, highlighting opportunities for strategic pricing adjustments during shoulder and low seasons. Explore the typical Airbnb income in McAllen across different performance tiers:
- Best-in-class properties (Top 10%) achieve $3,373+ monthly, often utilizing dynamic pricing and superior guest experiences.
- Strong performing properties (Top 25%) earn $2,171 or more, indicating effective management and desirable locations/amenities.
- Typical properties (Median) generate around $1,222 per month, representing the average market performance.
- Entry-level properties (Bottom 25%) see earnings around $577, often with potential for optimization.
Average Monthly Airbnb Earnings Trend in McAllen
McAllen Airbnb Occupancy Rate Trends (2026)
Maximize your bookings by understanding the McAllen STR occupancy trends. Seasonal demand shifts significantly influence how often properties are booked. Typically, Decembersees the highest demand (peak season occupancy), while January experiences the lowest (low season). Effective strategies, like adjusting minimum stays or offering promotions, can boost occupancy during slower periods. Here's how different property tiers perform in McAllen:
- Best-in-class properties (Top 10%) achieve 76%+ occupancy, indicating high desirability and potentially optimized availability.
- Strong performing properties (Top 25%) maintain 57% or higher occupancy, suggesting good market fit and guest satisfaction.
- Typical properties (Median) have an occupancy rate around 35%.
- Entry-level properties (Bottom 25%) average 17% occupancy, potentially facing higher vacancy.
Average Monthly Occupancy Rate Trend in McAllen
Average Daily Rate (ADR) Airbnb Trends in McAllen (2026)
Effective short term rental pricing strategy in McAllen involves understanding monthly ADR fluctuations. The Average Daily Rate (ADR) for Airbnb in McAllen typically peaks in December and dips lowest during March. Leveraging Airbnb dynamic pricing tools or strategies based on this seasonality can significantly boost revenue. Here's a look at the typical nightly rates achieved:
- Best-in-class properties (Top 10%) command rates of $224+ per night, often due to premium features or locations.
- Strong performing properties (Top 25%) achieve nightly rates of $151 or more.
- Typical properties (Median) charge around $108 per night.
- Entry-level properties (Bottom 25%) earn around $82 per night.
Average Daily Rate (ADR) Trend by Month in McAllen
Get Live McAllen Market Intelligence 👇

Explore Real-time Analytics
Airbnb Seasonality Analysis & Trends in McAllen (2026)
Peak Season (July, December, June)
- Revenue averages $1,860 per month
- Occupancy rates average 41.8%
- Daily rates average $135
Shoulder Season
- Revenue averages $1,587 per month
- Occupancy maintains around 38.9%
- Daily rates hold near $129
Low Season (January, February, September)
- Revenue drops to average $1,395 per month
- Occupancy decreases to average 35.0%
- Daily rates adjust to average $130
Seasonality Insights for McAllen
- The Airbnb seasonality in McAllen shows moderate seasonality with distinct peak and low periods. While the sections above show seasonal averages, it's also insightful to look at the extremes:
- During the high season, the absolute peak month showcases McAllen's highest earning potential, with monthly revenues capable of climbing to $1,932, occupancy reaching a high of 43.0%, and ADRs peaking at $140.
- Conversely, the slowest single month of the year, typically falling within the low season, marks the market's lowest point. In this month, revenue might dip to $1,388, occupancy could drop to 30.9%, and ADRs may adjust down to $122.
- Understanding both the seasonal averages and these monthly peaks and troughs in revenue, occupancy, and ADR is crucial for maximizing your Airbnb profit potential in McAllen.
Seasonal Strategies for Maximizing Profit
- Peak Season: Maximize revenue through premium pricing and potentially longer minimum stays. Ensure high availability.
- Low Season: Offer competitive pricing, special promotions (e.g., extended stay discounts), and flexible cancellation policies. Target off-season travelers like remote workers or budget-conscious guests.
- Shoulder Seasons: Implement dynamic pricing that balances peak and low rates. Target weekend travelers or specific events. Offer slightly more flexible terms than peak season.
- Regularly analyze your own performance against these McAllen seasonality benchmarks and adjust your pricing and availability strategy accordingly.
Best Areas for Airbnb Investment in McAllen (2026)
Exploring the top neighborhoods for short-term rentals in McAllen? This section highlights key areas, outlining why they are attractive for hosts and guests, along with notable local attractions. Consider these locations based on your target guest profile and investment strategy.
| Neighborhood / Area | Why Host Here? (Target Guests & Appeal) | Key Attractions & Landmarks |
|---|---|---|
| Downtown McAllen | The vibrant heart of McAllen, offering a mix of dining, entertainment, and businesses. It's easily accessible and well-known among travelers for its cultural attractions and events. | McAllen Performing Arts Center, La Plaza Mall, McAllen Heritage Center, Quinta Mazatlan, McAllen Convention Center |
| North McAllen | This area features many residential neighborhoods and parks, appealing to families and travelers seeking a quieter stay while still close to amenities and attractions. | Bicentennial Park, Palm View Golf Course, North McAllen Community Center, Bill Schupp Park |
| South McAllen | Close to popular shopping and dining options, this area is ideal for those wanting to experience the local culture and cuisine of McAllen without being far from the city attractions. | La Plaza Mall, The Shoppes at Rio, Carmen's Cafe, Parque de las Palomas |
| East McAllen | Known for its family-friendly atmosphere and proximity to schools and parks, this area attracts visitors looking for a relaxed stay while having easy access to city attractions. | Perry's Pizza, A.R. Zulema Park, Frida's Tacos, McAllen Public Library |
| McAllen Historic District | Rich in history and charm, this district offers unique architecture and a glimpse into the local culture. Perfect for tourists interested in the heritage of McAllen. | McAllen Historic Courthouse, La Casa de Amigos, Calle Ocho, Historic McAllen Post Office |
| Mission | Just a short drive from McAllen, Mission offers beautiful parks and family-friendly activities, attracting both tourists and locals who want a suburban environment. | Bentsen-Rio Grande Valley State Park, Mission Historical Museum, Sharyland Plantation |
| Edinburg | Neighboring city with its own attractions, Edinburg is gaining popularity among tourists looking for an affordable stay while still having access to McAllen and its amenities. | Museum of South Texas History, Edinburg Scenic Wetlands, University of Texas Rio Grande Valley |
| Alamo | A quieter area near McAllen, Alamo provides a more rural feel with access to outdoor activities and local festivals, perfect for those looking to escape the hustle and bustle. | Alamo Square Shopping Center, Alamo Water Tower, Leonel Ruiz Park |
Understanding Airbnb License Requirements & STR Laws in McAllen (2026)
While McAllen, Texas, United States currently shows low STR regulations, specific Airbnb license requirements might still exist or change. Always verify the latest short term rental regulations and Airbnb license requirements directly with local government authorities for McAllen to ensure full compliance before hosting.
(Source: AirROI data, 2026, based on 0% licensed listings)
Top Performing Airbnb Properties in McAllen (2026)
Benchmark your potential! Explore examples of top-performing Airbnb properties in McAllenbased on Trailing Twelve Month (TTM) revenue. Analyze their characteristics, revenue, occupancy rate, and ADR to understand what drives success in this market.
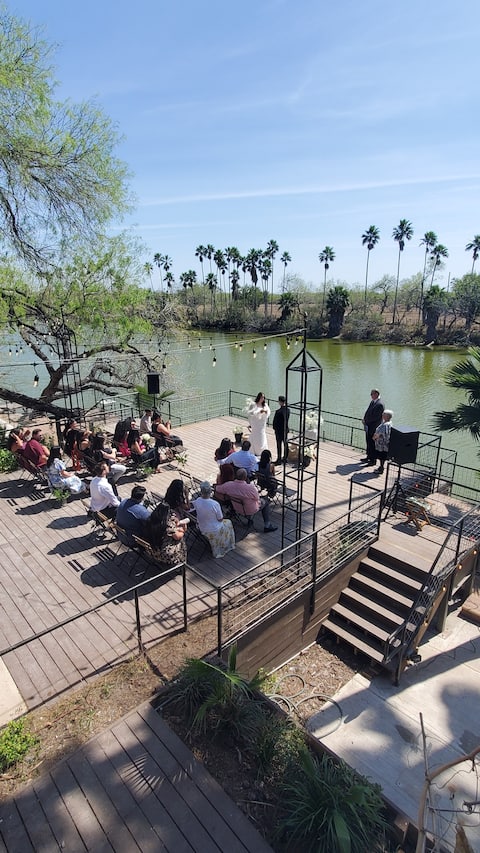
Micro weddings/small events @PeculiarNest
Entire Place • 7 bedrooms

Comfy Big Home w/ Pool & Arcade
Entire Place • 4 bedrooms
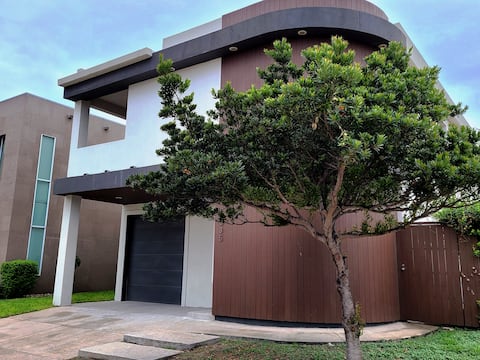
Gorgeous luxe organic modern minimal 5 brm 5.5 bth
Entire Place • 5 bedrooms

Modern 3 BR w private pool 7 max perfect location!
Entire Place • 3 bedrooms

Vintage Spacious w/ Private Pool House in Mcallen
Entire Place • 4 bedrooms

Spacious Home with Pool & Top Host!
Entire Place • 3 bedrooms
Note: Performance varies based on location, size, amenities, seasonality, and management quality. Data reflects the past 12 months.
Top Performing Airbnb Hosts in McAllen (2026)
Learn from the best! This table showcases top-performing Airbnb hosts in McAllen based on the number of properties managed and estimated total revenue over the past year. Analyze their scale and performance metrics.
| Host Name | Properties | Grossing Revenue | Stay Reviews | Avg Rating |
|---|---|---|---|---|
| Daniel | 12 | $351,102 | 1663 | 4.90/5.0 |
| Urbana | 28 | $260,713 | 1877 | 4.64/5.0 |
| Carlos | 11 | $202,512 | 486 | 4.62/5.0 |
| Armando | 8 | $122,856 | 410 | 4.96/5.0 |
| Lynda | 3 | $111,440 | 133 | 4.75/5.0 |
| Alejandra | 8 | $110,495 | 181 | 4.96/5.0 |
| Juan | 11 | $109,867 | 433 | 4.84/5.0 |
| Eduardo | 7 | $102,074 | 1192 | 4.97/5.0 |
| Josué | 6 | $93,807 | 354 | 4.86/5.0 |
| Stephanie | 3 | $88,503 | 218 | 4.89/5.0 |
Analyzing the strategies of top hosts, such as their property selection, pricing, and guest communication, can offer valuable lessons for optimizing your own Airbnb operations in McAllen.
Dive Deeper: Advanced McAllen STR Market Data (2026)
Ready to unlock more insights? AirROI provides access to advanced metrics and comprehensive Airbnb data for McAllen. Explore detailed analytics beyond this report to refine your investment strategy, optimize pricing, and maximize your vacation rental profits.
Explore Advanced MetricsMcAllen Short-Term Rental Market Composition (2026): Property & Room Types
Room Type Distribution
Property Type Distribution
Market Composition Insights for McAllen
- The McAllen Airbnb market composition is heavily skewed towards Entire Home/Apt listings, which make up 92.6% of the 484 active rentals. This indicates strong guest preference for privacy and space.
- Looking at the property type distribution in McAllen, House properties are the most common (52.1%), reflecting the local real estate landscape.
- Houses represent a significant 52.1% portion, catering likely to families or larger groups.
- Smaller segments like others, hotel/boutique, outdoor/unique (combined 7.7%) offer potential for unique stay experiences.
McAllen Airbnb Room Capacity Analysis (2026): Bedroom Distribution
Distribution of Listings by Number of Bedrooms
Room Capacity Insights for McAllen
- The dominant room capacity in McAllen is 3 bedrooms listings, making up 31% of the market. This suggests a strong demand for properties suitable for families or small groups.
- Together, 3 bedrooms and 2 bedrooms properties represent 61.8% of the active Airbnb listings in McAllen, indicating a high concentration in these sizes.
- A significant 43.4% of listings offer 3+ bedrooms, catering to larger groups and families seeking more space in McAllen.
McAllen Vacation Rental Guest Capacity Trends (2026)
Distribution of Listings by Guest Capacity
Guest Capacity Insights for McAllen
- The most common guest capacity trend in McAllen vacation rentals is listings accommodating 8+ guests (25.8%). This suggests the primary traveler segment is likely larger groups.
- Properties designed for 8+ guests and 6 guests dominate the McAllen STR market, accounting for 46.9% of listings.
- 52.9% of properties accommodate 6+ guests, serving the market segment for larger families or group travel in McAllen.
- On average, properties in McAllen are equipped to host 5.2 guests.
McAllen Airbnb Booking Patterns (2026): Available vs. Booked Days
Available Days Distribution
Booked Days Distribution
Booking Pattern Insights for McAllen
- The most common availability pattern in McAllen falls within the 271-366 days range, representing 52.7% of listings. This suggests many properties have significant open periods on their calendars.
- Approximately 85.6% of listings show high availability (181+ days open annually), indicating potential for increased bookings or specific owner usage patterns.
- For booked days, the 91-180 days range is most frequent in McAllen (34.7%), reflecting common guest stay durations or potential owner blocking patterns.
- A notable 14.8% of properties secure long booking periods (181+ days booked per year), highlighting successful long-term rental strategies or significant owner usage.
McAllen Airbnb Minimum Stay Requirements Analysis
Distribution of Listings by Minimum Night Requirement
1 Night
198 listings
40.9% of total
2 Nights
141 listings
29.1% of total
3 Nights
25 listings
5.2% of total
4-6 Nights
9 listings
1.9% of total
7-29 Nights
18 listings
3.7% of total
30+ Nights
93 listings
19.2% of total
Key Insights
- The most prevalent minimum stay requirement in McAllen is 1 Night, adopted by 40.9% of listings. This highlights the market's preference for shorter, flexible bookings.
- A strong majority (70.0%) of the McAllen Airbnb data shows acceptance of very short stays (1-2 nights), indicating a dynamic, high-turnover market.
- A significant segment (19.2%) caters to monthly stays (30+ nights) in McAllen, pointing to opportunities in the extended-stay market.
Recommendations
- Align with the market by considering a 1 Night minimum stay, as 40.9% of McAllen hosts use this setting.
- Explore offering discounts for stays of 30+ nights to attract the 19.2% of the market seeking extended stays.
- Adjust minimum nights based on seasonality – potentially shorter during low season and longer during peak demand periods in McAllen.
McAllen Airbnb Cancellation Policy Trends Analysis (2026)
Limited
1 listings
0.2% of total
Flexible
191 listings
39.5% of total
Moderate
112 listings
23.1% of total
Firm
146 listings
30.2% of total
Strict
34 listings
7% of total
Cancellation Policy Insights for McAllen
- The prevailing Airbnb cancellation policy trend in McAllen is Flexible, used by 39.5% of listings.
- There's a relatively balanced mix between guest-friendly (62.6%) and stricter (37.2%) policies, offering choices for different guest needs.
- Strict cancellation policies are quite rare (7%), potentially making listings with this policy less competitive unless justified by high demand or property type.
Recommendations for Hosts
- Consider adopting a Flexible policy to align with the 39.5% market standard in McAllen.
- Using a Strict policy might deter some guests, as only 7% of listings use it. Evaluate if potential revenue protection outweighs possible lower booking rates.
- Regularly review your cancellation policy against competitors and market demand shifts in McAllen.
McAllen STR Booking Lead Time Analysis (2026)
Average Booking Lead Time by Month
Booking Lead Time Insights for McAllen
- The overall average booking lead time for vacation rentals in McAllen is 19 days.
- Guests book furthest in advance for stays during December (average 27 days), likely coinciding with peak travel demand or local events.
- The shortest booking windows occur for stays in August (average 12 days), indicating more last-minute travel plans during this time.
- Seasonally, Winter (23 days avg.) sees the longest lead times, while Summer (15 days avg.) has the shortest, reflecting typical travel planning cycles.
Recommendations for Hosts
- Use the overall average lead time (19 days) as a baseline for your pricing and availability strategy in McAllen.
- Target marketing efforts for the Winter season well in advance (at least 23 days) to capture early planners.
- Monitor your own booking lead times against these McAllen averages to identify opportunities for dynamic pricing adjustments.
Popular & Essential Airbnb Amenities in McAllen (2026)
Amenity Prevalence
Amenity Insights for McAllen
- Essential amenities in McAllen that guests expect include: Air conditioning, TV, Free parking on premises, Wifi, Kitchen. Lacking these (any) could significantly impact bookings.
- Popular amenities like Smoke alarm, Hot water, Heating are common but not universal. Offering these can provide a competitive edge.
Recommendations for Hosts
- Ensure your listing includes all essential amenities for McAllen: Air conditioning, TV, Free parking on premises, Wifi, Kitchen.
- Prioritize adding missing essentials: Air conditioning, TV, Free parking on premises, Wifi, Kitchen.
- Consider adding popular differentiators like Smoke alarm or Hot water to increase appeal.
- Highlight unique or less common amenities you offer (e.g., hot tub, dedicated workspace, EV charger) in your listing description and photos.
- Regularly check competitor amenities in McAllen to stay competitive.
McAllen Airbnb Guest Demographics & Profile Analysis (2026)
Guest Profile Summary for McAllen
- The typical guest profile for Airbnb in McAllen consists of primarily domestic travelers (66%), often arriving from nearby Monterrey, typically belonging to the Post-2000s (Gen Z/Alpha) group (50%), primarily speaking English or Spanish.
- Domestic travelers account for 65.7% of guests.
- Key international markets include United States (65.7%) and Mexico (32.3%).
- Top languages spoken are English (50.3%) followed by Spanish (42.7%).
- A significant demographic segment is the Post-2000s (Gen Z/Alpha) group, representing 50% of guests.
Recommendations for Hosts
- Target domestic marketing efforts towards travelers from Monterrey and Houston.
- Tailor amenities and listing descriptions to appeal to the dominant Post-2000s (Gen Z/Alpha) demographic (e.g., highlight fast WiFi, smart home features, local guides).
- Highlight unique local experiences or amenities relevant to the primary guest profile.
- Consider seasonal promotions aligned with peak travel times for key origin markets.
Nearby Short-Term Rental Market Comparison
How does the McAllen Airbnb market stack up against its neighbors? Compare key performance metrics like average monthly revenue, ADR, and occupancy rates in surrounding areas to understand the broader regional STR landscape.
| Market | Active Properties | Monthly Revenue | Daily Rate | Avg. Occupancy |
|---|---|---|---|---|
| City-by-the Sea | 24 | $4,479 | $520.08 | 35% |
| Port Aransas | 2,361 | $3,422 | $437.85 | 34% |
| South Padre Island | 2,347 | $2,957 | $341.64 | 36% |
| Port Mansfield | 29 | $2,788 | $374.59 | 32% |
| Alton | 13 | $2,484 | $392.58 | 23% |
| Rio Hondo | 46 | $2,381 | $309.67 | 31% |
| Port Isabel | 249 | $2,138 | $253.87 | 38% |
| Portland | 10 | $2,123 | $239.57 | 50% |
| Corpus Christi | 1,950 | $2,047 | $224.99 | 39% |
| Kingsville | 16 | $2,008 | $152.10 | 46% |