Marfa Airbnb Market Analysis 2026: Short Term Rental Data & Vacation Rental Statistics in Texas, United States
Is Airbnb profitable in Marfa in 2026? Explore comprehensive Airbnb analytics for Marfa, Texas, United States to uncover income potential. This 2026 STR market report for Marfa, based on AirROI data from February 2025 to January 2026, reveals key trends in the market of 206 active listings.
Whether you're considering an Airbnb investment in Marfa, optimizing your existing vacation rental, or exploring rental arbitrage opportunities, understanding the Marfa Airbnb data is crucial. Leveraging the low regulation environment is key to maximizing your short term rental income potential. Let's dive into the specifics.
Key Marfa Airbnb Performance Metrics Overview
Monthly Airbnb Revenue Variations & Income Potential in Marfa (2026)
Understanding the monthly revenue variations for Airbnb listings in Marfa is key to maximizing your short term rental income potential. Seasonality significantly impacts earnings. Our analysis, based on data from the past 12 months, shows that the peak revenue month for STRs in Marfa is typically October, while January often presents the lowest earnings, highlighting opportunities for strategic pricing adjustments during shoulder and low seasons. Explore the typical Airbnb income in Marfa across different performance tiers:
- Best-in-class properties (Top 10%) achieve $5,497+ monthly, often utilizing dynamic pricing and superior guest experiences.
- Strong performing properties (Top 25%) earn $3,465 or more, indicating effective management and desirable locations/amenities.
- Typical properties (Median) generate around $2,068 per month, representing the average market performance.
- Entry-level properties (Bottom 25%) see earnings around $1,074, often with potential for optimization.
Average Monthly Airbnb Earnings Trend in Marfa
Marfa Airbnb Occupancy Rate Trends (2026)
Maximize your bookings by understanding the Marfa STR occupancy trends. Seasonal demand shifts significantly influence how often properties are booked. Typically, Octobersees the highest demand (peak season occupancy), while January experiences the lowest (low season). Effective strategies, like adjusting minimum stays or offering promotions, can boost occupancy during slower periods. Here's how different property tiers perform in Marfa:
- Best-in-class properties (Top 10%) achieve 71%+ occupancy, indicating high desirability and potentially optimized availability.
- Strong performing properties (Top 25%) maintain 54% or higher occupancy, suggesting good market fit and guest satisfaction.
- Typical properties (Median) have an occupancy rate around 37%.
- Entry-level properties (Bottom 25%) average 24% occupancy, potentially facing higher vacancy.
Average Monthly Occupancy Rate Trend in Marfa
Average Daily Rate (ADR) Airbnb Trends in Marfa (2026)
Effective short term rental pricing strategy in Marfa involves understanding monthly ADR fluctuations. The Average Daily Rate (ADR) for Airbnb in Marfa typically peaks in October and dips lowest during February. Leveraging Airbnb dynamic pricing tools or strategies based on this seasonality can significantly boost revenue. Here's a look at the typical nightly rates achieved:
- Best-in-class properties (Top 10%) command rates of $404+ per night, often due to premium features or locations.
- Strong performing properties (Top 25%) achieve nightly rates of $232 or more.
- Typical properties (Median) charge around $173 per night.
- Entry-level properties (Bottom 25%) earn around $127 per night.
Average Daily Rate (ADR) Trend by Month in Marfa
Get Live Marfa Market Intelligence 👇

Explore Real-time Analytics
Airbnb Seasonality Analysis & Trends in Marfa (2026)
Peak Season (October, March, November)
- Revenue averages $3,747 per month
- Occupancy rates average 50.5%
- Daily rates average $250
Shoulder Season
- Revenue averages $2,799 per month
- Occupancy maintains around 38.4%
- Daily rates hold near $233
Low Season (January, February, August)
- Revenue drops to average $2,129 per month
- Occupancy decreases to average 32.5%
- Daily rates adjust to average $227
Seasonality Insights for Marfa
- The Airbnb seasonality in Marfa shows highly seasonal trends requiring careful strategy. While the sections above show seasonal averages, it's also insightful to look at the extremes:
- During the high season, the absolute peak month showcases Marfa's highest earning potential, with monthly revenues capable of climbing to $4,417, occupancy reaching a high of 55.4%, and ADRs peaking at $265.
- Conversely, the slowest single month of the year, typically falling within the low season, marks the market's lowest point. In this month, revenue might dip to $2,035, occupancy could drop to 29.6%, and ADRs may adjust down to $213.
- Understanding both the seasonal averages and these monthly peaks and troughs in revenue, occupancy, and ADR is crucial for maximizing your Airbnb profit potential in Marfa.
Seasonal Strategies for Maximizing Profit
- Peak Season: Maximize revenue through premium pricing and potentially longer minimum stays. Ensure high availability.
- Low Season: Offer competitive pricing, special promotions (e.g., extended stay discounts), and flexible cancellation policies. Target off-season travelers like remote workers or budget-conscious guests.
- Shoulder Seasons: Implement dynamic pricing that balances peak and low rates. Target weekend travelers or specific events. Offer slightly more flexible terms than peak season.
- Regularly analyze your own performance against these Marfa seasonality benchmarks and adjust your pricing and availability strategy accordingly.
Best Areas for Airbnb Investment in Marfa (2026)
Exploring the top neighborhoods for short-term rentals in Marfa? This section highlights key areas, outlining why they are attractive for hosts and guests, along with notable local attractions. Consider these locations based on your target guest profile and investment strategy.
| Neighborhood / Area | Why Host Here? (Target Guests & Appeal) | Key Attractions & Landmarks |
|---|---|---|
| Marfa Downtown | The heart of Marfa, known for its vibrant arts scene, restaurants, and shops. Visitors enjoy close proximity to galleries and cultural events, making it a popular spot for those seeking the unique vibe of Marfa. | Chinati Foundation, Marfa Lights Viewing Area, Marfa Book Company, The Do Your Own Thing Gallery, El Cosmico |
| East Marfa | A quieter residential area with beautiful views of the surrounding landscapes. Ideal for guests seeking a peaceful retreat while still being close to town attractions. | Marfa Film Festival, Desert Botanical Garden, Local artist studios, Scenic viewpoints |
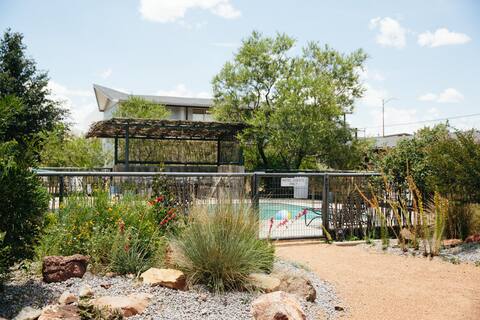
| West Marfa | Known for its stunning high desert views, West Marfa offers visitors a chance to experience the vast Texas landscape. Attractive for glamping and outdoor enthusiasts looking to escape the city. | Big Bend National Park, Marfa Prada Store, Scenic drive to Alpine, Outdoor art installations |
| Marfa Lights Viewing Area | Famous for the mysterious lights that appear in the desert, it attracts tourists interested in the paranormal and natural phenomena. Unique location for unique experiences. | Marfa Lights Viewing Area, Nearby campsites, Star gazing spots |
| Ranch Road | Scenic route with access to beautiful ranches and natural settings. Ideal for guests looking to experience western lifestyle and outdoor activities. | Local ranch tours, Horseback riding, Stargazing opportunities |
| Near Chinati Hot Springs | Offers a relaxing getaway with access to natural hot springs. Perfect for guests seeking wellness and relaxation. | Chinati Hot Springs, Natural scenery, Hiking trails |
| Marfa Airport Area | Convenient for travelers using the small airport in Marfa. Also attracts aviation enthusiasts and offers a unique stay surrounded by the open sky. | Airplane viewing, Nearby hiking, Open air museums |
| Brewster County | Larger area encompassing Marfa, offering diverse landscapes and attractions. Great for guests looking to explore the greater West Texas region. | Big Bend National Park, Local wildlife viewing, Historic sites in Marfa |
Understanding Airbnb License Requirements & STR Laws in Marfa (2026)
While Marfa, Texas, United States currently shows low STR regulations, specific Airbnb license requirements might still exist or change. Always verify the latest short term rental regulations and Airbnb license requirements directly with local government authorities for Marfa to ensure full compliance before hosting.
(Source: AirROI data, 2026, finding no licensed listings among those analyzed)
Top Performing Airbnb Properties in Marfa (2026)
Benchmark your potential! Explore examples of top-performing Airbnb properties in Marfabased on Trailing Twelve Month (TTM) revenue. Analyze their characteristics, revenue, occupancy rate, and ADR to understand what drives success in this market.
Whole hotel for rent 23 rooms.
Private Room • 23 bedrooms
Friedman Ranch
Entire Place • 3 bedrooms

The Dean House on 2 Acres with a Barn - Marfa Gem.
Entire Place • 3 bedrooms
Bohemio Rebel: Entire Lodge
Entire Place • 4 bedrooms
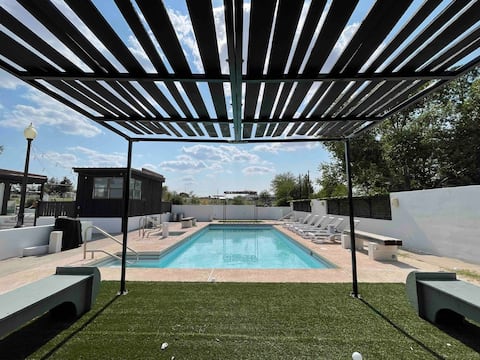
Marfa Desert Pool Villa - 3BR
Entire Place • 3 bedrooms
Dickson Marfa House
Entire Place • 7 bedrooms
Note: Performance varies based on location, size, amenities, seasonality, and management quality. Data reflects the past 12 months.
Top Performing Airbnb Hosts in Marfa (2026)
Learn from the best! This table showcases top-performing Airbnb hosts in Marfa based on the number of properties managed and estimated total revenue over the past year. Analyze their scale and performance metrics.
| Host Name | Properties | Grossing Revenue | Stay Reviews | Avg Rating |
|---|---|---|---|---|
| Trans Pecos Property Managemen | 56 | $2,034,487 | 4904 | 4.91/5.0 |
| Sondra | 8 | $424,863 | 674 | 4.71/5.0 |
| Ylana | 10 | $275,608 | 1670 | 4.89/5.0 |
| Clark & Adam | 6 | $171,362 | 1333 | 4.95/5.0 |
| Simone | 2 | $166,520 | 48 | 4.95/5.0 |
| The Marfa Stay | 5 | $160,573 | 1035 | 4.96/5.0 |
| Jared | 5 | $136,484 | 81 | 4.96/5.0 |
| The Hotel Paisano | 4 | $134,499 | 15 | 4.67/5.0 |
| Jacqueline | 4 | $129,876 | 641 | 4.96/5.0 |
| Lawrence | 2 | $128,598 | 102 | 4.89/5.0 |
Analyzing the strategies of top hosts, such as their property selection, pricing, and guest communication, can offer valuable lessons for optimizing your own Airbnb operations in Marfa.
Dive Deeper: Advanced Marfa STR Market Data (2026)
Ready to unlock more insights? AirROI provides access to advanced metrics and comprehensive Airbnb data for Marfa. Explore detailed analytics beyond this report to refine your investment strategy, optimize pricing, and maximize your vacation rental profits.
Explore Advanced MetricsMarfa Short-Term Rental Market Composition (2026): Property & Room Types
Room Type Distribution
Property Type Distribution
Market Composition Insights for Marfa
- The Marfa Airbnb market composition is heavily skewed towards Entire Home/Apt listings, which make up 85.9% of the 206 active rentals. This indicates strong guest preference for privacy and space.
- Looking at the property type distribution in Marfa, House properties are the most common (62.1%), reflecting the local real estate landscape.
- Houses represent a significant 62.1% portion, catering likely to families or larger groups.
- The presence of 14.1% Hotel/Boutique listings indicates integration with traditional hospitality.
- Smaller segments like outdoor/unique, unique stays (combined 8.3%) offer potential for unique stay experiences.
Marfa Airbnb Room Capacity Analysis (2026): Bedroom Distribution
Distribution of Listings by Number of Bedrooms
Room Capacity Insights for Marfa
- The dominant room capacity in Marfa is 1 bedroom listings, making up 46.1% of the market. This suggests a strong demand for properties suitable for couples or solo travelers.
- Together, 1 bedroom and 2 bedrooms properties represent 70.9% of the active Airbnb listings in Marfa, indicating a high concentration in these sizes.
- A significant 21.3% of listings offer 3+ bedrooms, catering to larger groups and families seeking more space in Marfa.
Marfa Vacation Rental Guest Capacity Trends (2026)
Distribution of Listings by Guest Capacity
Guest Capacity Insights for Marfa
- The most common guest capacity trend in Marfa vacation rentals is listings accommodating 2 guests (34.5%). This suggests the primary traveler segment is likely couples or solo travelers.
- Properties designed for 2 guests and 4 guests dominate the Marfa STR market, accounting for 58.3% of listings.
- 23.8% of properties accommodate 6+ guests, serving the market segment for larger families or group travel in Marfa.
- On average, properties in Marfa are equipped to host 3.9 guests.
Marfa Airbnb Booking Patterns (2026): Available vs. Booked Days
Available Days Distribution
Booked Days Distribution
Booking Pattern Insights for Marfa
- The most common availability pattern in Marfa falls within the 181-270 days range, representing 44.7% of listings. This suggests many properties have significant open periods on their calendars.
- Approximately 78.7% of listings show high availability (181+ days open annually), indicating potential for increased bookings or specific owner usage patterns.
- For booked days, the 91-180 days range is most frequent in Marfa (46.6%), reflecting common guest stay durations or potential owner blocking patterns.
- A notable 21.4% of properties secure long booking periods (181+ days booked per year), highlighting successful long-term rental strategies or significant owner usage.
Marfa Airbnb Minimum Stay Requirements Analysis
Distribution of Listings by Minimum Night Requirement
1 Night
83 listings
40.3% of total
2 Nights
74 listings
35.9% of total
3 Nights
6 listings
2.9% of total
7-29 Nights
1 listings
0.5% of total
30+ Nights
42 listings
20.4% of total
Key Insights
- The most prevalent minimum stay requirement in Marfa is 1 Night, adopted by 40.3% of listings. This highlights the market's preference for shorter, flexible bookings.
- A strong majority (76.2%) of the Marfa Airbnb data shows acceptance of very short stays (1-2 nights), indicating a dynamic, high-turnover market.
- A significant segment (20.4%) caters to monthly stays (30+ nights) in Marfa, pointing to opportunities in the extended-stay market.
Recommendations
- Align with the market by considering a 1 Night minimum stay, as 40.3% of Marfa hosts use this setting.
- Explore offering discounts for stays of 30+ nights to attract the 20.4% of the market seeking extended stays.
- Adjust minimum nights based on seasonality – potentially shorter during low season and longer during peak demand periods in Marfa.
Marfa Airbnb Cancellation Policy Trends Analysis (2026)
Super Strict 30 Days
1 listings
0.5% of total
Limited
1 listings
0.5% of total
Flexible
23 listings
11.2% of total
Moderate
103 listings
50% of total
Firm
58 listings
28.2% of total
Strict
20 listings
9.7% of total
Cancellation Policy Insights for Marfa
- The prevailing Airbnb cancellation policy trend in Marfa is Moderate, used by 50% of listings.
- There's a relatively balanced mix between guest-friendly (61.2%) and stricter (37.9%) policies, offering choices for different guest needs.
- Strict cancellation policies are quite rare (9.7%), potentially making listings with this policy less competitive unless justified by high demand or property type.
Recommendations for Hosts
- Consider adopting a Moderate policy to align with the 50% market standard in Marfa.
- Using a Strict policy might deter some guests, as only 9.7% of listings use it. Evaluate if potential revenue protection outweighs possible lower booking rates.
- Regularly review your cancellation policy against competitors and market demand shifts in Marfa.
Marfa STR Booking Lead Time Analysis (2026)
Average Booking Lead Time by Month
Booking Lead Time Insights for Marfa
- The overall average booking lead time for vacation rentals in Marfa is 43 days.
- Guests book furthest in advance for stays during October (average 83 days), likely coinciding with peak travel demand or local events.
- The shortest booking windows occur for stays in February (average 24 days), indicating more last-minute travel plans during this time.
- Seasonally, Fall (63 days avg.) sees the longest lead times, while Winter (30 days avg.) has the shortest, reflecting typical travel planning cycles.
Recommendations for Hosts
- Use the overall average lead time (43 days) as a baseline for your pricing and availability strategy in Marfa.
- For October stays, consider implementing length-of-stay discounts or slightly higher rates for bookings made less than 83 days out to capitalize on advance planning.
- Target marketing efforts for the Fall season well in advance (at least 63 days) to capture early planners.
- Monitor your own booking lead times against these Marfa averages to identify opportunities for dynamic pricing adjustments.
Popular & Essential Airbnb Amenities in Marfa (2026)
Amenity Prevalence
Amenity Insights for Marfa
- Essential amenities in Marfa that guests expect include: Heating, Wifi, Air conditioning, Smoke alarm, Hot water. Lacking these (any) could significantly impact bookings.
- Popular amenities like Shampoo, Coffee maker, Bed linens are common but not universal. Offering these can provide a competitive edge.
Recommendations for Hosts
- Ensure your listing includes all essential amenities for Marfa: Heating, Wifi, Air conditioning, Smoke alarm, Hot water.
- Prioritize adding missing essentials: Heating, Wifi, Air conditioning, Smoke alarm, Hot water.
- Consider adding popular differentiators like Shampoo or Coffee maker to increase appeal.
- Highlight unique or less common amenities you offer (e.g., hot tub, dedicated workspace, EV charger) in your listing description and photos.
- Regularly check competitor amenities in Marfa to stay competitive.
Marfa Airbnb Guest Demographics & Profile Analysis (2026)
Guest Profile Summary for Marfa
- The typical guest profile for Airbnb in Marfa consists of primarily domestic travelers (95%), often arriving from nearby Austin, typically belonging to the Post-2000s (Gen Z/Alpha) group (50%), primarily speaking English or Spanish.
- Domestic travelers account for 94.6% of guests.
- Key international markets include United States (94.6%) and DC (0.9%).
- Top languages spoken are English (63.1%) followed by Spanish (20.2%).
- A significant demographic segment is the Post-2000s (Gen Z/Alpha) group, representing 50% of guests.
Recommendations for Hosts
- Target domestic marketing efforts towards travelers from Austin and Houston.
- Tailor amenities and listing descriptions to appeal to the dominant Post-2000s (Gen Z/Alpha) demographic (e.g., highlight fast WiFi, smart home features, local guides).
- Highlight unique local experiences or amenities relevant to the primary guest profile.
- Consider seasonal promotions aligned with peak travel times for key origin markets.
Nearby Short-Term Rental Market Comparison
How does the Marfa Airbnb market stack up against its neighbors? Compare key performance metrics like average monthly revenue, ADR, and occupancy rates in surrounding areas to understand the broader regional STR landscape.
| Market | Active Properties | Monthly Revenue | Daily Rate | Avg. Occupancy |
|---|---|---|---|---|
| Terlingua | 311 | $2,964 | $223.50 | 44% |
| Marathon | 29 | $2,796 | $240.85 | 41% |
| Alpine | 165 | $2,182 | $185.43 | 44% |
| Study Butte | 61 | $2,128 | $211.98 | 39% |
| Fort Davis | 66 | $2,015 | $243.37 | 35% |
| Brewster County | 15 | $1,974 | $188.47 | 41% |
| Dell City | 14 | $1,296 | $131.51 | 35% |
| Presidio | 20 | $1,027 | $154.66 | 27% |
| Pecos | 15 | $857 | $132.16 | 34% |
| Juárez | 120 | $439 | $63.14 | 36% |