Manchaca Airbnb Market Analysis 2026: Short Term Rental Data & Vacation Rental Statistics in Texas, United States
Is Airbnb profitable in Manchaca in 2026? Explore comprehensive Airbnb analytics for Manchaca, Texas, United States to uncover income potential. This 2026 STR market report for Manchaca, based on AirROI data from February 2025 to January 2026, reveals key trends in the niche market of 44 active listings.
Whether you're considering an Airbnb investment in Manchaca, optimizing your existing vacation rental, or exploring rental arbitrage opportunities, understanding the Manchaca Airbnb data is crucial. Leveraging the low regulation environment is key to maximizing your short term rental income potential. Let's dive into the specifics.
Key Manchaca Airbnb Performance Metrics Overview
Monthly Airbnb Revenue Variations & Income Potential in Manchaca (2026)
Understanding the monthly revenue variations for Airbnb listings in Manchaca is key to maximizing your short term rental income potential. Seasonality significantly impacts earnings. Our analysis, based on data from the past 12 months, shows that the peak revenue month for STRs in Manchaca is typically March, while January often presents the lowest earnings, highlighting opportunities for strategic pricing adjustments during shoulder and low seasons. Explore the typical Airbnb income in Manchaca across different performance tiers:
- Best-in-class properties (Top 10%) achieve $7,337+ monthly, often utilizing dynamic pricing and superior guest experiences.
- Strong performing properties (Top 25%) earn $3,439 or more, indicating effective management and desirable locations/amenities.
- Typical properties (Median) generate around $1,948 per month, representing the average market performance.
- Entry-level properties (Bottom 25%) see earnings around $924, often with potential for optimization.
Average Monthly Airbnb Earnings Trend in Manchaca
Manchaca Airbnb Occupancy Rate Trends (2026)
Maximize your bookings by understanding the Manchaca STR occupancy trends. Seasonal demand shifts significantly influence how often properties are booked. Typically, Marchsees the highest demand (peak season occupancy), while January experiences the lowest (low season). Effective strategies, like adjusting minimum stays or offering promotions, can boost occupancy during slower periods. Here's how different property tiers perform in Manchaca:
- Best-in-class properties (Top 10%) achieve 72%+ occupancy, indicating high desirability and potentially optimized availability.
- Strong performing properties (Top 25%) maintain 53% or higher occupancy, suggesting good market fit and guest satisfaction.
- Typical properties (Median) have an occupancy rate around 35%.
- Entry-level properties (Bottom 25%) average 20% occupancy, potentially facing higher vacancy.
Average Monthly Occupancy Rate Trend in Manchaca
Average Daily Rate (ADR) Airbnb Trends in Manchaca (2026)
Effective short term rental pricing strategy in Manchaca involves understanding monthly ADR fluctuations. The Average Daily Rate (ADR) for Airbnb in Manchaca typically peaks in October and dips lowest during February. Leveraging Airbnb dynamic pricing tools or strategies based on this seasonality can significantly boost revenue. Here's a look at the typical nightly rates achieved:
- Best-in-class properties (Top 10%) command rates of $553+ per night, often due to premium features or locations.
- Strong performing properties (Top 25%) achieve nightly rates of $286 or more.
- Typical properties (Median) charge around $176 per night.
- Entry-level properties (Bottom 25%) earn around $121 per night.
Average Daily Rate (ADR) Trend by Month in Manchaca
Get Live Manchaca Market Intelligence 👇

Explore Real-time Analytics
Airbnb Seasonality Analysis & Trends in Manchaca (2026)
Peak Season (March, July, June)
- Revenue averages $4,874 per month
- Occupancy rates average 42.3%
- Daily rates average $271
Shoulder Season
- Revenue averages $3,808 per month
- Occupancy maintains around 39.7%
- Daily rates hold near $266
Low Season (January, February, September)
- Revenue drops to average $2,458 per month
- Occupancy decreases to average 30.5%
- Daily rates adjust to average $252
Seasonality Insights for Manchaca
- The Airbnb seasonality in Manchaca shows highly seasonal trends requiring careful strategy. While the sections above show seasonal averages, it's also insightful to look at the extremes:
- During the high season, the absolute peak month showcases Manchaca's highest earning potential, with monthly revenues capable of climbing to $5,326, occupancy reaching a high of 52.7%, and ADRs peaking at $292.
- Conversely, the slowest single month of the year, typically falling within the low season, marks the market's lowest point. In this month, revenue might dip to $1,840, occupancy could drop to 26.3%, and ADRs may adjust down to $234.
- Understanding both the seasonal averages and these monthly peaks and troughs in revenue, occupancy, and ADR is crucial for maximizing your Airbnb profit potential in Manchaca.
Seasonal Strategies for Maximizing Profit
- Peak Season: Maximize revenue through premium pricing and potentially longer minimum stays. Ensure high availability.
- Low Season: Offer competitive pricing, special promotions (e.g., extended stay discounts), and flexible cancellation policies. Target off-season travelers like remote workers or budget-conscious guests.
- Shoulder Seasons: Implement dynamic pricing that balances peak and low rates. Target weekend travelers or specific events. Offer slightly more flexible terms than peak season.
- Regularly analyze your own performance against these Manchaca seasonality benchmarks and adjust your pricing and availability strategy accordingly.
Best Areas for Airbnb Investment in Manchaca (2026)
Exploring the top neighborhoods for short-term rentals in Manchaca? This section highlights key areas, outlining why they are attractive for hosts and guests, along with notable local attractions. Consider these locations based on your target guest profile and investment strategy.
| Neighborhood / Area | Why Host Here? (Target Guests & Appeal) | Key Attractions & Landmarks |
|---|---|---|
| Manchaca Village | A cozy suburban community with a small-town feel and proximity to Austin. Ideal for families and individuals looking for a peaceful stay while being close to city amenities. | Manchaca Park, local eateries, nearby nature trails, Austin's vibrant south side, live music venues |
| South Manchaca | A residential area close to major highways making it convenient for travelers to access downtown Austin and surrounding attractions. Great for those seeking a balance between urban and suburban living. | Nearby parks, restaurants, shopping centers, quick access to downtown Austin |
| Circle C Ranch | A family-friendly neighborhood known for its great schools and community amenities. Attracts families and business travelers looking for a comfortable stay in Austin's outskirts. | Circle C Golf Club, parks and trails, popular family restaurants, community events |
| Buda | Just a short drive from Manchaca, Buda offers a quaint downtown area and is known for its laid-back atmosphere. Great for those looking to experience Texas charm with convenient access to Austin. | Historic downtown Buda, Buda Mill & Grain Co., local markets, Patsy’s Cowgirl Café, Pioneer Park |
| Kyle | Another nearby suburb featuring affordable housing and a growing community. Ideal for budget-conscious travelers who want to explore both Manchaca and Austin. | Lake Kyle, local shops, dining options, Kyle Market Days, Buda's nearby attractions |
| Southwest Austin | An area characterized by its mix of residential, commercial, and natural spaces. Great for those who want to enjoy the outdoors and still experience the city life. | Lady Bird Johnson Wildflower Center, homespun craft shops, local breweries, food trucks, entertainment options |
| Dripping Springs | Famous for its wineries and scenic beauty, Dripping Springs is a bit further out but offers a unique retreat experience for those who love nature and outdoor activities. | Dripping Springs Vodka, local vineyards, Hamilton Pool Preserve, natural swimming holes, outdoor festivals |
| Downtown Austin | Although not in Manchaca, downtown Austin is a top destination for tourists and business travelers. Short distances make it a competitive option for Airbnb hosts in nearby areas. | Texas State Capitol, live music venues, restaurants and bars, Austin Convention Center, shopping options |
Understanding Airbnb License Requirements & STR Laws in Manchaca (2026)
While Manchaca, Texas, United States currently shows low STR regulations, specific Airbnb license requirements might still exist or change. Always verify the latest short term rental regulations and Airbnb license requirements directly with local government authorities for Manchaca to ensure full compliance before hosting.
(Source: AirROI data, 2026, finding no licensed listings among those analyzed)
Top Performing Airbnb Properties in Manchaca (2026)
Benchmark your potential! Explore examples of top-performing Airbnb properties in Manchacabased on Trailing Twelve Month (TTM) revenue. Analyze their characteristics, revenue, occupancy rate, and ADR to understand what drives success in this market.
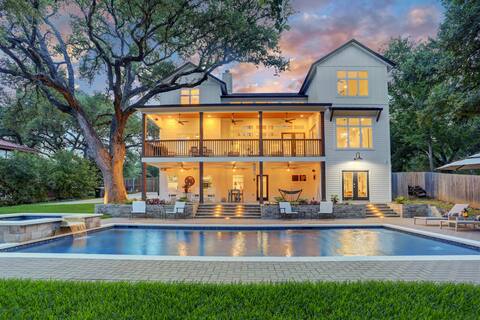
ATX Retreat: Luxe 7BR Creekside Resort, Pool & Spa
Entire Place • 7 bedrooms

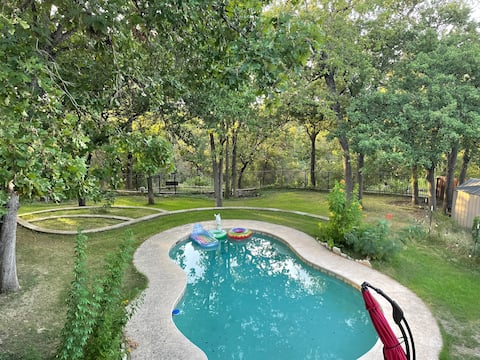
Your OASIS Nestled IN Wooded River Views, POOL!
Entire Place • 3 bedrooms

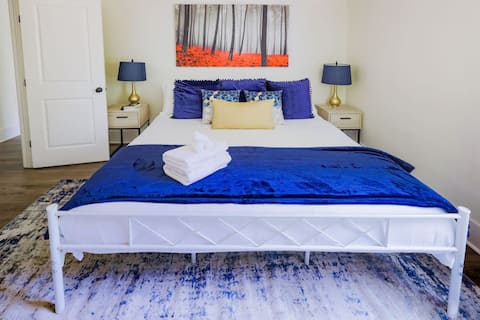
Perfect Austin Getaway! Private pool & Playscape
Entire Place • 5 bedrooms
Pool, 1 Acre, Cave, 5 Bedroom Oasis in S. Austin
Entire Place • 5 bedrooms
Manchaca Meadows | Pool | Spa | Sleeps 10
Entire Place • 4 bedrooms

Big Fun Austin Home-Game Room-Sleeps 12
Entire Place • 4 bedrooms
Note: Performance varies based on location, size, amenities, seasonality, and management quality. Data reflects the past 12 months.
Top Performing Airbnb Hosts in Manchaca (2026)
Learn from the best! This table showcases top-performing Airbnb hosts in Manchaca based on the number of properties managed and estimated total revenue over the past year. Analyze their scale and performance metrics.
| Host Name | Properties | Grossing Revenue | Stay Reviews | Avg Rating |
|---|---|---|---|---|
| Leah | 1 | $458,949 | 95 | 5.00/5.0 |
| Brian | 1 | $127,902 | 133 | 4.99/5.0 |
| Tavia | 1 | $115,336 | 148 | 4.91/5.0 |
| Wendy | 1 | $69,855 | 43 | 4.86/5.0 |
| Pragya | 1 | $66,975 | 58 | 4.79/5.0 |
| Celina | 1 | $57,173 | 37 | 4.97/5.0 |
| Maria | 1 | $55,896 | 93 | 4.94/5.0 |
| Kimberly | 1 | $53,175 | 20 | 4.70/5.0 |
| Julie | 1 | $43,418 | 149 | 4.99/5.0 |
| Stafford | 1 | $40,731 | 100 | 4.91/5.0 |
Analyzing the strategies of top hosts, such as their property selection, pricing, and guest communication, can offer valuable lessons for optimizing your own Airbnb operations in Manchaca.
Dive Deeper: Advanced Manchaca STR Market Data (2026)
Ready to unlock more insights? AirROI provides access to advanced metrics and comprehensive Airbnb data for Manchaca. Explore detailed analytics beyond this report to refine your investment strategy, optimize pricing, and maximize your vacation rental profits.
Explore Advanced MetricsManchaca Short-Term Rental Market Composition (2026): Property & Room Types
Room Type Distribution
Property Type Distribution
Market Composition Insights for Manchaca
- The Manchaca Airbnb market composition is heavily skewed towards Entire Home/Apt listings, which make up 100% of the 44 active rentals. This indicates strong guest preference for privacy and space.
- Looking at the property type distribution in Manchaca, House properties are the most common (52.3%), reflecting the local real estate landscape.
- Houses represent a significant 52.3% portion, catering likely to families or larger groups.
- The presence of 15.9% Hotel/Boutique listings indicates integration with traditional hospitality.
- Smaller segments like others, apartment/condo (combined 6.8%) offer potential for unique stay experiences.
Manchaca Airbnb Room Capacity Analysis (2026): Bedroom Distribution
Distribution of Listings by Number of Bedrooms
Room Capacity Insights for Manchaca
- The dominant room capacity in Manchaca is 1 bedroom listings, making up 34.1% of the market. This suggests a strong demand for properties suitable for couples or solo travelers.
- Together, 1 bedroom and 3 bedrooms properties represent 61.4% of the active Airbnb listings in Manchaca, indicating a high concentration in these sizes.
- A significant 43.2% of listings offer 3+ bedrooms, catering to larger groups and families seeking more space in Manchaca.
Manchaca Vacation Rental Guest Capacity Trends (2026)
Distribution of Listings by Guest Capacity
Guest Capacity Insights for Manchaca
- The most common guest capacity trend in Manchaca vacation rentals is listings accommodating 8+ guests (29.5%). This suggests the primary traveler segment is likely larger groups.
- Properties designed for 8+ guests and 2 guests dominate the Manchaca STR market, accounting for 56.8% of listings.
- 43.1% of properties accommodate 6+ guests, serving the market segment for larger families or group travel in Manchaca.
- On average, properties in Manchaca are equipped to host 4.9 guests.
Manchaca Airbnb Booking Patterns (2026): Available vs. Booked Days
Available Days Distribution
Booked Days Distribution
Booking Pattern Insights for Manchaca
- The most common availability pattern in Manchaca falls within the 181-270 days range, representing 40.9% of listings. This suggests many properties have significant open periods on their calendars.
- Approximately 79.5% of listings show high availability (181+ days open annually), indicating potential for increased bookings or specific owner usage patterns.
- For booked days, the 91-180 days range is most frequent in Manchaca (45.5%), reflecting common guest stay durations or potential owner blocking patterns.
- A notable 20.5% of properties secure long booking periods (181+ days booked per year), highlighting successful long-term rental strategies or significant owner usage.
Manchaca Airbnb Minimum Stay Requirements Analysis
Distribution of Listings by Minimum Night Requirement
1 Night
12 listings
27.3% of total
2 Nights
17 listings
38.6% of total
3 Nights
2 listings
4.5% of total
4-6 Nights
1 listings
2.3% of total
7-29 Nights
1 listings
2.3% of total
30+ Nights
11 listings
25% of total
Key Insights
- The most prevalent minimum stay requirement in Manchaca is 2 Nights, adopted by 38.6% of listings. This highlights the market's preference for shorter, flexible bookings.
- A strong majority (65.9%) of the Manchaca Airbnb data shows acceptance of very short stays (1-2 nights), indicating a dynamic, high-turnover market.
- A significant segment (25%) caters to monthly stays (30+ nights) in Manchaca, pointing to opportunities in the extended-stay market.
Recommendations
- Align with the market by considering a 2 Nights minimum stay, as 38.6% of Manchaca hosts use this setting.
- If feasible, allowing 1-night stays, especially midweek or during low season, could capture last-minute bookings, as only 27.3% currently do.
- Explore offering discounts for stays of 30+ nights to attract the 25% of the market seeking extended stays.
- Adjust minimum nights based on seasonality – potentially shorter during low season and longer during peak demand periods in Manchaca.
Manchaca Airbnb Cancellation Policy Trends Analysis (2026)
Flexible
17 listings
38.6% of total
Moderate
15 listings
34.1% of total
Firm
8 listings
18.2% of total
Strict
4 listings
9.1% of total
Cancellation Policy Insights for Manchaca
- The prevailing Airbnb cancellation policy trend in Manchaca is Flexible, used by 38.6% of listings.
- The market strongly favors guest-friendly terms, with 72.7% of listings offering Flexible or Moderate policies. This suggests guests in Manchaca may expect booking flexibility.
- Strict cancellation policies are quite rare (9.1%), potentially making listings with this policy less competitive unless justified by high demand or property type.
Recommendations for Hosts
- Consider adopting a Flexible policy to align with the 38.6% market standard in Manchaca.
- Using a Strict policy might deter some guests, as only 9.1% of listings use it. Evaluate if potential revenue protection outweighs possible lower booking rates.
- Regularly review your cancellation policy against competitors and market demand shifts in Manchaca.
Manchaca STR Booking Lead Time Analysis (2026)
Average Booking Lead Time by Month
Booking Lead Time Insights for Manchaca
- The overall average booking lead time for vacation rentals in Manchaca is 47 days.
- Guests book furthest in advance for stays during October (average 85 days), likely coinciding with peak travel demand or local events.
- The shortest booking windows occur for stays in January (average 22 days), indicating more last-minute travel plans during this time.
- Seasonally, Fall (70 days avg.) sees the longest lead times, while Winter (29 days avg.) has the shortest, reflecting typical travel planning cycles.
Recommendations for Hosts
- Use the overall average lead time (47 days) as a baseline for your pricing and availability strategy in Manchaca.
- For October stays, consider implementing length-of-stay discounts or slightly higher rates for bookings made less than 85 days out to capitalize on advance planning.
- Target marketing efforts for the Fall season well in advance (at least 70 days) to capture early planners.
- Monitor your own booking lead times against these Manchaca averages to identify opportunities for dynamic pricing adjustments.
Popular & Essential Airbnb Amenities in Manchaca (2026)
Amenity Prevalence
Amenity Insights for Manchaca
- Essential amenities in Manchaca that guests expect include: Free parking on premises, Heating, Wifi, Air conditioning, Hot water. Lacking these (any) could significantly impact bookings.
- Popular amenities like Smoke alarm, Cooking basics, Coffee maker are common but not universal. Offering these can provide a competitive edge.
Recommendations for Hosts
- Ensure your listing includes all essential amenities for Manchaca: Free parking on premises, Heating, Wifi, Air conditioning, Hot water.
- Prioritize adding missing essentials: Hot water.
- Consider adding popular differentiators like Smoke alarm or Cooking basics to increase appeal.
- Highlight unique or less common amenities you offer (e.g., hot tub, dedicated workspace, EV charger) in your listing description and photos.
- Regularly check competitor amenities in Manchaca to stay competitive.
Manchaca Airbnb Guest Demographics & Profile Analysis (2026)
Guest Profile Summary for Manchaca
- The typical guest profile for Airbnb in Manchaca consists of primarily domestic travelers (97%), often arriving from nearby Austin, typically belonging to the Post-2000s (Gen Z/Alpha) group (50%), primarily speaking English or Spanish.
- Domestic travelers account for 96.7% of guests.
- Key international markets include United States (96.7%) and Mexico (1%).
- Top languages spoken are English (63.2%) followed by Spanish (26.5%).
- A significant demographic segment is the Post-2000s (Gen Z/Alpha) group, representing 50% of guests.
Recommendations for Hosts
- Target domestic marketing efforts towards travelers from Austin and Houston.
- Tailor amenities and listing descriptions to appeal to the dominant Post-2000s (Gen Z/Alpha) demographic (e.g., highlight fast WiFi, smart home features, local guides).
- Highlight unique local experiences or amenities relevant to the primary guest profile.
- Consider seasonal promotions aligned with peak travel times for key origin markets.
Nearby Short-Term Rental Market Comparison
How does the Manchaca Airbnb market stack up against its neighbors? Compare key performance metrics like average monthly revenue, ADR, and occupancy rates in surrounding areas to understand the broader regional STR landscape.
| Market | Active Properties | Monthly Revenue | Daily Rate | Avg. Occupancy |
|---|---|---|---|---|
| Hudson Bend | 59 | $5,436 | $611.45 | 31% |
| Jonestown | 60 | $5,240 | $513.31 | 32% |
| Gillespie County | 11 | $4,887 | $351.24 | 59% |
| West Lake Hills | 21 | $4,391 | $656.35 | 34% |
| Helotes | 48 | $4,095 | $322.31 | 42% |
| Kingsland | 255 | $4,055 | $564.92 | 27% |
| Cottonwood Shores | 26 | $4,012 | $408.66 | 35% |
| Round Mountain | 17 | $3,781 | $385.24 | 42% |
| Volente | 19 | $3,627 | $462.89 | 30% |
| Dripping Springs | 403 | $3,493 | $389.50 | 32% |