Magnolia Airbnb Market Analysis 2026: Short Term Rental Data & Vacation Rental Statistics in Texas, United States
Is Airbnb profitable in Magnolia in 2026? Explore comprehensive Airbnb analytics for Magnolia, Texas, United States to uncover income potential. This 2026 STR market report for Magnolia, based on AirROI data from February 2025 to January 2026, reveals key trends in the niche market of 83 active listings.
Whether you're considering an Airbnb investment in Magnolia, optimizing your existing vacation rental, or exploring rental arbitrage opportunities, understanding the Magnolia Airbnb data is crucial. Leveraging the low regulation environment is key to maximizing your short term rental income potential. Let's dive into the specifics.
Key Magnolia Airbnb Performance Metrics Overview
Monthly Airbnb Revenue Variations & Income Potential in Magnolia (2026)
Understanding the monthly revenue variations for Airbnb listings in Magnolia is key to maximizing your short term rental income potential. Seasonality significantly impacts earnings. Our analysis, based on data from the past 12 months, shows that the peak revenue month for STRs in Magnolia is typically July, while January often presents the lowest earnings, highlighting opportunities for strategic pricing adjustments during shoulder and low seasons. Explore the typical Airbnb income in Magnolia across different performance tiers:
- Best-in-class properties (Top 10%) achieve $5,739+ monthly, often utilizing dynamic pricing and superior guest experiences.
- Strong performing properties (Top 25%) earn $3,209 or more, indicating effective management and desirable locations/amenities.
- Typical properties (Median) generate around $1,652 per month, representing the average market performance.
- Entry-level properties (Bottom 25%) see earnings around $951, often with potential for optimization.
Average Monthly Airbnb Earnings Trend in Magnolia
Magnolia Airbnb Occupancy Rate Trends (2026)
Maximize your bookings by understanding the Magnolia STR occupancy trends. Seasonal demand shifts significantly influence how often properties are booked. Typically, Julysees the highest demand (peak season occupancy), while January experiences the lowest (low season). Effective strategies, like adjusting minimum stays or offering promotions, can boost occupancy during slower periods. Here's how different property tiers perform in Magnolia:
- Best-in-class properties (Top 10%) achieve 76%+ occupancy, indicating high desirability and potentially optimized availability.
- Strong performing properties (Top 25%) maintain 58% or higher occupancy, suggesting good market fit and guest satisfaction.
- Typical properties (Median) have an occupancy rate around 37%.
- Entry-level properties (Bottom 25%) average 21% occupancy, potentially facing higher vacancy.
Average Monthly Occupancy Rate Trend in Magnolia
Average Daily Rate (ADR) Airbnb Trends in Magnolia (2026)
Effective short term rental pricing strategy in Magnolia involves understanding monthly ADR fluctuations. The Average Daily Rate (ADR) for Airbnb in Magnolia typically peaks in October and dips lowest during February. Leveraging Airbnb dynamic pricing tools or strategies based on this seasonality can significantly boost revenue. Here's a look at the typical nightly rates achieved:
- Best-in-class properties (Top 10%) command rates of $316+ per night, often due to premium features or locations.
- Strong performing properties (Top 25%) achieve nightly rates of $217 or more.
- Typical properties (Median) charge around $150 per night.
- Entry-level properties (Bottom 25%) earn around $101 per night.
Average Daily Rate (ADR) Trend by Month in Magnolia
Get Live Magnolia Market Intelligence 👇

Explore Real-time Analytics
Airbnb Seasonality Analysis & Trends in Magnolia (2026)
Peak Season (July, August, June)
- Revenue averages $3,435 per month
- Occupancy rates average 44.5%
- Daily rates average $197
Shoulder Season
- Revenue averages $2,550 per month
- Occupancy maintains around 40.9%
- Daily rates hold near $199
Low Season (January, February, October)
- Revenue drops to average $2,071 per month
- Occupancy decreases to average 36.6%
- Daily rates adjust to average $199
Seasonality Insights for Magnolia
- The Airbnb seasonality in Magnolia shows highly seasonal trends requiring careful strategy. While the sections above show seasonal averages, it's also insightful to look at the extremes:
- During the high season, the absolute peak month showcases Magnolia's highest earning potential, with monthly revenues capable of climbing to $3,718, occupancy reaching a high of 48.2%, and ADRs peaking at $210.
- Conversely, the slowest single month of the year, typically falling within the low season, marks the market's lowest point. In this month, revenue might dip to $1,639, occupancy could drop to 28.2%, and ADRs may adjust down to $186.
- Understanding both the seasonal averages and these monthly peaks and troughs in revenue, occupancy, and ADR is crucial for maximizing your Airbnb profit potential in Magnolia.
Seasonal Strategies for Maximizing Profit
- Peak Season: Maximize revenue through premium pricing and potentially longer minimum stays. Ensure high availability.
- Low Season: Offer competitive pricing, special promotions (e.g., extended stay discounts), and flexible cancellation policies. Target off-season travelers like remote workers or budget-conscious guests.
- Shoulder Seasons: Implement dynamic pricing that balances peak and low rates. Target weekend travelers or specific events. Offer slightly more flexible terms than peak season.
- Regularly analyze your own performance against these Magnolia seasonality benchmarks and adjust your pricing and availability strategy accordingly.
Best Areas for Airbnb Investment in Magnolia (2026)
Exploring the top neighborhoods for short-term rentals in Magnolia? This section highlights key areas, outlining why they are attractive for hosts and guests, along with notable local attractions. Consider these locations based on your target guest profile and investment strategy.
| Neighborhood / Area | Why Host Here? (Target Guests & Appeal) | Key Attractions & Landmarks |
|---|---|---|
| Lake Livingston | A popular destination for water activities and outdoor recreation. Attracts families and nature lovers looking for a relaxing getaway. | Lake Livingston State Park, Fishing and boating, Hiking trails, Water sports, Camping areas |
| Conroe | A growing city near the Greater Houston area, known for its events and proximity to nature. Perfect for guests attending conferences or exploring the outdoors. | Conroe Lake, Cynthia Woods Mitchell Pavilion, Heritage Museum of Montgomery County, Sam Houston National Forest, Shopping and dining options |
| The Woodlands | A master-planned community with beautiful parks, shopping, and dining. Ideal for travelers seeking a suburban retreat close to urban amenities. | The Woodlands Mall, Waterway Square, George Mitchell Nature Preserve, Market Street, Woodlands Pavilion |
| Magnolia Historical District | Rich in history with charming old buildings and a small-town feel, this area attracts tourists looking to immerse themselves in local heritage. | Historic buildings, Local shops, Annual festivals, Cultural events, Dining at local restaurants |
| Montgomery | A quaint town with a rich history, appealing to those interested in historical sites and small-town experiences. | Historical homes and sites, Lake Conroe, Shopping in local boutiques, Dining options, Outdoor recreational areas |
| Hughes Landing | An upscale development within The Woodlands, known for its luxury apartments and corporate offices. Ideal for business travelers. | Waterway and lakes, Dining and entertainment, Office spaces, Outdoor events and concerts, Parks and walking trails |
| Tomball | Known for its antique shops and vibrant downtown, Tomball has a small-town charm that appeals to both tourists and locals alike. | Tomball Depot and Museum, Antique shopping, The Tomball Farmers Market, Parks and nature trails, Annual events and festivals |
| Spring | A suburban area with plenty of family-friendly activities and a growing number of parks. Attracts families and tourists exploring the Houston area. | Old Town Spring, Spring Creek Greenway, Parks and recreational areas, Shopping centers, Dining options |
Understanding Airbnb License Requirements & STR Laws in Magnolia (2026)
While Magnolia, Texas, United States currently shows low STR regulations, specific Airbnb license requirements might still exist or change. Always verify the latest short term rental regulations and Airbnb license requirements directly with local government authorities for Magnolia to ensure full compliance before hosting.
(Source: AirROI data, 2026, finding no licensed listings among those analyzed)
Top Performing Airbnb Properties in Magnolia (2026)
Benchmark your potential! Explore examples of top-performing Airbnb properties in Magnoliabased on Trailing Twelve Month (TTM) revenue. Analyze their characteristics, revenue, occupancy rate, and ADR to understand what drives success in this market.
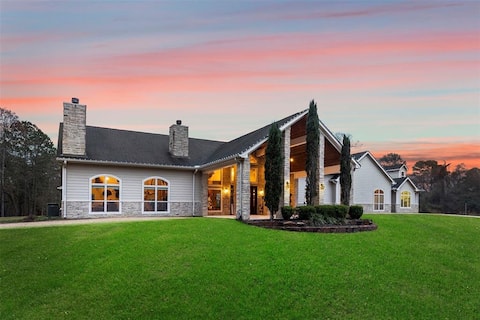
The Wyldes at Tranquility Ranch Retreat
Entire Place • 7 bedrooms
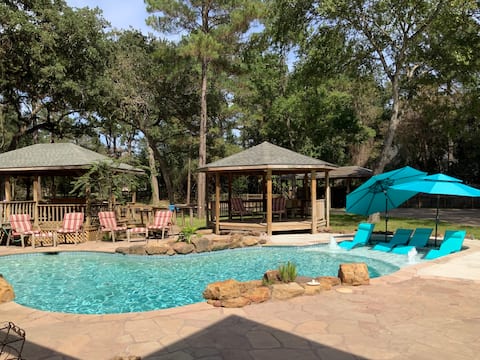
Country Estate 5 bedrooms + 1 bedroom guest house
Entire Place • 6 bedrooms
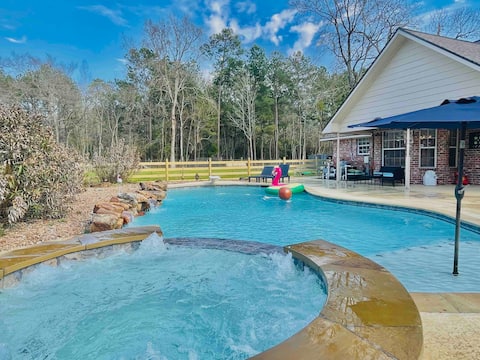
Country Getaway Magnolia Forest Home | 10 acres
Entire Place • 4 bedrooms
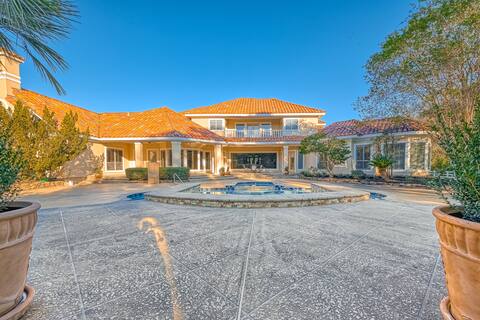
Luxury Tuscan Style Villa
Entire Place • 4 bedrooms
Home Sweet Farmhouse
Entire Place • 4 bedrooms
The LUX at West Event & Stay, Pool, Golf & Pickle
Entire Place • 3 bedrooms
Note: Performance varies based on location, size, amenities, seasonality, and management quality. Data reflects the past 12 months.
Top Performing Airbnb Hosts in Magnolia (2026)
Learn from the best! This table showcases top-performing Airbnb hosts in Magnolia based on the number of properties managed and estimated total revenue over the past year. Analyze their scale and performance metrics.
| Host Name | Properties | Grossing Revenue | Stay Reviews | Avg Rating |
|---|---|---|---|---|
| Carter | 2 | $235,949 | 63 | 4.76/5.0 |
| John | 11 | $170,803 | 2560 | 4.85/5.0 |
| Giovanni | 2 | $91,919 | 80 | 4.84/5.0 |
| Gavin King | 1 | $87,741 | 83 | 4.90/5.0 |
| Sophie | 1 | $84,205 | 56 | 4.89/5.0 |
| Damon | 1 | $75,992 | 23 | 4.91/5.0 |
| Patricia Ann | 1 | $67,275 | 64 | 5.00/5.0 |
| Tomesha | 1 | $63,604 | 4 | 5.00/5.0 |
| Azi | 1 | $55,892 | 12 | 4.92/5.0 |
| Ben | 1 | $51,905 | 38 | 4.97/5.0 |
Analyzing the strategies of top hosts, such as their property selection, pricing, and guest communication, can offer valuable lessons for optimizing your own Airbnb operations in Magnolia.
Dive Deeper: Advanced Magnolia STR Market Data (2026)
Ready to unlock more insights? AirROI provides access to advanced metrics and comprehensive Airbnb data for Magnolia. Explore detailed analytics beyond this report to refine your investment strategy, optimize pricing, and maximize your vacation rental profits.
Explore Advanced MetricsMagnolia Short-Term Rental Market Composition (2026): Property & Room Types
Room Type Distribution
Property Type Distribution
Market Composition Insights for Magnolia
- The Magnolia Airbnb market composition is heavily skewed towards Entire Home/Apt listings, which make up 84.3% of the 83 active rentals. This indicates strong guest preference for privacy and space.
- Looking at the property type distribution in Magnolia, House properties are the most common (69.9%), reflecting the local real estate landscape.
- Houses represent a significant 69.9% portion, catering likely to families or larger groups.
- The presence of 8.4% Hotel/Boutique listings indicates integration with traditional hospitality.
- Smaller segments like unique stays (combined 2.4%) offer potential for unique stay experiences.
Magnolia Airbnb Room Capacity Analysis (2026): Bedroom Distribution
Distribution of Listings by Number of Bedrooms
Room Capacity Insights for Magnolia
- The dominant room capacity in Magnolia is 1 bedroom listings, making up 30.1% of the market. This suggests a strong demand for properties suitable for couples or solo travelers.
- Together, 1 bedroom and 3 bedrooms properties represent 47.0% of the active Airbnb listings in Magnolia, indicating a high concentration in these sizes.
- A significant 38.6% of listings offer 3+ bedrooms, catering to larger groups and families seeking more space in Magnolia.
Magnolia Vacation Rental Guest Capacity Trends (2026)
Distribution of Listings by Guest Capacity
Guest Capacity Insights for Magnolia
- The most common guest capacity trend in Magnolia vacation rentals is listings accommodating 8+ guests (27.7%). This suggests the primary traveler segment is likely larger groups.
- Properties designed for 8+ guests and 2 guests dominate the Magnolia STR market, accounting for 43.4% of listings.
- 46.9% of properties accommodate 6+ guests, serving the market segment for larger families or group travel in Magnolia.
- On average, properties in Magnolia are equipped to host 4.7 guests.
Magnolia Airbnb Booking Patterns (2026): Available vs. Booked Days
Available Days Distribution
Booked Days Distribution
Booking Pattern Insights for Magnolia
- The most common availability pattern in Magnolia falls within the 271-366 days range, representing 48.2% of listings. This suggests many properties have significant open periods on their calendars.
- Approximately 84.3% of listings show high availability (181+ days open annually), indicating potential for increased bookings or specific owner usage patterns.
- For booked days, the 91-180 days range is most frequent in Magnolia (37.3%), reflecting common guest stay durations or potential owner blocking patterns.
- A notable 15.7% of properties secure long booking periods (181+ days booked per year), highlighting successful long-term rental strategies or significant owner usage.
Magnolia Airbnb Minimum Stay Requirements Analysis
Distribution of Listings by Minimum Night Requirement
1 Night
35 listings
42.2% of total
2 Nights
24 listings
28.9% of total
3 Nights
2 listings
2.4% of total
4-6 Nights
2 listings
2.4% of total
7-29 Nights
5 listings
6% of total
30+ Nights
15 listings
18.1% of total
Key Insights
- The most prevalent minimum stay requirement in Magnolia is 1 Night, adopted by 42.2% of listings. This highlights the market's preference for shorter, flexible bookings.
- A strong majority (71.1%) of the Magnolia Airbnb data shows acceptance of very short stays (1-2 nights), indicating a dynamic, high-turnover market.
- A significant segment (18.1%) caters to monthly stays (30+ nights) in Magnolia, pointing to opportunities in the extended-stay market.
Recommendations
- Align with the market by considering a 1 Night minimum stay, as 42.2% of Magnolia hosts use this setting.
- Explore offering discounts for stays of 30+ nights to attract the 18.1% of the market seeking extended stays.
- Adjust minimum nights based on seasonality – potentially shorter during low season and longer during peak demand periods in Magnolia.
Magnolia Airbnb Cancellation Policy Trends Analysis (2026)
Limited
1 listings
1.2% of total
Super Strict 30 Days
1 listings
1.2% of total
Flexible
20 listings
24.4% of total
Moderate
29 listings
35.4% of total
Firm
25 listings
30.5% of total
Strict
6 listings
7.3% of total
Cancellation Policy Insights for Magnolia
- The prevailing Airbnb cancellation policy trend in Magnolia is Moderate, used by 35.4% of listings.
- There's a relatively balanced mix between guest-friendly (59.8%) and stricter (37.8%) policies, offering choices for different guest needs.
- Strict cancellation policies are quite rare (7.3%), potentially making listings with this policy less competitive unless justified by high demand or property type.
Recommendations for Hosts
- Consider adopting a Moderate policy to align with the 35.4% market standard in Magnolia.
- Using a Strict policy might deter some guests, as only 7.3% of listings use it. Evaluate if potential revenue protection outweighs possible lower booking rates.
- Regularly review your cancellation policy against competitors and market demand shifts in Magnolia.
Magnolia STR Booking Lead Time Analysis (2026)
Average Booking Lead Time by Month
Booking Lead Time Insights for Magnolia
- The overall average booking lead time for vacation rentals in Magnolia is 30 days.
- Guests book furthest in advance for stays during November (average 61 days), likely coinciding with peak travel demand or local events.
- The shortest booking windows occur for stays in February (average 16 days), indicating more last-minute travel plans during this time.
- Seasonally, Fall (50 days avg.) sees the longest lead times, while Winter (23 days avg.) has the shortest, reflecting typical travel planning cycles.
Recommendations for Hosts
- Use the overall average lead time (30 days) as a baseline for your pricing and availability strategy in Magnolia.
- For November stays, consider implementing length-of-stay discounts or slightly higher rates for bookings made less than 61 days out to capitalize on advance planning.
- Target marketing efforts for the Fall season well in advance (at least 50 days) to capture early planners.
- Monitor your own booking lead times against these Magnolia averages to identify opportunities for dynamic pricing adjustments.
Popular & Essential Airbnb Amenities in Magnolia (2026)
Amenity Prevalence
Amenity Insights for Magnolia
- Essential amenities in Magnolia that guests expect include: Air conditioning, Free parking on premises, Wifi, Smoke alarm. Lacking these (any) could significantly impact bookings.
- Popular amenities like Heating, Kitchen, Microwave are common but not universal. Offering these can provide a competitive edge.
Recommendations for Hosts
- Ensure your listing includes all essential amenities for Magnolia: Air conditioning, Free parking on premises, Wifi, Smoke alarm.
- Prioritize adding missing essentials: Free parking on premises, Wifi, Smoke alarm.
- Consider adding popular differentiators like Heating or Kitchen to increase appeal.
- Highlight unique or less common amenities you offer (e.g., hot tub, dedicated workspace, EV charger) in your listing description and photos.
- Regularly check competitor amenities in Magnolia to stay competitive.
Magnolia Airbnb Guest Demographics & Profile Analysis (2026)
Guest Profile Summary for Magnolia
- The typical guest profile for Airbnb in Magnolia consists of primarily domestic travelers (96%), often arriving from nearby Houston, typically belonging to the Post-2000s (Gen Z/Alpha) group (50%), primarily speaking English or Spanish.
- Domestic travelers account for 95.8% of guests.
- Key international markets include United States (95.8%) and Mexico (1%).
- Top languages spoken are English (72.4%) followed by Spanish (17.4%).
- A significant demographic segment is the Post-2000s (Gen Z/Alpha) group, representing 50% of guests.
Recommendations for Hosts
- Target domestic marketing efforts towards travelers from Houston and Austin.
- Tailor amenities and listing descriptions to appeal to the dominant Post-2000s (Gen Z/Alpha) demographic (e.g., highlight fast WiFi, smart home features, local guides).
- Highlight unique local experiences or amenities relevant to the primary guest profile.
- Consider seasonal promotions aligned with peak travel times for key origin markets.
Nearby Short-Term Rental Market Comparison
How does the Magnolia Airbnb market stack up against its neighbors? Compare key performance metrics like average monthly revenue, ADR, and occupancy rates in surrounding areas to understand the broader regional STR landscape.
| Market | Active Properties | Monthly Revenue | Daily Rate | Avg. Occupancy |
|---|---|---|---|---|
| Fairfield | 10 | $4,761 | $360.96 | 42% |
| Jamaica Beach | 199 | $3,774 | $394.20 | 37% |
| Crystal Beach | 143 | $3,768 | $408.48 | 35% |
| Bolivar Peninsula | 913 | $3,311 | $396.49 | 34% |
| Columbus | 17 | $3,218 | $413.88 | 29% |
| Deer Park | 14 | $3,208 | $228.63 | 51% |
| Schulenburg | 25 | $3,157 | $349.06 | 31% |
| Chappell Hill | 11 | $2,947 | $509.72 | 31% |
| Streetman | 20 | $2,898 | $336.71 | 32% |
| Seabrook | 54 | $2,872 | $263.19 | 39% |