Leroy Airbnb Market Analysis 2026: Short Term Rental Data & Vacation Rental Statistics in Texas, United States
Is Airbnb profitable in Leroy in 2026? Explore comprehensive Airbnb analytics for Leroy, Texas, United States to uncover income potential. This 2026 STR market report for Leroy, based on AirROI data from February 2025 to January 2026, reveals key trends in the niche market of 20 active listings.
Whether you're considering an Airbnb investment in Leroy, optimizing your existing vacation rental, or exploring rental arbitrage opportunities, understanding the Leroy Airbnb data is crucial. Leveraging the low regulation environment is key to maximizing your short term rental income potential. Let's dive into the specifics.
Key Leroy Airbnb Performance Metrics Overview
Monthly Airbnb Revenue Variations & Income Potential in Leroy (2026)
Understanding the monthly revenue variations for Airbnb listings in Leroy is key to maximizing your short term rental income potential. Seasonality significantly impacts earnings. Our analysis, based on data from the past 12 months, shows that the peak revenue month for STRs in Leroy is typically October, while January often presents the lowest earnings, highlighting opportunities for strategic pricing adjustments during shoulder and low seasons. Explore the typical Airbnb income in Leroy across different performance tiers:
- Best-in-class properties (Top 10%) achieve $2,469+ monthly, often utilizing dynamic pricing and superior guest experiences.
- Strong performing properties (Top 25%) earn $1,821 or more, indicating effective management and desirable locations/amenities.
- Typical properties (Median) generate around $1,343 per month, representing the average market performance.
- Entry-level properties (Bottom 25%) see earnings around $825, often with potential for optimization.
Average Monthly Airbnb Earnings Trend in Leroy
Leroy Airbnb Occupancy Rate Trends (2026)
Maximize your bookings by understanding the Leroy STR occupancy trends. Seasonal demand shifts significantly influence how often properties are booked. Typically, Marchsees the highest demand (peak season occupancy), while September experiences the lowest (low season). Effective strategies, like adjusting minimum stays or offering promotions, can boost occupancy during slower periods. Here's how different property tiers perform in Leroy:
- Best-in-class properties (Top 10%) achieve 54%+ occupancy, indicating high desirability and potentially optimized availability.
- Strong performing properties (Top 25%) maintain 40% or higher occupancy, suggesting good market fit and guest satisfaction.
- Typical properties (Median) have an occupancy rate around 32%.
- Entry-level properties (Bottom 25%) average 21% occupancy, potentially facing higher vacancy.
Average Monthly Occupancy Rate Trend in Leroy
Average Daily Rate (ADR) Airbnb Trends in Leroy (2026)
Effective short term rental pricing strategy in Leroy involves understanding monthly ADR fluctuations. The Average Daily Rate (ADR) for Airbnb in Leroy typically peaks in October and dips lowest during February. Leveraging Airbnb dynamic pricing tools or strategies based on this seasonality can significantly boost revenue. Here's a look at the typical nightly rates achieved:
- Best-in-class properties (Top 10%) command rates of $152+ per night, often due to premium features or locations.
- Strong performing properties (Top 25%) achieve nightly rates of $138 or more.
- Typical properties (Median) charge around $126 per night.
- Entry-level properties (Bottom 25%) earn around $117 per night.
Average Daily Rate (ADR) Trend by Month in Leroy
Get Live Leroy Market Intelligence 👇

Explore Real-time Analytics
Airbnb Seasonality Analysis & Trends in Leroy (2026)
Peak Season (October, March, November)
- Revenue averages $1,927 per month
- Occupancy rates average 42.2%
- Daily rates average $138
Shoulder Season
- Revenue averages $1,389 per month
- Occupancy maintains around 33.3%
- Daily rates hold near $128
Low Season (January, April, September)
- Revenue drops to average $1,129 per month
- Occupancy decreases to average 27.1%
- Daily rates adjust to average $125
Seasonality Insights for Leroy
- The Airbnb seasonality in Leroy shows highly seasonal trends requiring careful strategy. While the sections above show seasonal averages, it's also insightful to look at the extremes:
- During the high season, the absolute peak month showcases Leroy's highest earning potential, with monthly revenues capable of climbing to $2,266, occupancy reaching a high of 47.1%, and ADRs peaking at $153.
- Conversely, the slowest single month of the year, typically falling within the low season, marks the market's lowest point. In this month, revenue might dip to $1,022, occupancy could drop to 24.4%, and ADRs may adjust down to $106.
- Understanding both the seasonal averages and these monthly peaks and troughs in revenue, occupancy, and ADR is crucial for maximizing your Airbnb profit potential in Leroy.
Seasonal Strategies for Maximizing Profit
- Peak Season: Maximize revenue through premium pricing and potentially longer minimum stays. Ensure high availability.
- Low Season: Offer competitive pricing, special promotions (e.g., extended stay discounts), and flexible cancellation policies. Target off-season travelers like remote workers or budget-conscious guests.
- Shoulder Seasons: Implement dynamic pricing that balances peak and low rates. Target weekend travelers or specific events. Offer slightly more flexible terms than peak season.
- Regularly analyze your own performance against these Leroy seasonality benchmarks and adjust your pricing and availability strategy accordingly.
Best Areas for Airbnb Investment in Leroy (2026)
Exploring the top neighborhoods for short-term rentals in Leroy? This section highlights key areas, outlining why they are attractive for hosts and guests, along with notable local attractions. Consider these locations based on your target guest profile and investment strategy.
| Neighborhood / Area | Why Host Here? (Target Guests & Appeal) | Key Attractions & Landmarks |
|---|---|---|
| Leroy Lakes | A serene area surrounded by nature and beautiful lakes, ideal for tourists looking for a peaceful getaway with fishing and hiking opportunities. | Leroy Park, Leroy Lakes, Fishing spots, Hiking trails, Picnic areas |
| Market Center | The heart of Leroy, featuring local shops and restaurants. Great for those who want to experience local life and enjoy convenient access to services. | Local restaurants, Shopping center, Community events, Leroy Farmers Market |
| Cedar Grove | A residential area known for its friendly atmosphere and beautiful parks. Ideal for families visiting the area. | Cedar Grove Park, Playgrounds, Community center, Sports facilities |
| Historic Downtown | Rich in history with charming architecture and local culture. Attracts visitors wanting to explore the heritage of Leroy. | Historic buildings, Local museums, Art galleries, Coffee shops, Annual festivals |
| Bluebonnet Trail | Famous for its beautiful wildflowers in spring, this area is perfect for outdoor lovers and nature photographers. | Bluebonnet Festival, Nature trails, Photography spots, Picnic areas, Wildflower viewing |
| Leroy Vineyard | A picturesque area with vineyards and wineries, catering to wine enthusiasts and those looking for tastings and tours. | Local wineries, Wine tasting events, Vineyard tours, Scenic drives |
| Sports Complex Area | Home to various sports facilities, it's a great location for families attending events or tournaments. | Sports complexes, Community sports events, Playgrounds, Walking trails |
| Scenic Overlook | Offering stunning views of the surrounding landscapes, it's ideal for tourists looking for picturesque spots for photography and relaxation. | Overlook points, Nature trails, Hiking paths, Wildlife viewing |
Understanding Airbnb License Requirements & STR Laws in Leroy (2026)
While Leroy, Texas, United States currently shows low STR regulations, specific Airbnb license requirements might still exist or change. Always verify the latest short term rental regulations and Airbnb license requirements directly with local government authorities for Leroy to ensure full compliance before hosting.
(Source: AirROI data, 2026, finding no licensed listings among those analyzed)
Top Performing Airbnb Properties in Leroy (2026)
Benchmark your potential! Explore examples of top-performing Airbnb properties in Leroybased on Trailing Twelve Month (TTM) revenue. Analyze their characteristics, revenue, occupancy rate, and ADR to understand what drives success in this market.
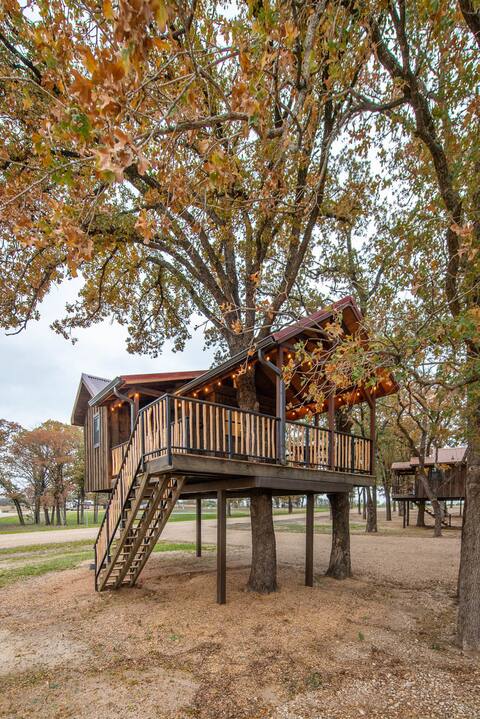
The Chickadee Treehouse 15MIN to Magnolia & Baylor
Entire Place • 1 bedroom
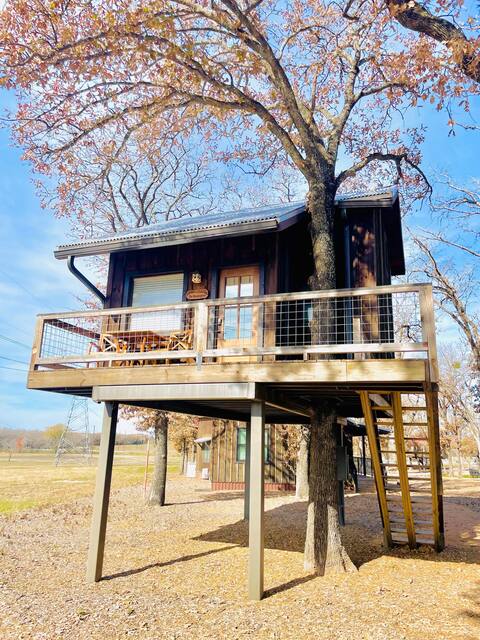
Mockingbird Treehouse (15 MIN to Magnolia/Baylor)
Entire Place • 2 bedrooms

The Starling Treehouse 15 MIN to Magnolia & Baylor
Entire Place • 1 bedroom
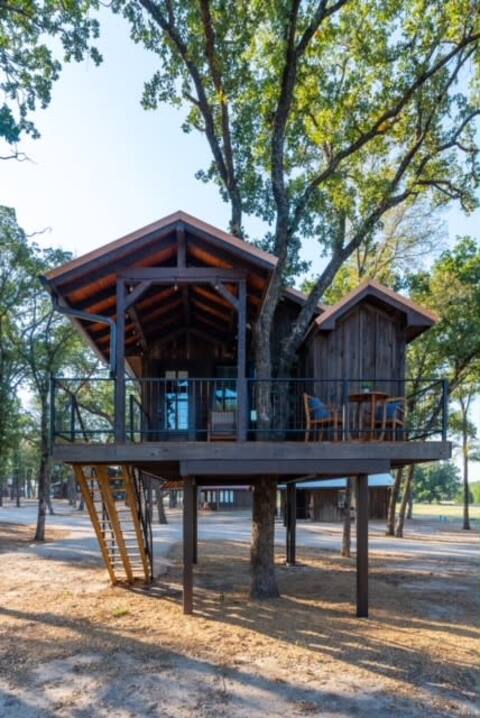
The Blue Jay Treehouse 15MIN to Magnolia & Baylor
Entire Place • 1 bedroom
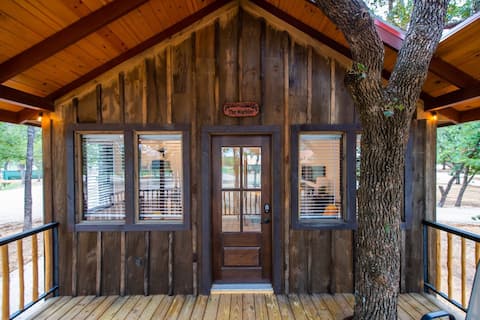
The Warbler Treehouse 15 MIn to Magnolia & Baylor
Entire Place • 1 bedroom
The Nuthatch Cabin (15 MIN to Magnolia & Baylor)
Entire Place • 1 bedroom
Note: Performance varies based on location, size, amenities, seasonality, and management quality. Data reflects the past 12 months.
Top Performing Airbnb Hosts in Leroy (2026)
Learn from the best! This table showcases top-performing Airbnb hosts in Leroy based on the number of properties managed and estimated total revenue over the past year. Analyze their scale and performance metrics.
| Host Name | Properties | Grossing Revenue | Stay Reviews | Avg Rating |
|---|---|---|---|---|
| Charles | 20 | $344,593 | 1703 | 4.97/5.0 |
Analyzing the strategies of top hosts, such as their property selection, pricing, and guest communication, can offer valuable lessons for optimizing your own Airbnb operations in Leroy.
Dive Deeper: Advanced Leroy STR Market Data (2026)
Ready to unlock more insights? AirROI provides access to advanced metrics and comprehensive Airbnb data for Leroy. Explore detailed analytics beyond this report to refine your investment strategy, optimize pricing, and maximize your vacation rental profits.
Explore Advanced MetricsLeroy Short-Term Rental Market Composition (2026): Property & Room Types
Room Type Distribution
Property Type Distribution
Market Composition Insights for Leroy
- The Leroy Airbnb market composition is heavily skewed towards Entire Home/Apt listings, which make up 100% of the 20 active rentals. This indicates strong guest preference for privacy and space.
- Looking at the property type distribution in Leroy, Unique Stays properties are the most common (60%), reflecting the local real estate landscape.
Leroy Airbnb Room Capacity Analysis (2026): Bedroom Distribution
Distribution of Listings by Number of Bedrooms
Room Capacity Insights for Leroy
- The dominant room capacity in Leroy is 1 bedroom listings, making up 90% of the market. This suggests a strong demand for properties suitable for couples or solo travelers.
- Together, 1 bedroom and 2 bedrooms properties represent 100.0% of the active Airbnb listings in Leroy, indicating a high concentration in these sizes.
- With over half the market (90%) consisting of studios or 1-bedroom units, Leroy is particularly well-suited for individuals or couples.
Leroy Vacation Rental Guest Capacity Trends (2026)
Distribution of Listings by Guest Capacity
Guest Capacity Insights for Leroy
- The most common guest capacity trend in Leroy vacation rentals is listings accommodating 2 guests (85%). This suggests the primary traveler segment is likely couples or solo travelers.
- Properties designed for 2 guests and 4 guests dominate the Leroy STR market, accounting for 100.0% of listings.
- A significant 85.0% of listings cater specifically to 1-2 guests, highlighting strong demand from couples and solo travelers in Leroy.
- On average, properties in Leroy are equipped to host 2.3 guests.
Leroy Airbnb Booking Patterns (2026): Available vs. Booked Days
Available Days Distribution
Booked Days Distribution
Booking Pattern Insights for Leroy
- The most common availability pattern in Leroy falls within the 181-270 days range, representing 55% of listings. This suggests many properties have significant open periods on their calendars.
- Approximately 90.0% of listings show high availability (181+ days open annually), indicating potential for increased bookings or specific owner usage patterns.
- For booked days, the 91-180 days range is most frequent in Leroy (55%), reflecting common guest stay durations or potential owner blocking patterns.
- A notable 10.0% of properties secure long booking periods (181+ days booked per year), highlighting successful long-term rental strategies or significant owner usage.
Leroy Airbnb Minimum Stay Requirements Analysis
Distribution of Listings by Minimum Night Requirement
1 Night
20 listings
100% of total
Key Insights
- The most prevalent minimum stay requirement in Leroy is 1 Night, adopted by 100% of listings. This highlights the market's preference for shorter, flexible bookings.
- A strong majority (100.0%) of the Leroy Airbnb data shows acceptance of very short stays (1-2 nights), indicating a dynamic, high-turnover market.
Recommendations
- Align with the market by considering a 1 Night minimum stay, as 100% of Leroy hosts use this setting.
- Adjust minimum nights based on seasonality – potentially shorter during low season and longer during peak demand periods in Leroy.
Leroy Airbnb Cancellation Policy Trends Analysis (2026)
Firm
20 listings
100% of total
Cancellation Policy Insights for Leroy
- The prevailing Airbnb cancellation policy trend in Leroy is Firm, used by 100% of listings.
- A majority (100.0%) of hosts in Leroy utilize Firm or Strict policies, indicating a market where hosts prioritize booking security.
Recommendations for Hosts
- Consider adopting a Firm policy to align with the 100% market standard in Leroy.
- Regularly review your cancellation policy against competitors and market demand shifts in Leroy.
Leroy STR Booking Lead Time Analysis (2026)
Average Booking Lead Time by Month
Booking Lead Time Insights for Leroy
- The overall average booking lead time for vacation rentals in Leroy is 40 days.
- Guests book furthest in advance for stays during July (average 72 days), likely coinciding with peak travel demand or local events.
- The shortest booking windows occur for stays in January (average 16 days), indicating more last-minute travel plans during this time.
- Seasonally, Summer (67 days avg.) sees the longest lead times, while Winter (23 days avg.) has the shortest, reflecting typical travel planning cycles.
Recommendations for Hosts
- Use the overall average lead time (40 days) as a baseline for your pricing and availability strategy in Leroy.
- For July stays, consider implementing length-of-stay discounts or slightly higher rates for bookings made less than 72 days out to capitalize on advance planning.
- Target marketing efforts for the Summer season well in advance (at least 67 days) to capture early planners.
- Monitor your own booking lead times against these Leroy averages to identify opportunities for dynamic pricing adjustments.
Popular & Essential Airbnb Amenities in Leroy (2026)
Amenity Prevalence
No amenities with partial availability (less than 100%) were found to display in the chart. All essential amenities might be present in all listings. Check insights below.
Amenity Insights for Leroy
- Essential amenities in Leroy that guests expect include: Air conditioning, Bed linens, Private entrance, Hair dryer, Refrigerator, Shampoo, Coffee maker, Dedicated workspace, Heating, Kitchen. Lacking these (any) could significantly impact bookings.
Recommendations for Hosts
- Ensure your listing includes all essential amenities for Leroy: Air conditioning, Bed linens, Private entrance, Hair dryer, Refrigerator, Shampoo, Coffee maker, Dedicated workspace, Heating, Kitchen.
- Highlight unique or less common amenities you offer (e.g., hot tub, dedicated workspace, EV charger) in your listing description and photos.
- Regularly check competitor amenities in Leroy to stay competitive.
Leroy Airbnb Guest Demographics & Profile Analysis (2026)
Guest Profile Summary for Leroy
- The typical guest profile for Airbnb in Leroy consists of primarily domestic travelers (98%), often arriving from nearby Dallas, typically belonging to the Post-2000s (Gen Z/Alpha) group (50%), primarily speaking English or Spanish.
- Domestic travelers account for 97.9% of guests.
- Key international markets include United States (97.9%) and Australia (1.1%).
- Top languages spoken are English (77.6%) followed by Spanish (14%).
- A significant demographic segment is the Post-2000s (Gen Z/Alpha) group, representing 50% of guests.
Recommendations for Hosts
- Target domestic marketing efforts towards travelers from Dallas and Houston.
- Tailor amenities and listing descriptions to appeal to the dominant Post-2000s (Gen Z/Alpha) demographic (e.g., highlight fast WiFi, smart home features, local guides).
- Highlight unique local experiences or amenities relevant to the primary guest profile.
- Consider seasonal promotions aligned with peak travel times for key origin markets.
Nearby Short-Term Rental Market Comparison
How does the Leroy Airbnb market stack up against its neighbors? Compare key performance metrics like average monthly revenue, ADR, and occupancy rates in surrounding areas to understand the broader regional STR landscape.
| Market | Active Properties | Monthly Revenue | Daily Rate | Avg. Occupancy |
|---|---|---|---|---|
| Strawn | 27 | $8,233 | $847.64 | 34% |
| Star Harbor | 11 | $5,474 | $741.72 | 33% |
| Hudson Bend | 59 | $5,436 | $611.45 | 31% |
| Jonestown | 60 | $5,240 | $513.31 | 32% |
| Gillespie County | 11 | $4,887 | $351.24 | 59% |
| West Lake Hills | 21 | $4,391 | $656.35 | 34% |
| Bluff Dale | 18 | $4,063 | $411.68 | 29% |
| Kingsland | 255 | $4,055 | $564.92 | 27% |
| Cottonwood Shores | 26 | $4,012 | $408.66 | 35% |
| Red Oak | 17 | $3,978 | $288.35 | 50% |