Ledbetter Airbnb Market Analysis 2026: Short Term Rental Data & Vacation Rental Statistics in Texas, United States
Is Airbnb profitable in Ledbetter in 2026? Explore comprehensive Airbnb analytics for Ledbetter, Texas, United States to uncover income potential. This 2026 STR market report for Ledbetter, based on AirROI data from February 2025 to January 2026, reveals key trends in the niche market of 19 active listings.
Whether you're considering an Airbnb investment in Ledbetter, optimizing your existing vacation rental, or exploring rental arbitrage opportunities, understanding the Ledbetter Airbnb data is crucial. Leveraging the low regulation environment is key to maximizing your short term rental income potential. Let's dive into the specifics.
Key Ledbetter Airbnb Performance Metrics Overview
Monthly Airbnb Revenue Variations & Income Potential in Ledbetter (2026)
Understanding the monthly revenue variations for Airbnb listings in Ledbetter is key to maximizing your short term rental income potential. Seasonality significantly impacts earnings. Our analysis, based on data from the past 12 months, shows that the peak revenue month for STRs in Ledbetter is typically October, while July often presents the lowest earnings, highlighting opportunities for strategic pricing adjustments during shoulder and low seasons. Explore the typical Airbnb income in Ledbetter across different performance tiers:
- Best-in-class properties (Top 10%) achieve $4,534+ monthly, often utilizing dynamic pricing and superior guest experiences.
- Strong performing properties (Top 25%) earn $2,598 or more, indicating effective management and desirable locations/amenities.
- Typical properties (Median) generate around $1,481 per month, representing the average market performance.
- Entry-level properties (Bottom 25%) see earnings around $740, often with potential for optimization.
Average Monthly Airbnb Earnings Trend in Ledbetter
Ledbetter Airbnb Occupancy Rate Trends (2026)
Maximize your bookings by understanding the Ledbetter STR occupancy trends. Seasonal demand shifts significantly influence how often properties are booked. Typically, Octobersees the highest demand (peak season occupancy), while July experiences the lowest (low season). Effective strategies, like adjusting minimum stays or offering promotions, can boost occupancy during slower periods. Here's how different property tiers perform in Ledbetter:
- Best-in-class properties (Top 10%) achieve 55%+ occupancy, indicating high desirability and potentially optimized availability.
- Strong performing properties (Top 25%) maintain 35% or higher occupancy, suggesting good market fit and guest satisfaction.
- Typical properties (Median) have an occupancy rate around 21%.
- Entry-level properties (Bottom 25%) average 12% occupancy, potentially facing higher vacancy.
Average Monthly Occupancy Rate Trend in Ledbetter
Average Daily Rate (ADR) Airbnb Trends in Ledbetter (2026)
Effective short term rental pricing strategy in Ledbetter involves understanding monthly ADR fluctuations. The Average Daily Rate (ADR) for Airbnb in Ledbetter typically peaks in October and dips lowest during February. Leveraging Airbnb dynamic pricing tools or strategies based on this seasonality can significantly boost revenue. Here's a look at the typical nightly rates achieved:
- Best-in-class properties (Top 10%) command rates of $422+ per night, often due to premium features or locations.
- Strong performing properties (Top 25%) achieve nightly rates of $326 or more.
- Typical properties (Median) charge around $213 per night.
- Entry-level properties (Bottom 25%) earn around $181 per night.
Average Daily Rate (ADR) Trend by Month in Ledbetter
Get Live Ledbetter Market Intelligence 👇

Explore Real-time Analytics
Airbnb Seasonality Analysis & Trends in Ledbetter (2026)
Peak Season (October, March, June)
- Revenue averages $3,330 per month
- Occupancy rates average 37.8%
- Daily rates average $278
Shoulder Season
- Revenue averages $1,631 per month
- Occupancy maintains around 24.4%
- Daily rates hold near $261
Low Season (January, July, August)
- Revenue drops to average $1,034 per month
- Occupancy decreases to average 16.1%
- Daily rates adjust to average $253
Seasonality Insights for Ledbetter
- The Airbnb seasonality in Ledbetter shows highly seasonal trends requiring careful strategy. While the sections above show seasonal averages, it's also insightful to look at the extremes:
- During the high season, the absolute peak month showcases Ledbetter's highest earning potential, with monthly revenues capable of climbing to $4,000, occupancy reaching a high of 45.8%, and ADRs peaking at $316.
- Conversely, the slowest single month of the year, typically falling within the low season, marks the market's lowest point. In this month, revenue might dip to $901, occupancy could drop to 15.3%, and ADRs may adjust down to $230.
- Understanding both the seasonal averages and these monthly peaks and troughs in revenue, occupancy, and ADR is crucial for maximizing your Airbnb profit potential in Ledbetter.
Seasonal Strategies for Maximizing Profit
- Peak Season: Maximize revenue through premium pricing and potentially longer minimum stays. Ensure high availability.
- Low Season: Offer competitive pricing, special promotions (e.g., extended stay discounts), and flexible cancellation policies. Target off-season travelers like remote workers or budget-conscious guests.
- Shoulder Seasons: Implement dynamic pricing that balances peak and low rates. Target weekend travelers or specific events. Offer slightly more flexible terms than peak season.
- Regularly analyze your own performance against these Ledbetter seasonality benchmarks and adjust your pricing and availability strategy accordingly.
Best Areas for Airbnb Investment in Ledbetter (2026)
Exploring the top neighborhoods for short-term rentals in Ledbetter? This section highlights key areas, outlining why they are attractive for hosts and guests, along with notable local attractions. Consider these locations based on your target guest profile and investment strategy.
| Neighborhood / Area | Why Host Here? (Target Guests & Appeal) | Key Attractions & Landmarks |
|---|---|---|
| Katy | A growing suburb with family-friendly neighborhoods and excellent schools. It attracts families looking for a peaceful environment close to Houston's amenities. | Katy Mills Mall, Typhoon Texas Waterpark, Parks and Recreation, Katy Heritage Museum, Mary Jo Peckham Park |
| West Houston | A vibrant area with a mix of residential, commercial, and recreational spaces. Its proximity to major highways and job centers makes it appealing for short-term rentals. | CityCentre, Memorial City Mall, George Bush Park, The Galleria, The Westchase District |
| Brenham | Famous for its Bluebonnet flowers and home to Blue Bell Creameries. It offers a charming small-town experience with numerous outdoor activities. | Blue Bell Creameries, Brenham Heritage Museum, Washington-on-the-Brazos State Historic Site, Lake Somerville, Chappell Hill Lavender Farm |
| College Station | Home to Texas A&M University, it attracts students, parents, and college visitors year-round, ensuring steady demand for short-term rentals. | Texas A&M University, Kyle Field, Bonfire Memorial, George H.W. Bush Presidential Library, Zebco Park |
| Hempstead | A historic town with a friendly community atmosphere, it's appealing to those looking for a quieter lifestyle while still being close to Houston. | Hempstead Historic Downtown, Waller County Historical Museum, Lake Livingston, Hempstead Community Center, Hempstead High School |
| Navasota | Known for its rich history and connection to the Texas independence movement. It's a charming small-town where history and culture intersect. | Navasota Blues Fest, Grimes County Museum, Navasota River, Local shops and boutiques, Historic sites |
| Bellville | A quaint town that offers a mix of outdoor activities and local culture, making it attractive for those seeking a rural escape close to city conveniences. | Bellville Historic Main Street, Bellville Farmers Market, Cedar Hill Park, Local wineries, Parks and recreation |
| La Grange | Famous for its historic sites and nearby recreational lakes, it provides a blend of history, nature, and community events, ideal for tourists. | The Texas Czech Heritage and Cultural Center, Fayette County Courthouse, Lake Fayette, Local festivals, Historic downtown |
Understanding Airbnb License Requirements & STR Laws in Ledbetter (2026)
While Ledbetter, Texas, United States currently shows low STR regulations, specific Airbnb license requirements might still exist or change. Always verify the latest short term rental regulations and Airbnb license requirements directly with local government authorities for Ledbetter to ensure full compliance before hosting.
(Source: AirROI data, 2026, finding no licensed listings among those analyzed)
Top Performing Airbnb Properties in Ledbetter (2026)
Benchmark your potential! Explore examples of top-performing Airbnb properties in Ledbetterbased on Trailing Twelve Month (TTM) revenue. Analyze their characteristics, revenue, occupancy rate, and ADR to understand what drives success in this market.
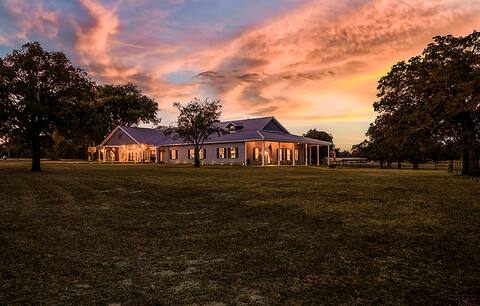
Round Top, This is the PLACE!
Entire Place • 4 bedrooms
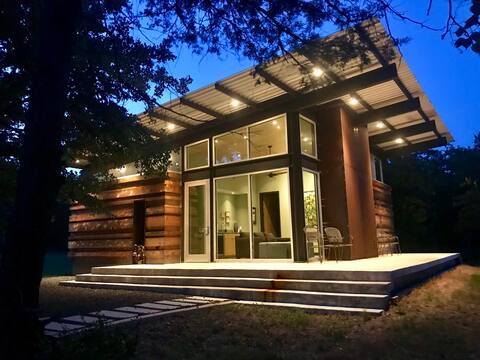
Joseph's Goats Ranch
Entire Place • 2 bedrooms

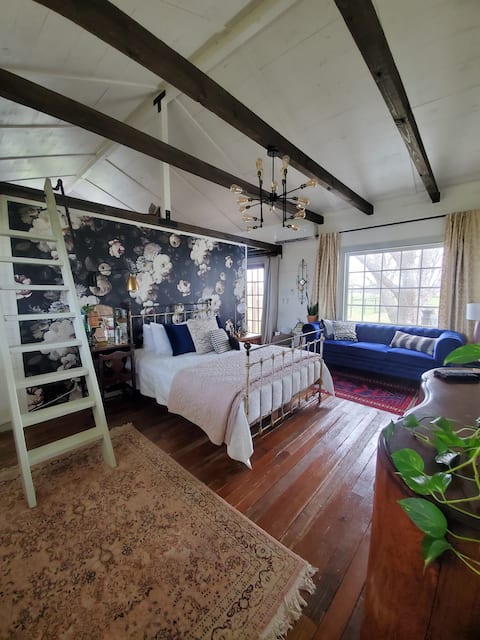
The Whiskey House - 12 mins from Round Top
Entire Place • 3 bedrooms
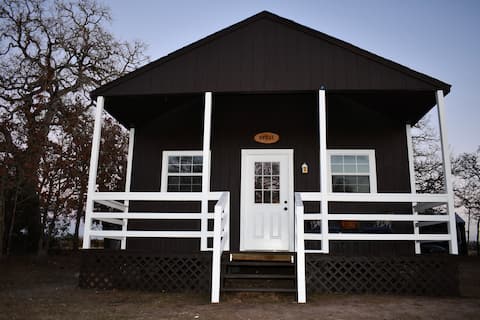
Mockingbird Fields- Nesting Suite
Entire Place • 2 bedrooms

Western Lifestyle Meets Winter Dreams | Royale #1
Entire Place • 2 bedrooms
Quaint Cabin on Idyllic Ranch near Round Top TX
Entire Place • N/A
Note: Performance varies based on location, size, amenities, seasonality, and management quality. Data reflects the past 12 months.
Top Performing Airbnb Hosts in Ledbetter (2026)
Learn from the best! This table showcases top-performing Airbnb hosts in Ledbetter based on the number of properties managed and estimated total revenue over the past year. Analyze their scale and performance metrics.
| Host Name | Properties | Grossing Revenue | Stay Reviews | Avg Rating |
|---|---|---|---|---|
| Moji | 5 | $65,062 | 122 | 4.81/5.0 |
| Dakota Zachary | 2 | $45,956 | 6 | 4.60/5.0 |
| Reid And Brad | 1 | $33,513 | 181 | 4.98/5.0 |
| Christopher | 2 | $20,561 | 51 | 4.96/5.0 |
| Hank | 1 | $19,373 | 29 | 4.90/5.0 |
| Chelsea | 1 | $18,789 | 217 | 4.96/5.0 |
| HOSTÎE Vacation Rentals | 1 | $18,364 | 58 | 4.95/5.0 |
| Terri | 1 | $17,728 | 24 | 5.00/5.0 |
| Natalie | 2 | $13,534 | 121 | 4.94/5.0 |
| Heidi | 1 | $12,938 | 22 | 4.95/5.0 |
Analyzing the strategies of top hosts, such as their property selection, pricing, and guest communication, can offer valuable lessons for optimizing your own Airbnb operations in Ledbetter.
Dive Deeper: Advanced Ledbetter STR Market Data (2026)
Ready to unlock more insights? AirROI provides access to advanced metrics and comprehensive Airbnb data for Ledbetter. Explore detailed analytics beyond this report to refine your investment strategy, optimize pricing, and maximize your vacation rental profits.
Explore Advanced MetricsLedbetter Short-Term Rental Market Composition (2026): Property & Room Types
Room Type Distribution
Property Type Distribution
Market Composition Insights for Ledbetter
- The Ledbetter Airbnb market composition is heavily skewed towards Entire Home/Apt listings, which make up 94.7% of the 19 active rentals. This indicates strong guest preference for privacy and space.
- Looking at the property type distribution in Ledbetter, Hotel/Boutique properties are the most common (31.6%), reflecting the local real estate landscape.
- Houses represent a significant 31.6% portion, catering likely to families or larger groups.
- The presence of 31.6% Hotel/Boutique listings indicates integration with traditional hospitality.
Ledbetter Airbnb Room Capacity Analysis (2026): Bedroom Distribution
Distribution of Listings by Number of Bedrooms
Room Capacity Insights for Ledbetter
- The dominant room capacity in Ledbetter is 2 bedrooms listings, making up 26.3% of the market. This suggests a strong demand for properties suitable for couples or solo travelers.
- Together, 2 bedrooms and 1 bedroom properties represent 47.4% of the active Airbnb listings in Ledbetter, indicating a high concentration in these sizes.
- A significant 21.1% of listings offer 3+ bedrooms, catering to larger groups and families seeking more space in Ledbetter.
Ledbetter Vacation Rental Guest Capacity Trends (2026)
Distribution of Listings by Guest Capacity
Guest Capacity Insights for Ledbetter
- The most common guest capacity trend in Ledbetter vacation rentals is listings accommodating 2 guests (42.1%). This suggests the primary traveler segment is likely couples or solo travelers.
- Properties designed for 2 guests and 6 guests dominate the Ledbetter STR market, accounting for 52.6% of listings.
- A significant 42.1% of listings cater specifically to 1-2 guests, highlighting strong demand from couples and solo travelers in Ledbetter.
- 26.3% of properties accommodate 6+ guests, serving the market segment for larger families or group travel in Ledbetter.
- On average, properties in Ledbetter are equipped to host 3.8 guests.
Ledbetter Airbnb Booking Patterns (2026): Available vs. Booked Days
Available Days Distribution
Booked Days Distribution
Booking Pattern Insights for Ledbetter
- The most common availability pattern in Ledbetter falls within the 271-366 days range, representing 89.5% of listings. This suggests many properties have significant open periods on their calendars.
- Approximately 100.0% of listings show high availability (181+ days open annually), indicating potential for increased bookings or specific owner usage patterns.
- For booked days, the 31-90 days range is most frequent in Ledbetter (78.9%), reflecting common guest stay durations or potential owner blocking patterns.
Ledbetter Airbnb Minimum Stay Requirements Analysis
Distribution of Listings by Minimum Night Requirement
1 Night
9 listings
47.4% of total
2 Nights
5 listings
26.3% of total
30+ Nights
5 listings
26.3% of total
Key Insights
- The most prevalent minimum stay requirement in Ledbetter is 1 Night, adopted by 47.4% of listings. This highlights the market's preference for shorter, flexible bookings.
- A strong majority (73.7%) of the Ledbetter Airbnb data shows acceptance of very short stays (1-2 nights), indicating a dynamic, high-turnover market.
- A significant segment (26.3%) caters to monthly stays (30+ nights) in Ledbetter, pointing to opportunities in the extended-stay market.
Recommendations
- Align with the market by considering a 1 Night minimum stay, as 47.4% of Ledbetter hosts use this setting.
- Explore offering discounts for stays of 30+ nights to attract the 26.3% of the market seeking extended stays.
- Adjust minimum nights based on seasonality – potentially shorter during low season and longer during peak demand periods in Ledbetter.
Ledbetter Airbnb Cancellation Policy Trends Analysis (2026)
Super Strict 60 Days
1 listings
5.3% of total
Flexible
3 listings
15.8% of total
Moderate
11 listings
57.9% of total
Firm
4 listings
21.1% of total
Cancellation Policy Insights for Ledbetter
- The prevailing Airbnb cancellation policy trend in Ledbetter is Moderate, used by 57.9% of listings.
- The market strongly favors guest-friendly terms, with 73.7% of listings offering Flexible or Moderate policies. This suggests guests in Ledbetter may expect booking flexibility.
Recommendations for Hosts
- Consider adopting a Moderate policy to align with the 57.9% market standard in Ledbetter.
- Regularly review your cancellation policy against competitors and market demand shifts in Ledbetter.
Ledbetter STR Booking Lead Time Analysis (2026)
Average Booking Lead Time by Month
Booking Lead Time Insights for Ledbetter
- The overall average booking lead time for vacation rentals in Ledbetter is 40 days.
- Guests book furthest in advance for stays during October (average 75 days), likely coinciding with peak travel demand or local events.
- The shortest booking windows occur for stays in July (average 12 days), indicating more last-minute travel plans during this time.
- Seasonally, Fall (50 days avg.) sees the longest lead times, while Summer (15 days avg.) has the shortest, reflecting typical travel planning cycles.
Recommendations for Hosts
- Use the overall average lead time (40 days) as a baseline for your pricing and availability strategy in Ledbetter.
- For October stays, consider implementing length-of-stay discounts or slightly higher rates for bookings made less than 75 days out to capitalize on advance planning.
- During July, focus on last-minute booking availability and promotions, as guests book with very short notice (12 days avg.).
- Target marketing efforts for the Fall season well in advance (at least 50 days) to capture early planners.
- Monitor your own booking lead times against these Ledbetter averages to identify opportunities for dynamic pricing adjustments.
Popular & Essential Airbnb Amenities in Ledbetter (2026)
Amenity Prevalence
Amenity Insights for Ledbetter
- Essential amenities in Ledbetter that guests expect include: Heating, Smoke alarm, Essentials, Air conditioning, Wifi. Lacking these (any) could significantly impact bookings.
- Popular amenities like Free parking on premises, Hot water, TV are common but not universal. Offering these can provide a competitive edge.
Recommendations for Hosts
- Ensure your listing includes all essential amenities for Ledbetter: Heating, Smoke alarm, Essentials, Air conditioning, Wifi.
- Consider adding popular differentiators like Free parking on premises or Hot water to increase appeal.
- Highlight unique or less common amenities you offer (e.g., hot tub, dedicated workspace, EV charger) in your listing description and photos.
- Regularly check competitor amenities in Ledbetter to stay competitive.
Ledbetter Airbnb Guest Demographics & Profile Analysis (2026)
Guest Profile Summary for Ledbetter
- The typical guest profile for Airbnb in Ledbetter consists of primarily domestic travelers (100%), often arriving from nearby Houston, typically belonging to the Post-2000s (Gen Z/Alpha) group (50%), primarily speaking English.
- Domestic travelers account for 100.0% of guests.
- A significant demographic segment is the Post-2000s (Gen Z/Alpha) group, representing 50% of guests.
Recommendations for Hosts
- Target domestic marketing efforts towards travelers from Houston and Dallas.
- Tailor amenities and listing descriptions to appeal to the dominant Post-2000s (Gen Z/Alpha) demographic (e.g., highlight fast WiFi, smart home features, local guides).
- Highlight unique local experiences or amenities relevant to the primary guest profile.
- Consider seasonal promotions aligned with peak travel times for key origin markets.
Nearby Short-Term Rental Market Comparison
How does the Ledbetter Airbnb market stack up against its neighbors? Compare key performance metrics like average monthly revenue, ADR, and occupancy rates in surrounding areas to understand the broader regional STR landscape.
| Market | Active Properties | Monthly Revenue | Daily Rate | Avg. Occupancy |
|---|---|---|---|---|
| Hudson Bend | 59 | $5,436 | $611.45 | 31% |
| Jonestown | 60 | $5,240 | $513.31 | 32% |
| Fairfield | 10 | $4,761 | $360.96 | 42% |
| West Lake Hills | 21 | $4,391 | $656.35 | 34% |
| Volente | 19 | $3,627 | $462.89 | 30% |
| Valley Mills | 25 | $3,329 | $334.75 | 40% |
| Martindale | 39 | $3,223 | $429.47 | 28% |
| Columbus | 17 | $3,218 | $413.88 | 29% |
| Deer Park | 14 | $3,208 | $228.63 | 51% |
| Schulenburg | 25 | $3,157 | $349.06 | 31% |