League City Airbnb Market Analysis 2026: Short Term Rental Data & Vacation Rental Statistics in Texas, United States
Is Airbnb profitable in League City in 2026? Explore comprehensive Airbnb analytics for League City, Texas, United States to uncover income potential. This 2026 STR market report for League City, based on AirROI data from February 2025 to January 2026, reveals key trends in the niche market of 79 active listings.
Whether you're considering an Airbnb investment in League City, optimizing your existing vacation rental, or exploring rental arbitrage opportunities, understanding the League City Airbnb data is crucial. Navigating the high regulation landscape is key to maximizing your short term rental income potential. Let's dive into the specifics.
Key League City Airbnb Performance Metrics Overview
Monthly Airbnb Revenue Variations & Income Potential in League City (2026)
Understanding the monthly revenue variations for Airbnb listings in League City is key to maximizing your short term rental income potential. Seasonality significantly impacts earnings. Our analysis, based on data from the past 12 months, shows that the peak revenue month for STRs in League City is typically July, while February often presents the lowest earnings, highlighting opportunities for strategic pricing adjustments during shoulder and low seasons. Explore the typical Airbnb income in League City across different performance tiers:
- Best-in-class properties (Top 10%) achieve $5,504+ monthly, often utilizing dynamic pricing and superior guest experiences.
- Strong performing properties (Top 25%) earn $3,717 or more, indicating effective management and desirable locations/amenities.
- Typical properties (Median) generate around $1,811 per month, representing the average market performance.
- Entry-level properties (Bottom 25%) see earnings around $763, often with potential for optimization.
Average Monthly Airbnb Earnings Trend in League City
League City Airbnb Occupancy Rate Trends (2026)
Maximize your bookings by understanding the League City STR occupancy trends. Seasonal demand shifts significantly influence how often properties are booked. Typically, Julysees the highest demand (peak season occupancy), while December experiences the lowest (low season). Effective strategies, like adjusting minimum stays or offering promotions, can boost occupancy during slower periods. Here's how different property tiers perform in League City:
- Best-in-class properties (Top 10%) achieve 81%+ occupancy, indicating high desirability and potentially optimized availability.
- Strong performing properties (Top 25%) maintain 63% or higher occupancy, suggesting good market fit and guest satisfaction.
- Typical properties (Median) have an occupancy rate around 41%.
- Entry-level properties (Bottom 25%) average 21% occupancy, potentially facing higher vacancy.
Average Monthly Occupancy Rate Trend in League City
Average Daily Rate (ADR) Airbnb Trends in League City (2026)
Effective short term rental pricing strategy in League City involves understanding monthly ADR fluctuations. The Average Daily Rate (ADR) for Airbnb in League City typically peaks in June and dips lowest during February. Leveraging Airbnb dynamic pricing tools or strategies based on this seasonality can significantly boost revenue. Here's a look at the typical nightly rates achieved:
- Best-in-class properties (Top 10%) command rates of $305+ per night, often due to premium features or locations.
- Strong performing properties (Top 25%) achieve nightly rates of $232 or more.
- Typical properties (Median) charge around $145 per night.
- Entry-level properties (Bottom 25%) earn around $77 per night.
Average Daily Rate (ADR) Trend by Month in League City
Get Live League City Market Intelligence 👇

Explore Real-time Analytics
Airbnb Seasonality Analysis & Trends in League City (2026)
Peak Season (July, June, August)
- Revenue averages $2,959 per month
- Occupancy rates average 50.0%
- Daily rates average $173
Shoulder Season
- Revenue averages $2,425 per month
- Occupancy maintains around 41.5%
- Daily rates hold near $169
Low Season (January, February, April)
- Revenue drops to average $1,990 per month
- Occupancy decreases to average 40.2%
- Daily rates adjust to average $159
Seasonality Insights for League City
- The Airbnb seasonality in League City shows moderate seasonality with distinct peak and low periods. While the sections above show seasonal averages, it's also insightful to look at the extremes:
- During the high season, the absolute peak month showcases League City's highest earning potential, with monthly revenues capable of climbing to $3,064, occupancy reaching a high of 52.9%, and ADRs peaking at $177.
- Conversely, the slowest single month of the year, typically falling within the low season, marks the market's lowest point. In this month, revenue might dip to $1,888, occupancy could drop to 33.2%, and ADRs may adjust down to $153.
- Understanding both the seasonal averages and these monthly peaks and troughs in revenue, occupancy, and ADR is crucial for maximizing your Airbnb profit potential in League City.
Seasonal Strategies for Maximizing Profit
- Peak Season: Maximize revenue through premium pricing and potentially longer minimum stays. Ensure high availability.
- Low Season: Offer competitive pricing, special promotions (e.g., extended stay discounts), and flexible cancellation policies. Target off-season travelers like remote workers or budget-conscious guests.
- Shoulder Seasons: Implement dynamic pricing that balances peak and low rates. Target weekend travelers or specific events. Offer slightly more flexible terms than peak season.
- Regularly analyze your own performance against these League City seasonality benchmarks and adjust your pricing and availability strategy accordingly.
Best Areas for Airbnb Investment in League City (2026)
Exploring the top neighborhoods for short-term rentals in League City? This section highlights key areas, outlining why they are attractive for hosts and guests, along with notable local attractions. Consider these locations based on your target guest profile and investment strategy.
| Neighborhood / Area | Why Host Here? (Target Guests & Appeal) | Key Attractions & Landmarks |
|---|---|---|
| Waterfront District | Scenic waterfront area with easy access to boating and water activities. Popular destination for families and tourists looking for outdoor adventures. | Clear Creek, Lakewood Yacht Club, Kemah Boardwalk, Hester Garden, Marina del Sol |
| League City Historic District | Rich in history and charming architecture, this area offers a glimpse into the past with quaint shops and restaurants, appealing to those seeking a unique local experience. | Historic League City, City Hall, League Park, League City Museum |
| South Shore Harbour | Upscale neighborhood with recreational amenities and proximity to the South Shore Harbour Marina, perfect for those who enjoy golf and water activities. | South Shore Harbour Golf Course, South Shore Harbour Marina, Clear Lake |
| Nassau Bay | A tranquil neighborhood with beautiful views of Clear Lake, ideal for travelers looking for relaxation and nature experiences. | Nassau Bay Park, NASA Johnson Space Center, Astroville Underground |
| Kemah | Home to the famous Kemah Boardwalk, this vibrant area offers entertaining attractions, dining, and great views of Galveston Bay. | Kemah Boardwalk, Lunada Blue, Aquarium Restaurant, The Flying Dutchman |
| El Lago | A serene lakeside community with a mix of residential options, perfect for those looking for peaceful getaways close to nature. | El Lago Park, Clear Lake, Lakeside restaurants |
| Taylor Lake Village | A small, quiet community ideal for those wanting a relaxing atmosphere, with access to parks and lake activities. | Taylor Lake, Village Park, Pine Brook Trail |
| Brookwood | Family-oriented community with spacious parks and recreational facilities, great for families and those traveling with children. | Brookwood Community Park, Underground Waterfall, Family-friendly amenities |
Understanding Airbnb License Requirements & STR Laws in League City (2026)
Yes, League City, Texas, United States enforces high STR regulations. Obtaining a license and ensuring compliance is almost certainly required according to current 2026 STR laws. Always verify the latest short term rental regulations and Airbnb license requirements directly with local government authorities for League City to ensure full compliance before hosting.
(Source: AirROI data, 2026, based on 67% licensed listings)
Top Performing Airbnb Properties in League City (2026)
Benchmark your potential! Explore examples of top-performing Airbnb properties in League Citybased on Trailing Twelve Month (TTM) revenue. Analyze their characteristics, revenue, occupancy rate, and ADR to understand what drives success in this market.
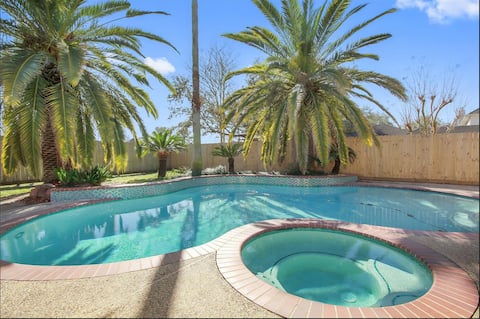
Beach Themed Oasis with Jacuzzi/Pool
Entire Place • 3 bedrooms
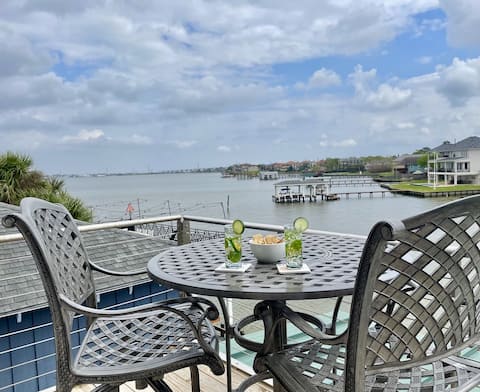
Bayside Retreat! New Listing! Fish, Boat, Relax
Entire Place • 3 bedrooms
Bright & Roomy Family Home | Near beaches & Fun!
Entire Place • 4 bedrooms

Pool • Hot Tub • King Bed • Serene and Modern Home
Entire Place • 3 bedrooms

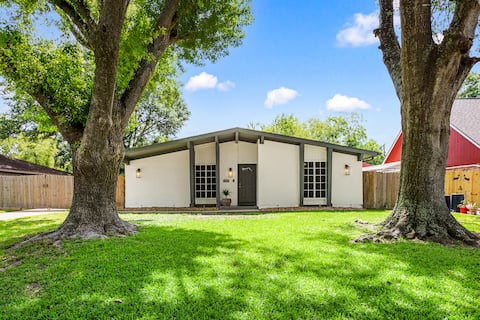
Newly Remodeled Modern Farmhouse on an Acre
Entire Place • 4 bedrooms
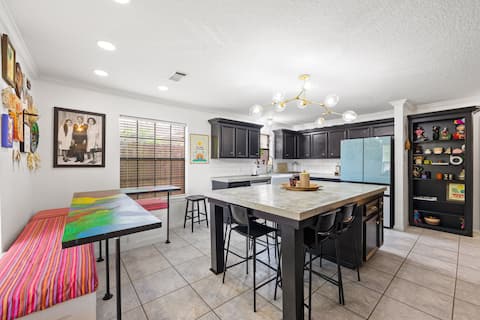
Quirky Casita
Entire Place • 5 bedrooms
Note: Performance varies based on location, size, amenities, seasonality, and management quality. Data reflects the past 12 months.
Top Performing Airbnb Hosts in League City (2026)
Learn from the best! This table showcases top-performing Airbnb hosts in League City based on the number of properties managed and estimated total revenue over the past year. Analyze their scale and performance metrics.
| Host Name | Properties | Grossing Revenue | Stay Reviews | Avg Rating |
|---|---|---|---|---|
| Nicholas | 2 | $87,851 | 199 | 4.92/5.0 |
| Rachel | 2 | $82,926 | 120 | 4.97/5.0 |
| Mercy | 1 | $69,173 | 202 | 4.91/5.0 |
| Ashlie | 2 | $69,072 | 69 | 4.96/5.0 |
| Porter VRM Texas | 1 | $68,781 | 38 | 4.71/5.0 |
| Natalie And Kyle | 1 | $64,340 | 60 | 5.00/5.0 |
| Mark | 1 | $63,360 | 110 | 4.91/5.0 |
| Mark | 1 | $60,168 | 53 | 4.96/5.0 |
| Celeste | 1 | $51,107 | 52 | 4.96/5.0 |
| Selina | 1 | $44,539 | 68 | 4.78/5.0 |
Analyzing the strategies of top hosts, such as their property selection, pricing, and guest communication, can offer valuable lessons for optimizing your own Airbnb operations in League City.
Dive Deeper: Advanced League City STR Market Data (2026)
Ready to unlock more insights? AirROI provides access to advanced metrics and comprehensive Airbnb data for League City. Explore detailed analytics beyond this report to refine your investment strategy, optimize pricing, and maximize your vacation rental profits.
Explore Advanced MetricsLeague City Short-Term Rental Market Composition (2026): Property & Room Types
Room Type Distribution
Property Type Distribution
Market Composition Insights for League City
- The League City Airbnb market composition is heavily skewed towards Entire Home/Apt listings, which make up 79.7% of the 79 active rentals. This indicates strong guest preference for privacy and space.
- Looking at the property type distribution in League City, House properties are the most common (75.9%), reflecting the local real estate landscape.
- Houses represent a significant 75.9% portion, catering likely to families or larger groups.
- Smaller segments like hotel/boutique, others (combined 5.0%) offer potential for unique stay experiences.
League City Airbnb Room Capacity Analysis (2026): Bedroom Distribution
Distribution of Listings by Number of Bedrooms
Room Capacity Insights for League City
- The dominant room capacity in League City is 3 bedrooms listings, making up 29.1% of the market. This suggests a strong demand for properties suitable for families or small groups.
- Together, 3 bedrooms and 1 bedroom properties represent 53.2% of the active Airbnb listings in League City, indicating a high concentration in these sizes.
- A significant 46.9% of listings offer 3+ bedrooms, catering to larger groups and families seeking more space in League City.
League City Vacation Rental Guest Capacity Trends (2026)
Distribution of Listings by Guest Capacity
Guest Capacity Insights for League City
- The most common guest capacity trend in League City vacation rentals is listings accommodating 8+ guests (31.6%). This suggests the primary traveler segment is likely larger groups.
- Properties designed for 8+ guests and 2 guests dominate the League City STR market, accounting for 48.1% of listings.
- 49.4% of properties accommodate 6+ guests, serving the market segment for larger families or group travel in League City.
- On average, properties in League City are equipped to host 4.6 guests.
League City Airbnb Booking Patterns (2026): Available vs. Booked Days
Available Days Distribution
Booked Days Distribution
Booking Pattern Insights for League City
- The most common availability pattern in League City falls within the 271-366 days range, representing 50.6% of listings. This suggests many properties have significant open periods on their calendars.
- Approximately 75.9% of listings show high availability (181+ days open annually), indicating potential for increased bookings or specific owner usage patterns.
- For booked days, the 31-90 days range is most frequent in League City (32.9%), reflecting common guest stay durations or potential owner blocking patterns.
- A notable 24.0% of properties secure long booking periods (181+ days booked per year), highlighting successful long-term rental strategies or significant owner usage.
League City Airbnb Minimum Stay Requirements Analysis
Distribution of Listings by Minimum Night Requirement
1 Night
14 listings
17.7% of total
2 Nights
21 listings
26.6% of total
3 Nights
8 listings
10.1% of total
4-6 Nights
1 listings
1.3% of total
7-29 Nights
2 listings
2.5% of total
30+ Nights
33 listings
41.8% of total
Key Insights
- The most prevalent minimum stay requirement in League City is 30+ Nights, adopted by 41.8% of listings. This highlights the market's preference for longer commitments.
- A significant segment (41.8%) caters to monthly stays (30+ nights) in League City, pointing to opportunities in the extended-stay market.
Recommendations
- Align with the market by considering a 30+ Nights minimum stay, as 41.8% of League City hosts use this setting.
- If feasible, allowing 1-night stays, especially midweek or during low season, could capture last-minute bookings, as only 17.7% currently do.
- Explore offering discounts for stays of 30+ nights to attract the 41.8% of the market seeking extended stays.
- Adjust minimum nights based on seasonality – potentially shorter during low season and longer during peak demand periods in League City.
League City Airbnb Cancellation Policy Trends Analysis (2026)
Limited
1 listings
1.3% of total
Super Strict 30 Days
1 listings
1.3% of total
Flexible
25 listings
31.6% of total
Moderate
19 listings
24.1% of total
Firm
24 listings
30.4% of total
Strict
9 listings
11.4% of total
Cancellation Policy Insights for League City
- The prevailing Airbnb cancellation policy trend in League City is Flexible, used by 31.6% of listings.
- There's a relatively balanced mix between guest-friendly (55.7%) and stricter (41.8%) policies, offering choices for different guest needs.
Recommendations for Hosts
- Consider adopting a Flexible policy to align with the 31.6% market standard in League City.
- Using a Strict policy might deter some guests, as only 11.4% of listings use it. Evaluate if potential revenue protection outweighs possible lower booking rates.
- Regularly review your cancellation policy against competitors and market demand shifts in League City.
League City STR Booking Lead Time Analysis (2026)
Average Booking Lead Time by Month
Booking Lead Time Insights for League City
- The overall average booking lead time for vacation rentals in League City is 29 days.
- Guests book furthest in advance for stays during December (average 41 days), likely coinciding with peak travel demand or local events.
- The shortest booking windows occur for stays in February (average 20 days), indicating more last-minute travel plans during this time.
- Seasonally, Spring (34 days avg.) sees the longest lead times, while Winter (29 days avg.) has the shortest, reflecting typical travel planning cycles.
Recommendations for Hosts
- Use the overall average lead time (29 days) as a baseline for your pricing and availability strategy in League City.
- For December stays, consider implementing length-of-stay discounts or slightly higher rates for bookings made less than 41 days out to capitalize on advance planning.
- Target marketing efforts for the Spring season well in advance (at least 34 days) to capture early planners.
- Monitor your own booking lead times against these League City averages to identify opportunities for dynamic pricing adjustments.
Popular & Essential Airbnb Amenities in League City (2026)
Amenity Prevalence
Amenity Insights for League City
- Essential amenities in League City that guests expect include: Kitchen, Wifi, Air conditioning, TV, Heating. Lacking these (any) could significantly impact bookings.
- Popular amenities like Free parking on premises, Washer, Refrigerator are common but not universal. Offering these can provide a competitive edge.
Recommendations for Hosts
- Ensure your listing includes all essential amenities for League City: Kitchen, Wifi, Air conditioning, TV, Heating.
- Prioritize adding missing essentials: Kitchen, Wifi, Air conditioning, TV, Heating.
- Consider adding popular differentiators like Free parking on premises or Washer to increase appeal.
- Highlight unique or less common amenities you offer (e.g., hot tub, dedicated workspace, EV charger) in your listing description and photos.
- Regularly check competitor amenities in League City to stay competitive.
League City Airbnb Guest Demographics & Profile Analysis (2026)
Guest Profile Summary for League City
- The typical guest profile for Airbnb in League City consists of primarily domestic travelers (96%), often arriving from nearby Houston, typically belonging to the Post-2000s (Gen Z/Alpha) group (50%), primarily speaking English or Spanish.
- Domestic travelers account for 95.8% of guests.
- Key international markets include United States (95.8%) and Canada (0.8%).
- Top languages spoken are English (69.1%) followed by Spanish (20.1%).
- A significant demographic segment is the Post-2000s (Gen Z/Alpha) group, representing 50% of guests.
Recommendations for Hosts
- Target domestic marketing efforts towards travelers from Houston and Austin.
- Tailor amenities and listing descriptions to appeal to the dominant Post-2000s (Gen Z/Alpha) demographic (e.g., highlight fast WiFi, smart home features, local guides).
- Highlight unique local experiences or amenities relevant to the primary guest profile.
- Consider seasonal promotions aligned with peak travel times for key origin markets.
Nearby Short-Term Rental Market Comparison
How does the League City Airbnb market stack up against its neighbors? Compare key performance metrics like average monthly revenue, ADR, and occupancy rates in surrounding areas to understand the broader regional STR landscape.
| Market | Active Properties | Monthly Revenue | Daily Rate | Avg. Occupancy |
|---|---|---|---|---|
| Fairfield | 10 | $4,761 | $360.96 | 42% |
| Midfield | 10 | $4,574 | $539.57 | 23% |
| Jamaica Beach | 199 | $3,774 | $394.20 | 37% |
| Crystal Beach | 143 | $3,768 | $408.48 | 35% |
| Bolivar Peninsula | 913 | $3,311 | $396.49 | 34% |
| Columbus | 17 | $3,218 | $413.88 | 29% |
| Deer Park | 14 | $3,208 | $228.63 | 51% |
| Schulenburg | 25 | $3,157 | $349.06 | 31% |
| Chappell Hill | 11 | $2,947 | $509.72 | 31% |
| Seabrook | 54 | $2,872 | $263.19 | 39% |