Laredo Airbnb Market Analysis 2026: Short Term Rental Data & Vacation Rental Statistics in Texas, United States
Is Airbnb profitable in Laredo in 2026? Explore comprehensive Airbnb analytics for Laredo, Texas, United States to uncover income potential. This 2026 STR market report for Laredo, based on AirROI data from February 2025 to January 2026, reveals key trends in the market of 262 active listings.
Whether you're considering an Airbnb investment in Laredo, optimizing your existing vacation rental, or exploring rental arbitrage opportunities, understanding the Laredo Airbnb data is crucial. Leveraging the low regulation environment is key to maximizing your short term rental income potential. Let's dive into the specifics.
Key Laredo Airbnb Performance Metrics Overview
Monthly Airbnb Revenue Variations & Income Potential in Laredo (2026)
Understanding the monthly revenue variations for Airbnb listings in Laredo is key to maximizing your short term rental income potential. Seasonality significantly impacts earnings. Our analysis, based on data from the past 12 months, shows that the peak revenue month for STRs in Laredo is typically March, while January often presents the lowest earnings, highlighting opportunities for strategic pricing adjustments during shoulder and low seasons. Explore the typical Airbnb income in Laredo across different performance tiers:
- Best-in-class properties (Top 10%) achieve $3,804+ monthly, often utilizing dynamic pricing and superior guest experiences.
- Strong performing properties (Top 25%) earn $2,383 or more, indicating effective management and desirable locations/amenities.
- Typical properties (Median) generate around $1,261 per month, representing the average market performance.
- Entry-level properties (Bottom 25%) see earnings around $602, often with potential for optimization.
Average Monthly Airbnb Earnings Trend in Laredo
Laredo Airbnb Occupancy Rate Trends (2026)
Maximize your bookings by understanding the Laredo STR occupancy trends. Seasonal demand shifts significantly influence how often properties are booked. Typically, Februarysees the highest demand (peak season occupancy), while January experiences the lowest (low season). Effective strategies, like adjusting minimum stays or offering promotions, can boost occupancy during slower periods. Here's how different property tiers perform in Laredo:
- Best-in-class properties (Top 10%) achieve 79%+ occupancy, indicating high desirability and potentially optimized availability.
- Strong performing properties (Top 25%) maintain 62% or higher occupancy, suggesting good market fit and guest satisfaction.
- Typical properties (Median) have an occupancy rate around 38%.
- Entry-level properties (Bottom 25%) average 18% occupancy, potentially facing higher vacancy.
Average Monthly Occupancy Rate Trend in Laredo
Average Daily Rate (ADR) Airbnb Trends in Laredo (2026)
Effective short term rental pricing strategy in Laredo involves understanding monthly ADR fluctuations. The Average Daily Rate (ADR) for Airbnb in Laredo typically peaks in October and dips lowest during March. Leveraging Airbnb dynamic pricing tools or strategies based on this seasonality can significantly boost revenue. Here's a look at the typical nightly rates achieved:
- Best-in-class properties (Top 10%) command rates of $229+ per night, often due to premium features or locations.
- Strong performing properties (Top 25%) achieve nightly rates of $164 or more.
- Typical properties (Median) charge around $112 per night.
- Entry-level properties (Bottom 25%) earn around $76 per night.
Average Daily Rate (ADR) Trend by Month in Laredo
Get Live Laredo Market Intelligence 👇

Explore Real-time Analytics
Airbnb Seasonality Analysis & Trends in Laredo (2026)
Peak Season (March, February, June)
- Revenue averages $1,920 per month
- Occupancy rates average 47.4%
- Daily rates average $128
Shoulder Season
- Revenue averages $1,786 per month
- Occupancy maintains around 40.9%
- Daily rates hold near $132
Low Season (January, October, November)
- Revenue drops to average $1,531 per month
- Occupancy decreases to average 36.1%
- Daily rates adjust to average $136
Seasonality Insights for Laredo
- The Airbnb seasonality in Laredo shows moderate seasonality with distinct peak and low periods. While the sections above show seasonal averages, it's also insightful to look at the extremes:
- During the high season, the absolute peak month showcases Laredo's highest earning potential, with monthly revenues capable of climbing to $1,939, occupancy reaching a high of 53.5%, and ADRs peaking at $138.
- Conversely, the slowest single month of the year, typically falling within the low season, marks the market's lowest point. In this month, revenue might dip to $1,315, occupancy could drop to 32.5%, and ADRs may adjust down to $125.
- Understanding both the seasonal averages and these monthly peaks and troughs in revenue, occupancy, and ADR is crucial for maximizing your Airbnb profit potential in Laredo.
Seasonal Strategies for Maximizing Profit
- Peak Season: Maximize revenue through premium pricing and potentially longer minimum stays. Ensure high availability.
- Low Season: Offer competitive pricing, special promotions (e.g., extended stay discounts), and flexible cancellation policies. Target off-season travelers like remote workers or budget-conscious guests.
- Shoulder Seasons: Implement dynamic pricing that balances peak and low rates. Target weekend travelers or specific events. Offer slightly more flexible terms than peak season.
- Regularly analyze your own performance against these Laredo seasonality benchmarks and adjust your pricing and availability strategy accordingly.
Best Areas for Airbnb Investment in Laredo (2026)
Exploring the top neighborhoods for short-term rentals in Laredo? This section highlights key areas, outlining why they are attractive for hosts and guests, along with notable local attractions. Consider these locations based on your target guest profile and investment strategy.
| Neighborhood / Area | Why Host Here? (Target Guests & Appeal) | Key Attractions & Landmarks |
|---|---|---|
| Downtown Laredo | The heart of the city with a vibrant atmosphere, ideal for guests looking to explore local culture, restaurants, and shops. It's a convenient location for business travelers and tourists alike. | Laredo Center for the Arts, San Agustin Plaza, Laredo Convention and Visitors Bureau, Republic of the Rio Grande Museum, La Posada Hotel |
| El último barrio | A historic neighborhood showcasing Laredo's rich heritage, with charming streets and local eateries. It's appealing for guests wanting an authentic experience of Laredo's culture. | Los Dos Laredos Park, La Sancha, San Agustin Cathedral, Old Laredo City Hall, Laredo International Airport |
| San Isidro | A growing residential area known for its family-friendly environment, making it popular for longer Airbnb stays and families visiting friends and relatives. | San Isidro Park, Local schools, Shopping centers, Family restaurants, Community events |
| Colony Park | A quiet suburban area great for travelers looking for a peaceful stay while still being close to urban amenities. Also popular among families and long-term guests. | Colony Park, Local grocery stores, Restaurants, Nearby parks, Schools |
| Laredo Ranchettes | A tranquil location away from the hustle and bustle, popular for those seeking a serene getaway. Offers a more rural experience with beautiful landscapes. | Ranchette properties, Wildlife viewing, Nature trails, Peaceful environment, Local farms |
| Zapata Highway | A major thoroughfare with easy access to shopping and dining, appealing to guests looking for convenience while exploring the city. | Shopping malls, Restaurants, Fast food options, Entertainment venues, Gas stations |
| Lake Casa Blanca | A recreational area with a large lake, perfect for outdoor enthusiasts looking for adventure and relaxation while visiting Laredo. | Lake Casa Blanca, Fishing, Boating, Parks, Picnic areas |
| Las Cruces | A vibrant community area near the border, attractive for those traveling between Texas and Mexico, as well as for cultural experiences. | Local restaurants, Cultural festivals, Community markets, Nearby historical sites, Access to the border |
Understanding Airbnb License Requirements & STR Laws in Laredo (2026)
While Laredo, Texas, United States currently shows low STR regulations, specific Airbnb license requirements might still exist or change. Always verify the latest short term rental regulations and Airbnb license requirements directly with local government authorities for Laredo to ensure full compliance before hosting.
(Source: AirROI data, 2026, finding no licensed listings among those analyzed)
Top Performing Airbnb Properties in Laredo (2026)
Benchmark your potential! Explore examples of top-performing Airbnb properties in Laredobased on Trailing Twelve Month (TTM) revenue. Analyze their characteristics, revenue, occupancy rate, and ADR to understand what drives success in this market.

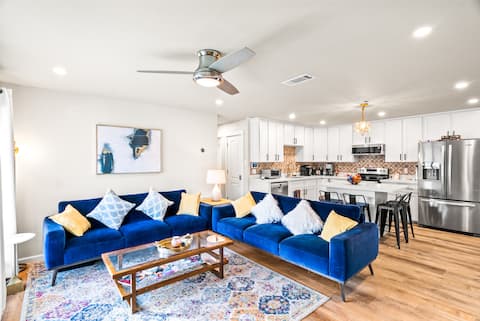
4 BR Retreat with Pool, Gameroom, 2 Master Suites
Entire Place • 4 bedrooms
Casa del Sol: Luxury Heatable Pool w/ Guest House
Entire Place • 5 bedrooms

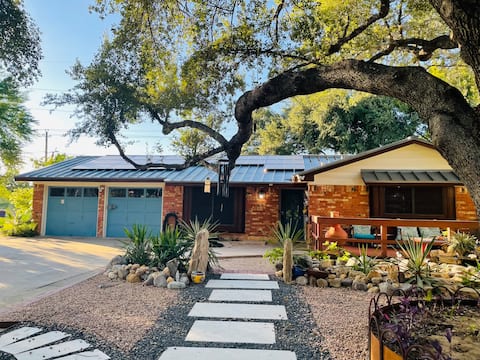
Casa de Paz - North Laredo - Pool - 2 story home
Entire Place • 3 bedrooms
Casa-Zen-trally located 4 bedroom with a pool
Entire Place • 4 bedrooms
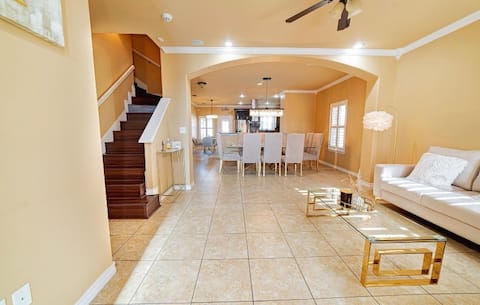
My Nest
Entire Place • 5 bedrooms
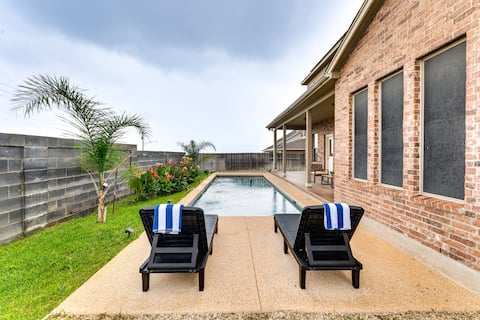
7 Mi to Lake Casa Blanca: Laredo Family Home!
Entire Place • 5 bedrooms
Note: Performance varies based on location, size, amenities, seasonality, and management quality. Data reflects the past 12 months.
Top Performing Airbnb Hosts in Laredo (2026)
Learn from the best! This table showcases top-performing Airbnb hosts in Laredo based on the number of properties managed and estimated total revenue over the past year. Analyze their scale and performance metrics.
| Host Name | Properties | Grossing Revenue | Stay Reviews | Avg Rating |
|---|---|---|---|---|
| Jairo | 10 | $148,791 | 176 | 4.94/5.0 |
| Alejandro | 7 | $145,824 | 166 | 4.96/5.0 |
| Michelle | 4 | $144,632 | 429 | 4.97/5.0 |
| Christopher | 6 | $137,515 | 128 | 4.74/5.0 |
| Alma Delia | 8 | $115,644 | 316 | 4.89/5.0 |
| Rosie | 2 | $113,751 | 31 | 5.00/5.0 |
| Mrs. G | 5 | $105,779 | 405 | 4.94/5.0 |
| Sylvia | 7 | $102,162 | 1120 | 4.82/5.0 |
| Cynthia | 5 | $101,444 | 863 | 4.98/5.0 |
| Cristina | 5 | $80,180 | 49 | 4.91/5.0 |
Analyzing the strategies of top hosts, such as their property selection, pricing, and guest communication, can offer valuable lessons for optimizing your own Airbnb operations in Laredo.
Dive Deeper: Advanced Laredo STR Market Data (2026)
Ready to unlock more insights? AirROI provides access to advanced metrics and comprehensive Airbnb data for Laredo. Explore detailed analytics beyond this report to refine your investment strategy, optimize pricing, and maximize your vacation rental profits.
Explore Advanced MetricsLaredo Short-Term Rental Market Composition (2026): Property & Room Types
Room Type Distribution
Property Type Distribution
Market Composition Insights for Laredo
- The Laredo Airbnb market composition is heavily skewed towards Entire Home/Apt listings, which make up 88.9% of the 262 active rentals. This indicates strong guest preference for privacy and space.
- Looking at the property type distribution in Laredo, House properties are the most common (49.2%), reflecting the local real estate landscape.
- Houses represent a significant 49.2% portion, catering likely to families or larger groups.
- The presence of 6.5% Hotel/Boutique listings indicates integration with traditional hospitality.
- Smaller segments like others, outdoor/unique (combined 3.4%) offer potential for unique stay experiences.
Laredo Airbnb Room Capacity Analysis (2026): Bedroom Distribution
Distribution of Listings by Number of Bedrooms
Room Capacity Insights for Laredo
- The dominant room capacity in Laredo is 2 bedrooms listings, making up 28.6% of the market. This suggests a strong demand for properties suitable for couples or solo travelers.
- Together, 2 bedrooms and 3 bedrooms properties represent 53.8% of the active Airbnb listings in Laredo, indicating a high concentration in these sizes.
- A significant 35.6% of listings offer 3+ bedrooms, catering to larger groups and families seeking more space in Laredo.
Laredo Vacation Rental Guest Capacity Trends (2026)
Distribution of Listings by Guest Capacity
Guest Capacity Insights for Laredo
- The most common guest capacity trend in Laredo vacation rentals is listings accommodating 8+ guests (20.2%). This suggests the primary traveler segment is likely larger groups.
- Properties designed for 8+ guests and 4 guests dominate the Laredo STR market, accounting for 39.7% of listings.
- 44.6% of properties accommodate 6+ guests, serving the market segment for larger families or group travel in Laredo.
- On average, properties in Laredo are equipped to host 4.8 guests.
Laredo Airbnb Booking Patterns (2026): Available vs. Booked Days
Available Days Distribution
Booked Days Distribution
Booking Pattern Insights for Laredo
- The most common availability pattern in Laredo falls within the 271-366 days range, representing 45.4% of listings. This suggests many properties have significant open periods on their calendars.
- Approximately 82.0% of listings show high availability (181+ days open annually), indicating potential for increased bookings or specific owner usage patterns.
- For booked days, the 91-180 days range is most frequent in Laredo (36.6%), reflecting common guest stay durations or potential owner blocking patterns.
- A notable 20.2% of properties secure long booking periods (181+ days booked per year), highlighting successful long-term rental strategies or significant owner usage.
Laredo Airbnb Minimum Stay Requirements Analysis
Distribution of Listings by Minimum Night Requirement
1 Night
141 listings
53.8% of total
2 Nights
52 listings
19.8% of total
3 Nights
5 listings
1.9% of total
4-6 Nights
4 listings
1.5% of total
7-29 Nights
7 listings
2.7% of total
30+ Nights
53 listings
20.2% of total
Key Insights
- The most prevalent minimum stay requirement in Laredo is 1 Night, adopted by 53.8% of listings. This highlights the market's preference for shorter, flexible bookings.
- A strong majority (73.6%) of the Laredo Airbnb data shows acceptance of very short stays (1-2 nights), indicating a dynamic, high-turnover market.
- A significant segment (20.2%) caters to monthly stays (30+ nights) in Laredo, pointing to opportunities in the extended-stay market.
Recommendations
- Align with the market by considering a 1 Night minimum stay, as 53.8% of Laredo hosts use this setting.
- Explore offering discounts for stays of 30+ nights to attract the 20.2% of the market seeking extended stays.
- Adjust minimum nights based on seasonality – potentially shorter during low season and longer during peak demand periods in Laredo.
Laredo Airbnb Cancellation Policy Trends Analysis (2026)
Limited
5 listings
1.9% of total
Flexible
113 listings
43.1% of total
Moderate
89 listings
34% of total
Firm
33 listings
12.6% of total
Strict
22 listings
8.4% of total
Cancellation Policy Insights for Laredo
- The prevailing Airbnb cancellation policy trend in Laredo is Flexible, used by 43.1% of listings.
- The market strongly favors guest-friendly terms, with 77.1% of listings offering Flexible or Moderate policies. This suggests guests in Laredo may expect booking flexibility.
- Strict cancellation policies are quite rare (8.4%), potentially making listings with this policy less competitive unless justified by high demand or property type.
Recommendations for Hosts
- Consider adopting a Flexible policy to align with the 43.1% market standard in Laredo.
- Using a Strict policy might deter some guests, as only 8.4% of listings use it. Evaluate if potential revenue protection outweighs possible lower booking rates.
- Regularly review your cancellation policy against competitors and market demand shifts in Laredo.
Laredo STR Booking Lead Time Analysis (2026)
Average Booking Lead Time by Month
Booking Lead Time Insights for Laredo
- The overall average booking lead time for vacation rentals in Laredo is 14 days.
- Guests book furthest in advance for stays during May (average 17 days), likely coinciding with peak travel demand or local events.
- The shortest booking windows occur for stays in August (average 10 days), indicating more last-minute travel plans during this time.
- Seasonally, Spring (14 days avg.) sees the longest lead times, while Summer (12 days avg.) has the shortest, reflecting typical travel planning cycles.
Recommendations for Hosts
- Use the overall average lead time (14 days) as a baseline for your pricing and availability strategy in Laredo.
- Target marketing efforts for the Spring season well in advance (at least 14 days) to capture early planners.
- Monitor your own booking lead times against these Laredo averages to identify opportunities for dynamic pricing adjustments.
Popular & Essential Airbnb Amenities in Laredo (2026)
Amenity Prevalence
Amenity Insights for Laredo
- Essential amenities in Laredo that guests expect include: Air conditioning, TV, Wifi, Free parking on premises. Lacking these (any) could significantly impact bookings.
- Popular amenities like Kitchen, Hot water, Smoke alarm are common but not universal. Offering these can provide a competitive edge.
Recommendations for Hosts
- Ensure your listing includes all essential amenities for Laredo: Air conditioning, TV, Wifi, Free parking on premises.
- Prioritize adding missing essentials: Air conditioning, TV, Wifi, Free parking on premises.
- Consider adding popular differentiators like Kitchen or Hot water to increase appeal.
- Highlight unique or less common amenities you offer (e.g., hot tub, dedicated workspace, EV charger) in your listing description and photos.
- Regularly check competitor amenities in Laredo to stay competitive.
Laredo Airbnb Guest Demographics & Profile Analysis (2026)
Guest Profile Summary for Laredo
- The typical guest profile for Airbnb in Laredo consists of primarily domestic travelers (76%), often arriving from nearby San Antonio, typically belonging to the Post-2000s (Gen Z/Alpha) group (50%), primarily speaking English or Spanish.
- Domestic travelers account for 75.7% of guests.
- Key international markets include United States (75.7%) and Mexico (21.7%).
- Top languages spoken are English (53.2%) followed by Spanish (41.5%).
- A significant demographic segment is the Post-2000s (Gen Z/Alpha) group, representing 50% of guests.
Recommendations for Hosts
- Target domestic marketing efforts towards travelers from San Antonio and Monterrey.
- Tailor amenities and listing descriptions to appeal to the dominant Post-2000s (Gen Z/Alpha) demographic (e.g., highlight fast WiFi, smart home features, local guides).
- Highlight unique local experiences or amenities relevant to the primary guest profile.
- Consider seasonal promotions aligned with peak travel times for key origin markets.
Nearby Short-Term Rental Market Comparison
How does the Laredo Airbnb market stack up against its neighbors? Compare key performance metrics like average monthly revenue, ADR, and occupancy rates in surrounding areas to understand the broader regional STR landscape.
| Market | Active Properties | Monthly Revenue | Daily Rate | Avg. Occupancy |
|---|---|---|---|---|
| Alton | 13 | $2,484 | $392.58 | 23% |
| Mission | 136 | $1,334 | $150.02 | 36% |
| McAllen | 484 | $1,097 | $132.40 | 37% |
| San Juan | 44 | $1,026 | $118.48 | 40% |
| Pharr | 152 | $997 | $112.18 | 37% |
| Edinburg | 257 | $973 | $109.84 | 40% |
| Zapata | 11 | $951 | $136.20 | 27% |
| Eagle Pass | 110 | $897 | $140.00 | 31% |
| Rosita | 12 | $765 | $158.71 | 22% |
| Chula Vista | 20 | $724 | $120.89 | 26% |