Laguna Vista Airbnb Market Analysis 2026: Short Term Rental Data & Vacation Rental Statistics in Texas, United States
Is Airbnb profitable in Laguna Vista in 2026? Explore comprehensive Airbnb analytics for Laguna Vista, Texas, United States to uncover income potential. This 2026 STR market report for Laguna Vista, based on AirROI data from February 2025 to January 2026, reveals key trends in the niche market of 95 active listings.
Whether you're considering an Airbnb investment in Laguna Vista, optimizing your existing vacation rental, or exploring rental arbitrage opportunities, understanding the Laguna Vista Airbnb data is crucial. Leveraging the low regulation environment is key to maximizing your short term rental income potential. Let's dive into the specifics.
Key Laguna Vista Airbnb Performance Metrics Overview
Monthly Airbnb Revenue Variations & Income Potential in Laguna Vista (2026)
Understanding the monthly revenue variations for Airbnb listings in Laguna Vista is key to maximizing your short term rental income potential. Seasonality significantly impacts earnings. Our analysis, based on data from the past 12 months, shows that the peak revenue month for STRs in Laguna Vista is typically July, while September often presents the lowest earnings, highlighting opportunities for strategic pricing adjustments during shoulder and low seasons. Explore the typical Airbnb income in Laguna Vista across different performance tiers:
- Best-in-class properties (Top 10%) achieve $5,503+ monthly, often utilizing dynamic pricing and superior guest experiences.
- Strong performing properties (Top 25%) earn $3,648 or more, indicating effective management and desirable locations/amenities.
- Typical properties (Median) generate around $2,207 per month, representing the average market performance.
- Entry-level properties (Bottom 25%) see earnings around $1,244, often with potential for optimization.
Average Monthly Airbnb Earnings Trend in Laguna Vista
Laguna Vista Airbnb Occupancy Rate Trends (2026)
Maximize your bookings by understanding the Laguna Vista STR occupancy trends. Seasonal demand shifts significantly influence how often properties are booked. Typically, Marchsees the highest demand (peak season occupancy), while December experiences the lowest (low season). Effective strategies, like adjusting minimum stays or offering promotions, can boost occupancy during slower periods. Here's how different property tiers perform in Laguna Vista:
- Best-in-class properties (Top 10%) achieve 70%+ occupancy, indicating high desirability and potentially optimized availability.
- Strong performing properties (Top 25%) maintain 56% or higher occupancy, suggesting good market fit and guest satisfaction.
- Typical properties (Median) have an occupancy rate around 33%.
- Entry-level properties (Bottom 25%) average 18% occupancy, potentially facing higher vacancy.
Average Monthly Occupancy Rate Trend in Laguna Vista
Average Daily Rate (ADR) Airbnb Trends in Laguna Vista (2026)
Effective short term rental pricing strategy in Laguna Vista involves understanding monthly ADR fluctuations. The Average Daily Rate (ADR) for Airbnb in Laguna Vista typically peaks in December and dips lowest during February. Leveraging Airbnb dynamic pricing tools or strategies based on this seasonality can significantly boost revenue. Here's a look at the typical nightly rates achieved:
- Best-in-class properties (Top 10%) command rates of $421+ per night, often due to premium features or locations.
- Strong performing properties (Top 25%) achieve nightly rates of $273 or more.
- Typical properties (Median) charge around $202 per night.
- Entry-level properties (Bottom 25%) earn around $162 per night.
Average Daily Rate (ADR) Trend by Month in Laguna Vista
Get Live Laguna Vista Market Intelligence 👇

Explore Real-time Analytics
Airbnb Seasonality Analysis & Trends in Laguna Vista (2026)
Peak Season (July, June, March)
- Revenue averages $3,672 per month
- Occupancy rates average 50.4%
- Daily rates average $247
Shoulder Season
- Revenue averages $2,519 per month
- Occupancy maintains around 34.9%
- Daily rates hold near $247
Low Season (April, September, December)
- Revenue drops to average $2,017 per month
- Occupancy decreases to average 28.2%
- Daily rates adjust to average $249
Seasonality Insights for Laguna Vista
- The Airbnb seasonality in Laguna Vista shows highly seasonal trends requiring careful strategy. While the sections above show seasonal averages, it's also insightful to look at the extremes:
- During the high season, the absolute peak month showcases Laguna Vista's highest earning potential, with monthly revenues capable of climbing to $3,864, occupancy reaching a high of 56.7%, and ADRs peaking at $263.
- Conversely, the slowest single month of the year, typically falling within the low season, marks the market's lowest point. In this month, revenue might dip to $1,928, occupancy could drop to 24.9%, and ADRs may adjust down to $226.
- Understanding both the seasonal averages and these monthly peaks and troughs in revenue, occupancy, and ADR is crucial for maximizing your Airbnb profit potential in Laguna Vista.
Seasonal Strategies for Maximizing Profit
- Peak Season: Maximize revenue through premium pricing and potentially longer minimum stays. Ensure high availability.
- Low Season: Offer competitive pricing, special promotions (e.g., extended stay discounts), and flexible cancellation policies. Target off-season travelers like remote workers or budget-conscious guests.
- Shoulder Seasons: Implement dynamic pricing that balances peak and low rates. Target weekend travelers or specific events. Offer slightly more flexible terms than peak season.
- Regularly analyze your own performance against these Laguna Vista seasonality benchmarks and adjust your pricing and availability strategy accordingly.
Best Areas for Airbnb Investment in Laguna Vista (2026)
Exploring the top neighborhoods for short-term rentals in Laguna Vista? This section highlights key areas, outlining why they are attractive for hosts and guests, along with notable local attractions. Consider these locations based on your target guest profile and investment strategy.
| Neighborhood / Area | Why Host Here? (Target Guests & Appeal) | Key Attractions & Landmarks |
|---|---|---|
| Laguna Madre | A beautiful natural area with access to outdoor activities like fishing, sailing, and wildlife watching. It attracts tourists looking for a peaceful retreat near the water. | Laguna Atascosa National Wildlife Refuge, South Padre Island, Fishing trips, Ecotourism tours, Kayaking, Birdwatching |
| South Padre Island | A popular beach destination known for its beautiful sandy beaches and vibrant nightlife. Great for families and young adults alike, making it ideal for diverse Airbnb guests. | South Padre Island Beach, Sea Turtle Inc., Schlitterbahn Waterpark, Port Isabel Lighthouse, Sea Life Center, SPI Birding and Nature Center |
| Port Isabel | A charming coastal town with rich history and access to the bay. Great for those interested in local culture and history while still being close to the beach. | Port Isabel Historical Museum, Queen Isabella State Fishing Pier, Pirate's Landing Fishing Pier, Port Isabel Lighthouse, Dolphin Watching Tours |
| Laguna Vista | This area offers a small-town charm with access to scenic views of the Laguna Madre and recreational activities like golfing and water sports. | Laguna Vista Golf Course, Cameron County Parks, Waterfront access, Birdwatching opportunities, Local dining options |
| Boca Chica Beach | A less crowded alternative to the more popular beaches, known for its natural beauty and proximity to the SpaceX launch site, attracting curious visitors. | Boca Chica Beach, SpaceX launch viewing, Natural sand dunes, Wildlife viewing, Beachcombing |
| Brownsville | A vibrant city that offers a mix of cultural experiences, historical sites, and access to the nearby beaches, ideal for visitors looking for a city vibe close to nature. | Historic Brownsville Museum, Gladys Porter Zoo, Brownsville Scenic Drive, Sabal Palm Sanctuary, Resaca de la Palma State Park |
| Southmost | A rapidly developing area appealing to tourists who want to explore both urban amenities and natural attractions, perfect for a diverse range of visitors. | Resaca de la Palma, Local eateries, Shopping areas, Cultural festivals, Nature trails |
| West Palm Beach | Offering a unique blend of urban and coastal lifestyles, with luxury amenities and beautiful parks, ideal for affluent tourists or longer stays. | Parks and gardens, Golf courses, Shopping districts, Fine dining, Nature reserves |
Understanding Airbnb License Requirements & STR Laws in Laguna Vista (2026)
While Laguna Vista, Texas, United States currently shows low STR regulations, specific Airbnb license requirements might still exist or change. Always verify the latest short term rental regulations and Airbnb license requirements directly with local government authorities for Laguna Vista to ensure full compliance before hosting.
(Source: AirROI data, 2026, finding no licensed listings among those analyzed)
Top Performing Airbnb Properties in Laguna Vista (2026)
Benchmark your potential! Explore examples of top-performing Airbnb properties in Laguna Vistabased on Trailing Twelve Month (TTM) revenue. Analyze their characteristics, revenue, occupancy rate, and ADR to understand what drives success in this market.
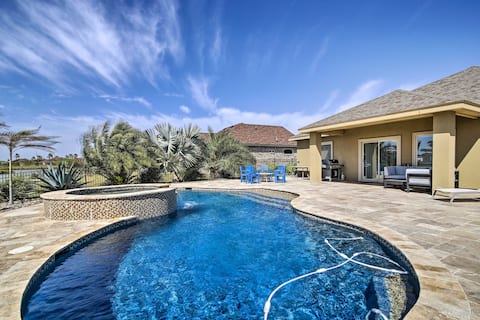
Laguna Vista Resort-Style Home, Private Pool & Spa
Entire Place • 3 bedrooms
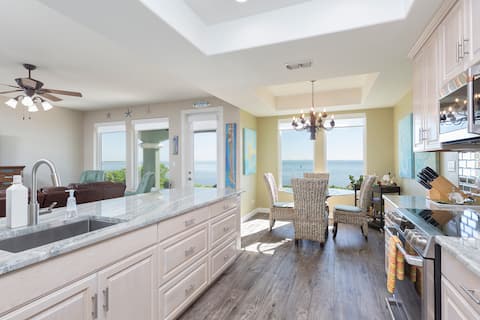
A little bit of Heaven on the water! Permit#H00007
Entire Place • 3 bedrooms
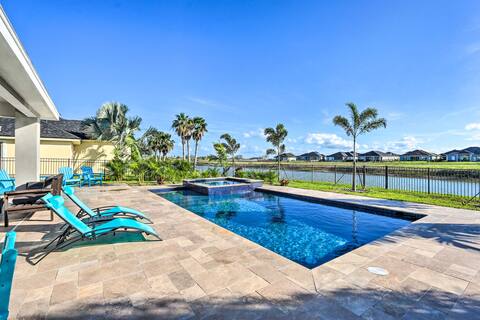
Stunning Laguna Vista Retreat w/ Pool & Grill
Entire Place • 3 bedrooms
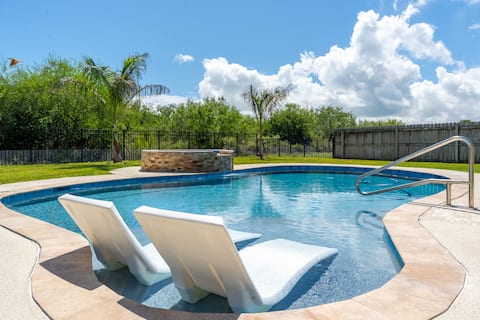
Poolside retreat/golf/p-ball/pets/tennis/fenced
Entire Place • 3 bedrooms

Swim, Golf & Unwind: Laguna Vista Vacation Home!
Entire Place • 3 bedrooms
South Padre Paradise w/ Saltwater Pool Near Golf!
Entire Place • 3 bedrooms
Note: Performance varies based on location, size, amenities, seasonality, and management quality. Data reflects the past 12 months.
Top Performing Airbnb Hosts in Laguna Vista (2026)
Learn from the best! This table showcases top-performing Airbnb hosts in Laguna Vista based on the number of properties managed and estimated total revenue over the past year. Analyze their scale and performance metrics.
| Host Name | Properties | Grossing Revenue | Stay Reviews | Avg Rating |
|---|---|---|---|---|
| Janet Vega-Bush | 40 | $503,702 | 406 | 4.81/5.0 |
| Evolve | 8 | $260,545 | 291 | 4.68/5.0 |
| Dani Milo | 2 | $89,724 | 25 | 4.93/5.0 |
| Harry | 2 | $84,582 | 73 | 4.93/5.0 |
| Tiffany | 1 | $42,183 | 15 | 4.80/5.0 |
| Sonya | 1 | $41,998 | 36 | 5.00/5.0 |
| David And Robin Conro | 2 | $41,991 | 77 | 4.96/5.0 |
| Danny | 1 | $39,926 | 39 | 4.82/5.0 |
| John | 1 | $37,367 | 10 | 4.60/5.0 |
| Carrie | 1 | $34,696 | 134 | 4.93/5.0 |
Analyzing the strategies of top hosts, such as their property selection, pricing, and guest communication, can offer valuable lessons for optimizing your own Airbnb operations in Laguna Vista.
Dive Deeper: Advanced Laguna Vista STR Market Data (2026)
Ready to unlock more insights? AirROI provides access to advanced metrics and comprehensive Airbnb data for Laguna Vista. Explore detailed analytics beyond this report to refine your investment strategy, optimize pricing, and maximize your vacation rental profits.
Explore Advanced MetricsLaguna Vista Short-Term Rental Market Composition (2026): Property & Room Types
Room Type Distribution
Property Type Distribution
Market Composition Insights for Laguna Vista
- The Laguna Vista Airbnb market composition is heavily skewed towards Entire Home/Apt listings, which make up 100% of the 95 active rentals. This indicates strong guest preference for privacy and space.
- Looking at the property type distribution in Laguna Vista, House properties are the most common (91.6%), reflecting the local real estate landscape.
- Houses represent a significant 91.6% portion, catering likely to families or larger groups.
- Smaller segments like hotel/boutique, others (combined 2.2%) offer potential for unique stay experiences.
Laguna Vista Airbnb Room Capacity Analysis (2026): Bedroom Distribution
Distribution of Listings by Number of Bedrooms
Room Capacity Insights for Laguna Vista
- The dominant room capacity in Laguna Vista is 3 bedrooms listings, making up 54.7% of the market. This suggests a strong demand for properties suitable for families or small groups.
- Together, 3 bedrooms and 2 bedrooms properties represent 92.6% of the active Airbnb listings in Laguna Vista, indicating a high concentration in these sizes.
- A significant 57.9% of listings offer 3+ bedrooms, catering to larger groups and families seeking more space in Laguna Vista.
Laguna Vista Vacation Rental Guest Capacity Trends (2026)
Distribution of Listings by Guest Capacity
Guest Capacity Insights for Laguna Vista
- The most common guest capacity trend in Laguna Vista vacation rentals is listings accommodating 6 guests (42.1%). This suggests the primary traveler segment is likely larger groups.
- Properties designed for 6 guests and 8+ guests dominate the Laguna Vista STR market, accounting for 75.8% of listings.
- 83.2% of properties accommodate 6+ guests, serving the market segment for larger families or group travel in Laguna Vista.
- On average, properties in Laguna Vista are equipped to host 6.4 guests.
Laguna Vista Airbnb Booking Patterns (2026): Available vs. Booked Days
Available Days Distribution
Booked Days Distribution
Booking Pattern Insights for Laguna Vista
- The most common availability pattern in Laguna Vista falls within the 271-366 days range, representing 67.4% of listings. This suggests many properties have significant open periods on their calendars.
- Approximately 92.7% of listings show high availability (181+ days open annually), indicating potential for increased bookings or specific owner usage patterns.
- For booked days, the 31-90 days range is most frequent in Laguna Vista (43.2%), reflecting common guest stay durations or potential owner blocking patterns.
- A notable 7.4% of properties secure long booking periods (181+ days booked per year), highlighting successful long-term rental strategies or significant owner usage.
Laguna Vista Airbnb Minimum Stay Requirements Analysis
Distribution of Listings by Minimum Night Requirement
1 Night
4 listings
4.2% of total
2 Nights
22 listings
23.2% of total
3 Nights
11 listings
11.6% of total
4-6 Nights
4 listings
4.2% of total
7-29 Nights
2 listings
2.1% of total
30+ Nights
52 listings
54.7% of total
Key Insights
- The most prevalent minimum stay requirement in Laguna Vista is 30+ Nights, adopted by 54.7% of listings. This highlights the market's preference for longer commitments.
- A significant segment (54.7%) caters to monthly stays (30+ nights) in Laguna Vista, pointing to opportunities in the extended-stay market.
Recommendations
- Align with the market by considering a 30+ Nights minimum stay, as 54.7% of Laguna Vista hosts use this setting.
- If feasible, allowing 1-night stays, especially midweek or during low season, could capture last-minute bookings, as only 4.2% currently do.
- Explore offering discounts for stays of 30+ nights to attract the 54.7% of the market seeking extended stays.
- Adjust minimum nights based on seasonality – potentially shorter during low season and longer during peak demand periods in Laguna Vista.
Laguna Vista Airbnb Cancellation Policy Trends Analysis (2026)
Super Strict 30 Days
2 listings
2.1% of total
Flexible
9 listings
9.5% of total
Moderate
53 listings
55.8% of total
Firm
20 listings
21.1% of total
Strict
11 listings
11.6% of total
Cancellation Policy Insights for Laguna Vista
- The prevailing Airbnb cancellation policy trend in Laguna Vista is Moderate, used by 55.8% of listings.
- There's a relatively balanced mix between guest-friendly (65.3%) and stricter (32.7%) policies, offering choices for different guest needs.
Recommendations for Hosts
- Consider adopting a Moderate policy to align with the 55.8% market standard in Laguna Vista.
- Using a Strict policy might deter some guests, as only 11.6% of listings use it. Evaluate if potential revenue protection outweighs possible lower booking rates.
- Regularly review your cancellation policy against competitors and market demand shifts in Laguna Vista.
Laguna Vista STR Booking Lead Time Analysis (2026)
Average Booking Lead Time by Month
Booking Lead Time Insights for Laguna Vista
- The overall average booking lead time for vacation rentals in Laguna Vista is 53 days.
- Guests book furthest in advance for stays during February (average 131 days), likely coinciding with peak travel demand or local events.
- The shortest booking windows occur for stays in August (average 25 days), indicating more last-minute travel plans during this time.
- Seasonally, Winter (95 days avg.) sees the longest lead times, while Summer (36 days avg.) has the shortest, reflecting typical travel planning cycles.
Recommendations for Hosts
- Use the overall average lead time (53 days) as a baseline for your pricing and availability strategy in Laguna Vista.
- For February stays, consider implementing length-of-stay discounts or slightly higher rates for bookings made less than 131 days out to capitalize on advance planning.
- Target marketing efforts for the Winter season well in advance (at least 95 days) to capture early planners.
- Monitor your own booking lead times against these Laguna Vista averages to identify opportunities for dynamic pricing adjustments.
Popular & Essential Airbnb Amenities in Laguna Vista (2026)
Amenity Prevalence
Amenity Insights for Laguna Vista
- Essential amenities in Laguna Vista that guests expect include: Air conditioning, Kitchen, Wifi. Lacking these (any) could significantly impact bookings.
- Popular amenities like Microwave, Washer, Refrigerator are common but not universal. Offering these can provide a competitive edge.
Recommendations for Hosts
- Ensure your listing includes all essential amenities for Laguna Vista: Air conditioning, Kitchen, Wifi.
- Prioritize adding missing essentials: Air conditioning, Kitchen, Wifi.
- Consider adding popular differentiators like Microwave or Washer to increase appeal.
- Highlight unique or less common amenities you offer (e.g., hot tub, dedicated workspace, EV charger) in your listing description and photos.
- Regularly check competitor amenities in Laguna Vista to stay competitive.
Laguna Vista Airbnb Guest Demographics & Profile Analysis (2026)
Guest Profile Summary for Laguna Vista
- The typical guest profile for Airbnb in Laguna Vista consists of primarily domestic travelers (93%), often arriving from nearby San Antonio, typically belonging to the Post-2000s (Gen Z/Alpha) group (50%), primarily speaking English or Spanish.
- Domestic travelers account for 93.0% of guests.
- Key international markets include United States (93%) and Mexico (5.5%).
- Top languages spoken are English (61.9%) followed by Spanish (29.4%).
- A significant demographic segment is the Post-2000s (Gen Z/Alpha) group, representing 50% of guests.
Recommendations for Hosts
- Target domestic marketing efforts towards travelers from San Antonio and Houston.
- Tailor amenities and listing descriptions to appeal to the dominant Post-2000s (Gen Z/Alpha) demographic (e.g., highlight fast WiFi, smart home features, local guides).
- Highlight unique local experiences or amenities relevant to the primary guest profile.
- Consider seasonal promotions aligned with peak travel times for key origin markets.
Nearby Short-Term Rental Market Comparison
How does the Laguna Vista Airbnb market stack up against its neighbors? Compare key performance metrics like average monthly revenue, ADR, and occupancy rates in surrounding areas to understand the broader regional STR landscape.
| Market | Active Properties | Monthly Revenue | Daily Rate | Avg. Occupancy |
|---|---|---|---|---|
| City-by-the Sea | 24 | $4,479 | $520.08 | 35% |
| Port Aransas | 2,361 | $3,422 | $437.85 | 34% |
| South Padre Island | 2,347 | $2,957 | $341.64 | 36% |
| Port Mansfield | 29 | $2,788 | $374.59 | 32% |
| Alton | 13 | $2,484 | $392.58 | 23% |
| Rio Hondo | 46 | $2,381 | $309.67 | 31% |
| Port Isabel | 249 | $2,138 | $253.87 | 38% |
| Portland | 10 | $2,123 | $239.57 | 50% |
| Corpus Christi | 1,950 | $2,047 | $224.99 | 39% |
| Kingsville | 16 | $2,008 | $152.10 | 46% |