Kerens Airbnb Market Analysis 2026: Short Term Rental Data & Vacation Rental Statistics in Texas, United States
Is Airbnb profitable in Kerens in 2026? Explore comprehensive Airbnb analytics for Kerens, Texas, United States to uncover income potential. This 2026 STR market report for Kerens, based on AirROI data from February 2025 to January 2026, reveals key trends in the niche market of 36 active listings.
Whether you're considering an Airbnb investment in Kerens, optimizing your existing vacation rental, or exploring rental arbitrage opportunities, understanding the Kerens Airbnb data is crucial. Leveraging the low regulation environment is key to maximizing your short term rental income potential. Let's dive into the specifics.
Key Kerens Airbnb Performance Metrics Overview
Monthly Airbnb Revenue Variations & Income Potential in Kerens (2026)
Understanding the monthly revenue variations for Airbnb listings in Kerens is key to maximizing your short term rental income potential. Seasonality significantly impacts earnings. Our analysis, based on data from the past 12 months, shows that the peak revenue month for STRs in Kerens is typically December, while February often presents the lowest earnings, highlighting opportunities for strategic pricing adjustments during shoulder and low seasons. Explore the typical Airbnb income in Kerens across different performance tiers:
- Best-in-class properties (Top 10%) achieve $3,702+ monthly, often utilizing dynamic pricing and superior guest experiences.
- Strong performing properties (Top 25%) earn $2,307 or more, indicating effective management and desirable locations/amenities.
- Typical properties (Median) generate around $1,294 per month, representing the average market performance.
- Entry-level properties (Bottom 25%) see earnings around $665, often with potential for optimization.
Average Monthly Airbnb Earnings Trend in Kerens
Kerens Airbnb Occupancy Rate Trends (2026)
Maximize your bookings by understanding the Kerens STR occupancy trends. Seasonal demand shifts significantly influence how often properties are booked. Typically, Julysees the highest demand (peak season occupancy), while February experiences the lowest (low season). Effective strategies, like adjusting minimum stays or offering promotions, can boost occupancy during slower periods. Here's how different property tiers perform in Kerens:
- Best-in-class properties (Top 10%) achieve 71%+ occupancy, indicating high desirability and potentially optimized availability.
- Strong performing properties (Top 25%) maintain 50% or higher occupancy, suggesting good market fit and guest satisfaction.
- Typical properties (Median) have an occupancy rate around 31%.
- Entry-level properties (Bottom 25%) average 16% occupancy, potentially facing higher vacancy.
Average Monthly Occupancy Rate Trend in Kerens
Average Daily Rate (ADR) Airbnb Trends in Kerens (2026)
Effective short term rental pricing strategy in Kerens involves understanding monthly ADR fluctuations. The Average Daily Rate (ADR) for Airbnb in Kerens typically peaks in October and dips lowest during February. Leveraging Airbnb dynamic pricing tools or strategies based on this seasonality can significantly boost revenue. Here's a look at the typical nightly rates achieved:
- Best-in-class properties (Top 10%) command rates of $270+ per night, often due to premium features or locations.
- Strong performing properties (Top 25%) achieve nightly rates of $163 or more.
- Typical properties (Median) charge around $131 per night.
- Entry-level properties (Bottom 25%) earn around $106 per night.
Average Daily Rate (ADR) Trend by Month in Kerens
Get Live Kerens Market Intelligence 👇

Explore Real-time Analytics
Airbnb Seasonality Analysis & Trends in Kerens (2026)
Peak Season (December, July, October)
- Revenue averages $2,402 per month
- Occupancy rates average 40.7%
- Daily rates average $167
Shoulder Season
- Revenue averages $1,775 per month
- Occupancy maintains around 34.9%
- Daily rates hold near $162
Low Season (February, March, April)
- Revenue drops to average $1,188 per month
- Occupancy decreases to average 30.7%
- Daily rates adjust to average $146
Seasonality Insights for Kerens
- The Airbnb seasonality in Kerens shows highly seasonal trends requiring careful strategy. While the sections above show seasonal averages, it's also insightful to look at the extremes:
- During the high season, the absolute peak month showcases Kerens's highest earning potential, with monthly revenues capable of climbing to $2,483, occupancy reaching a high of 42.0%, and ADRs peaking at $174.
- Conversely, the slowest single month of the year, typically falling within the low season, marks the market's lowest point. In this month, revenue might dip to $950, occupancy could drop to 25.5%, and ADRs may adjust down to $143.
- Understanding both the seasonal averages and these monthly peaks and troughs in revenue, occupancy, and ADR is crucial for maximizing your Airbnb profit potential in Kerens.
Seasonal Strategies for Maximizing Profit
- Peak Season: Maximize revenue through premium pricing and potentially longer minimum stays. Ensure high availability.
- Low Season: Offer competitive pricing, special promotions (e.g., extended stay discounts), and flexible cancellation policies. Target off-season travelers like remote workers or budget-conscious guests.
- Shoulder Seasons: Implement dynamic pricing that balances peak and low rates. Target weekend travelers or specific events. Offer slightly more flexible terms than peak season.
- Regularly analyze your own performance against these Kerens seasonality benchmarks and adjust your pricing and availability strategy accordingly.
Best Areas for Airbnb Investment in Kerens (2026)
Exploring the top neighborhoods for short-term rentals in Kerens? This section highlights key areas, outlining why they are attractive for hosts and guests, along with notable local attractions. Consider these locations based on your target guest profile and investment strategy.
| Neighborhood / Area | Why Host Here? (Target Guests & Appeal) | Key Attractions & Landmarks |
|---|---|---|
| Lake Kerens | A beautiful lake area that's popular for fishing, boating, and outdoor activities. Ideal for families and nature lovers looking for a peaceful getaway. | Kerens Lake, Kerens Park, Fishing spots, Boating areas, Nature trails |
| Downtown Kerens | The heart of the town with local shops, restaurants, and a close-knit community feel. Great for guests who want to experience local culture and events. | Local diner, Monthly festivals, Community center, antique shops, Kerens Historical Museum |
| Kerens ISD Area | Proximity to the Kerens Independent School District makes this area popular among families visiting or relocating for education. | Kerens Elementary School, Kerens High School, Community sports fields, Family-friendly parks |
| Nearby Corsicana | Just a short drive away, Corsicana offers more options for dining, shopping, and attractions while still being close to Kerens. | Navarro County Courthouse, Cook Center for the Arts, Corsicana Opry, Shopping centers, Restaurants |
| East Texas Outdoor Spots | The surrounding areas of East Texas offer numerous outdoor activities such as hiking, hunting, and nature appreciation, attracting outdoor enthusiasts. | Lake Richland Chambers, Hunting grounds, Nature reserves, Biking trails, Picnic areas |
| Kaufman County | This broader area encompasses charming small towns and access to larger cities while retaining the small-town vibe that's appealing to many travelers. | Historic Kaufman Square, Local parks, Rural scenery, Community events, Shopping districts |
| Kerens Golf Course | For golf enthusiasts, staying near the local golf course provides a mix of leisure and recreation in a scenic setting. | Kerens Golf Course, Country Club facilities, Golf tournaments, Practice ranges, Clubhouse dining |
| Rural Retreats | The outskirts of Kerens offer a rustic charm and peaceful settings, appealing to those looking to escape the hustle and bustle of city life. | Scenic farms, Rural bed and breakfasts, Nature trails, Seasonal festivals, Local fairs |
Understanding Airbnb License Requirements & STR Laws in Kerens (2026)
While Kerens, Texas, United States currently shows low STR regulations, specific Airbnb license requirements might still exist or change. Always verify the latest short term rental regulations and Airbnb license requirements directly with local government authorities for Kerens to ensure full compliance before hosting.
(Source: AirROI data, 2026, finding no licensed listings among those analyzed)
Top Performing Airbnb Properties in Kerens (2026)
Benchmark your potential! Explore examples of top-performing Airbnb properties in Kerensbased on Trailing Twelve Month (TTM) revenue. Analyze their characteristics, revenue, occupancy rate, and ADR to understand what drives success in this market.
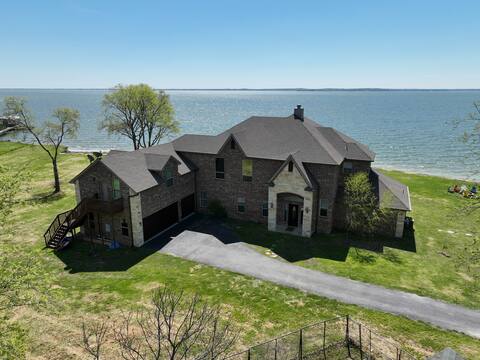
$1M+ Waterfront Villa
Entire Place • 5 bedrooms

Sunrise Cove RC LLC: Lakefront Home w/ 2 Casitas!
Entire Place • 9 bedrooms
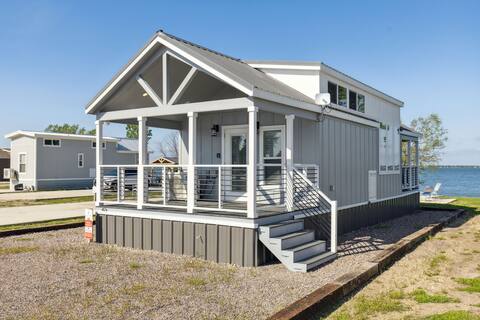
Dazzling + Modern Tiny Lake Home
Entire Place • 2 bedrooms

Modern lake front house
Entire Place • 3 bedrooms

Lofty Lark RV Cottage @ Richland Chambers Lake
Entire Place • 3 bedrooms
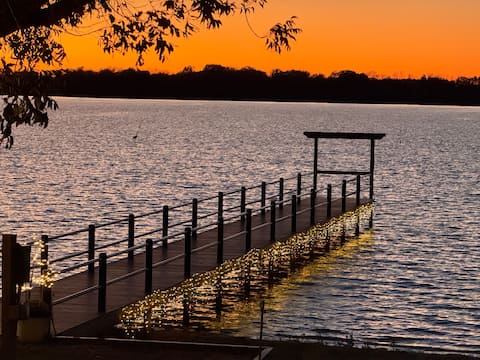
Lakefront - The Lofty Cottage Getaway
Entire Place • N/A
Note: Performance varies based on location, size, amenities, seasonality, and management quality. Data reflects the past 12 months.
Top Performing Airbnb Hosts in Kerens (2026)
Learn from the best! This table showcases top-performing Airbnb hosts in Kerens based on the number of properties managed and estimated total revenue over the past year. Analyze their scale and performance metrics.
| Host Name | Properties | Grossing Revenue | Stay Reviews | Avg Rating |
|---|---|---|---|---|
| Evolve | 6 | $78,453 | 13 | 4.83/5.0 |
| Luis | 1 | $65,434 | 52 | 4.73/5.0 |
| Sandra | 3 | $64,655 | 246 | 4.92/5.0 |
| Jerry | 2 | $37,481 | 95 | 4.82/5.0 |
| Vello Properties | 1 | $36,832 | 112 | 4.85/5.0 |
| Sanket | 1 | $34,789 | 11 | 4.73/5.0 |
| Nancy | 1 | $28,235 | 30 | 4.97/5.0 |
| Kelley | 1 | $26,414 | 29 | 5.00/5.0 |
| Karen | 2 | $25,915 | 42 | 4.99/5.0 |
| Tom | 1 | $24,169 | 114 | 4.97/5.0 |
Analyzing the strategies of top hosts, such as their property selection, pricing, and guest communication, can offer valuable lessons for optimizing your own Airbnb operations in Kerens.
Dive Deeper: Advanced Kerens STR Market Data (2026)
Ready to unlock more insights? AirROI provides access to advanced metrics and comprehensive Airbnb data for Kerens. Explore detailed analytics beyond this report to refine your investment strategy, optimize pricing, and maximize your vacation rental profits.
Explore Advanced MetricsKerens Short-Term Rental Market Composition (2026): Property & Room Types
Room Type Distribution
Property Type Distribution
Market Composition Insights for Kerens
- The Kerens Airbnb market composition is heavily skewed towards Entire Home/Apt listings, which make up 100% of the 36 active rentals. This indicates strong guest preference for privacy and space.
- Looking at the property type distribution in Kerens, House properties are the most common (47.2%), reflecting the local real estate landscape.
- Houses represent a significant 47.2% portion, catering likely to families or larger groups.
- Smaller segments like unique stays (combined 2.8%) offer potential for unique stay experiences.
Kerens Airbnb Room Capacity Analysis (2026): Bedroom Distribution
Distribution of Listings by Number of Bedrooms
Room Capacity Insights for Kerens
- The dominant room capacity in Kerens is 1 bedroom listings, making up 30.6% of the market. This suggests a strong demand for properties suitable for couples or solo travelers.
- Together, 1 bedroom and 2 bedrooms properties represent 58.4% of the active Airbnb listings in Kerens, indicating a high concentration in these sizes.
Kerens Vacation Rental Guest Capacity Trends (2026)
Distribution of Listings by Guest Capacity
Guest Capacity Insights for Kerens
- The most common guest capacity trend in Kerens vacation rentals is listings accommodating 6 guests (30.6%). This suggests the primary traveler segment is likely larger groups.
- Properties designed for 6 guests and 8+ guests dominate the Kerens STR market, accounting for 50.0% of listings.
- 52.8% of properties accommodate 6+ guests, serving the market segment for larger families or group travel in Kerens.
- On average, properties in Kerens are equipped to host 5.4 guests.
Kerens Airbnb Booking Patterns (2026): Available vs. Booked Days
Available Days Distribution
Booked Days Distribution
Booking Pattern Insights for Kerens
- The most common availability pattern in Kerens falls within the 271-366 days range, representing 55.6% of listings. This suggests many properties have significant open periods on their calendars.
- Approximately 86.2% of listings show high availability (181+ days open annually), indicating potential for increased bookings or specific owner usage patterns.
- For booked days, the 31-90 days range is most frequent in Kerens (33.3%), reflecting common guest stay durations or potential owner blocking patterns.
- A notable 13.9% of properties secure long booking periods (181+ days booked per year), highlighting successful long-term rental strategies or significant owner usage.
Kerens Airbnb Minimum Stay Requirements Analysis
Distribution of Listings by Minimum Night Requirement
1 Night
15 listings
41.7% of total
2 Nights
14 listings
38.9% of total
3 Nights
2 listings
5.6% of total
7-29 Nights
1 listings
2.8% of total
30+ Nights
4 listings
11.1% of total
Key Insights
- The most prevalent minimum stay requirement in Kerens is 1 Night, adopted by 41.7% of listings. This highlights the market's preference for shorter, flexible bookings.
- A strong majority (80.6%) of the Kerens Airbnb data shows acceptance of very short stays (1-2 nights), indicating a dynamic, high-turnover market.
- A significant segment (11.1%) caters to monthly stays (30+ nights) in Kerens, pointing to opportunities in the extended-stay market.
Recommendations
- Align with the market by considering a 1 Night minimum stay, as 41.7% of Kerens hosts use this setting.
- Explore offering discounts for stays of 30+ nights to attract the 11.1% of the market seeking extended stays.
- Adjust minimum nights based on seasonality – potentially shorter during low season and longer during peak demand periods in Kerens.
Kerens Airbnb Cancellation Policy Trends Analysis (2026)
Limited
1 listings
2.8% of total
Flexible
9 listings
25% of total
Moderate
6 listings
16.7% of total
Firm
13 listings
36.1% of total
Strict
7 listings
19.4% of total
Cancellation Policy Insights for Kerens
- The prevailing Airbnb cancellation policy trend in Kerens is Firm, used by 36.1% of listings.
- A majority (55.5%) of hosts in Kerens utilize Firm or Strict policies, indicating a market where hosts prioritize booking security.
Recommendations for Hosts
- Consider adopting a Firm policy to align with the 36.1% market standard in Kerens.
- Regularly review your cancellation policy against competitors and market demand shifts in Kerens.
Kerens STR Booking Lead Time Analysis (2026)
Average Booking Lead Time by Month
Booking Lead Time Insights for Kerens
- The overall average booking lead time for vacation rentals in Kerens is 30 days.
- Guests book furthest in advance for stays during May (average 39 days), likely coinciding with peak travel demand or local events.
- The shortest booking windows occur for stays in January (average 8 days), indicating more last-minute travel plans during this time.
- Seasonally, Spring (29 days avg.) sees the longest lead times, while Fall (19 days avg.) has the shortest, reflecting typical travel planning cycles.
Recommendations for Hosts
- Use the overall average lead time (30 days) as a baseline for your pricing and availability strategy in Kerens.
- During January, focus on last-minute booking availability and promotions, as guests book with very short notice (8 days avg.).
- Target marketing efforts for the Spring season well in advance (at least 29 days) to capture early planners.
- Monitor your own booking lead times against these Kerens averages to identify opportunities for dynamic pricing adjustments.
Popular & Essential Airbnb Amenities in Kerens (2026)
Amenity Prevalence
Amenity Insights for Kerens
- Essential amenities in Kerens that guests expect include: Free parking on premises. Lacking these (this) could significantly impact bookings.
- Popular amenities like Smoke alarm, Kitchen, TV are common but not universal. Offering these can provide a competitive edge.
- Warning: Wifi is not universally provided but is considered essential globally. Ensure reliable Wifi is offered.
Recommendations for Hosts
- Ensure your listing includes all essential amenities for Kerens: Free parking on premises.
- Prioritize adding missing essentials: Free parking on premises.
- Consider adding popular differentiators like Smoke alarm or Kitchen to increase appeal.
- Highlight unique or less common amenities you offer (e.g., hot tub, dedicated workspace, EV charger) in your listing description and photos.
- Regularly check competitor amenities in Kerens to stay competitive.
Kerens Airbnb Guest Demographics & Profile Analysis (2026)
Guest Profile Summary for Kerens
- The typical guest profile for Airbnb in Kerens consists of primarily domestic travelers (100%), often arriving from nearby Dallas, typically belonging to the Post-2000s (Gen Z/Alpha) group (50%), primarily speaking English or Spanish.
- Domestic travelers account for 99.5% of guests.
- Key international markets include United States (99.5%) and Mexico (0.5%).
- Top languages spoken are English (75%) followed by Spanish (17.9%).
- A significant demographic segment is the Post-2000s (Gen Z/Alpha) group, representing 50% of guests.
Recommendations for Hosts
- Target domestic marketing efforts towards travelers from Dallas and Houston.
- Tailor amenities and listing descriptions to appeal to the dominant Post-2000s (Gen Z/Alpha) demographic (e.g., highlight fast WiFi, smart home features, local guides).
- Highlight unique local experiences or amenities relevant to the primary guest profile.
- Consider seasonal promotions aligned with peak travel times for key origin markets.
Nearby Short-Term Rental Market Comparison
How does the Kerens Airbnb market stack up against its neighbors? Compare key performance metrics like average monthly revenue, ADR, and occupancy rates in surrounding areas to understand the broader regional STR landscape.
| Market | Active Properties | Monthly Revenue | Daily Rate | Avg. Occupancy |
|---|---|---|---|---|
| Star Harbor | 11 | $5,474 | $741.72 | 33% |
| Valley View | 25 | $5,111 | $484.73 | 39% |
| Bluff Dale | 18 | $4,063 | $411.68 | 29% |
| Red Oak | 17 | $3,978 | $288.35 | 50% |
| DeSoto | 29 | $3,947 | $332.58 | 47% |
| Holly Lake Ranch | 11 | $3,836 | $358.93 | 36% |
| Flower Mound | 79 | $3,760 | $326.24 | 45% |
| Azle | 62 | $3,533 | $323.80 | 41% |
| Westworth Village | 11 | $3,530 | $240.30 | 48% |
| Highland Village | 15 | $3,363 | $345.42 | 48% |