Katy Airbnb Market Analysis 2026: Short Term Rental Data & Vacation Rental Statistics in Texas, United States
Is Airbnb profitable in Katy in 2026? Explore comprehensive Airbnb analytics for Katy, Texas, United States to uncover income potential. This 2026 STR market report for Katy, based on AirROI data from February 2025 to January 2026, reveals key trends in the market of 386 active listings.
Whether you're considering an Airbnb investment in Katy, optimizing your existing vacation rental, or exploring rental arbitrage opportunities, understanding the Katy Airbnb data is crucial. Leveraging the low regulation environment is key to maximizing your short term rental income potential. Let's dive into the specifics.
Key Katy Airbnb Performance Metrics Overview
Monthly Airbnb Revenue Variations & Income Potential in Katy (2026)
Understanding the monthly revenue variations for Airbnb listings in Katy is key to maximizing your short term rental income potential. Seasonality significantly impacts earnings. Our analysis, based on data from the past 12 months, shows that the peak revenue month for STRs in Katy is typically March, while January often presents the lowest earnings, highlighting opportunities for strategic pricing adjustments during shoulder and low seasons. Explore the typical Airbnb income in Katy across different performance tiers:
- Best-in-class properties (Top 10%) achieve $5,215+ monthly, often utilizing dynamic pricing and superior guest experiences.
- Strong performing properties (Top 25%) earn $3,504 or more, indicating effective management and desirable locations/amenities.
- Typical properties (Median) generate around $1,747 per month, representing the average market performance.
- Entry-level properties (Bottom 25%) see earnings around $639, often with potential for optimization.
Average Monthly Airbnb Earnings Trend in Katy
Katy Airbnb Occupancy Rate Trends (2026)
Maximize your bookings by understanding the Katy STR occupancy trends. Seasonal demand shifts significantly influence how often properties are booked. Typically, Marchsees the highest demand (peak season occupancy), while January experiences the lowest (low season). Effective strategies, like adjusting minimum stays or offering promotions, can boost occupancy during slower periods. Here's how different property tiers perform in Katy:
- Best-in-class properties (Top 10%) achieve 79%+ occupancy, indicating high desirability and potentially optimized availability.
- Strong performing properties (Top 25%) maintain 61% or higher occupancy, suggesting good market fit and guest satisfaction.
- Typical properties (Median) have an occupancy rate around 40%.
- Entry-level properties (Bottom 25%) average 20% occupancy, potentially facing higher vacancy.
Average Monthly Occupancy Rate Trend in Katy
Average Daily Rate (ADR) Airbnb Trends in Katy (2026)
Effective short term rental pricing strategy in Katy involves understanding monthly ADR fluctuations. The Average Daily Rate (ADR) for Airbnb in Katy typically peaks in December and dips lowest during February. Leveraging Airbnb dynamic pricing tools or strategies based on this seasonality can significantly boost revenue. Here's a look at the typical nightly rates achieved:
- Best-in-class properties (Top 10%) command rates of $288+ per night, often due to premium features or locations.
- Strong performing properties (Top 25%) achieve nightly rates of $219 or more.
- Typical properties (Median) charge around $153 per night.
- Entry-level properties (Bottom 25%) earn around $55 per night.
Average Daily Rate (ADR) Trend by Month in Katy
Get Live Katy Market Intelligence 👇

Explore Real-time Analytics
Airbnb Seasonality Analysis & Trends in Katy (2026)
Peak Season (March, July, August)
- Revenue averages $2,793 per month
- Occupancy rates average 49.3%
- Daily rates average $157
Shoulder Season
- Revenue averages $2,419 per month
- Occupancy maintains around 41.4%
- Daily rates hold near $165
Low Season (January, February, September)
- Revenue drops to average $1,973 per month
- Occupancy decreases to average 36.8%
- Daily rates adjust to average $163
Seasonality Insights for Katy
- The Airbnb seasonality in Katy shows moderate seasonality with distinct peak and low periods. While the sections above show seasonal averages, it's also insightful to look at the extremes:
- During the high season, the absolute peak month showcases Katy's highest earning potential, with monthly revenues capable of climbing to $2,856, occupancy reaching a high of 53.2%, and ADRs peaking at $177.
- Conversely, the slowest single month of the year, typically falling within the low season, marks the market's lowest point. In this month, revenue might dip to $1,692, occupancy could drop to 30.4%, and ADRs may adjust down to $148.
- Understanding both the seasonal averages and these monthly peaks and troughs in revenue, occupancy, and ADR is crucial for maximizing your Airbnb profit potential in Katy.
Seasonal Strategies for Maximizing Profit
- Peak Season: Maximize revenue through premium pricing and potentially longer minimum stays. Ensure high availability.
- Low Season: Offer competitive pricing, special promotions (e.g., extended stay discounts), and flexible cancellation policies. Target off-season travelers like remote workers or budget-conscious guests.
- Shoulder Seasons: Implement dynamic pricing that balances peak and low rates. Target weekend travelers or specific events. Offer slightly more flexible terms than peak season.
- Regularly analyze your own performance against these Katy seasonality benchmarks and adjust your pricing and availability strategy accordingly.
Best Areas for Airbnb Investment in Katy (2026)
Exploring the top neighborhoods for short-term rentals in Katy? This section highlights key areas, outlining why they are attractive for hosts and guests, along with notable local attractions. Consider these locations based on your target guest profile and investment strategy.
| Neighborhood / Area | Why Host Here? (Target Guests & Appeal) | Key Attractions & Landmarks |
|---|---|---|
| Katy Mills | A major shopping and entertainment destination with a variety of dining and shopping options, attracting families and tourists. | Katy Mills Mall, Typhoon Texas Waterpark, Cinco Ranch Lakehouse, Katy Contemporary Arts Museum, Katy Heritage Museum |
| Old Town Katy | A charming historic district with unique shops and local restaurants, perfect for tourists wanting a local experience. | Katy Historic District, Katy Railroad Museum, Katy Market Days, Caboose Park, Katy Festival |
| The Katy Freeway Corridor | Convenient location for business travelers and visitors needing access to major highways and corporate offices. | Access to I-10, Local Corporate offices, Dining and shopping along I-10, West Oaks Mall, Parks and outdoor spaces |
| Katy Prairie | An area known for its natural beauty and outdoor activities, attracting eco-tourists and nature lovers. | Katy Prairie Conservancy, Cullen Park, George Bush Park, Nature trails, Wildlife observation |
| Falcon Point | A residential area with great amenities, appealing to families and long-term travelers. | Falcon Point Golf Club, Parks and playgrounds, Nearby schools and community centers |
| Cinco Ranch | A master-planned community offering a suburban feel with excellent amenities and activities for all ages. | Cinco Ranch Golf Club, Parks and trails, Shopping centers, Dining options |
| Weston Lakes | A gated community with a luxury lifestyle, appealing to upscale travelers and those seeking peace and security. | Weston Lakes Golf Club, Community events, Private lake access, Nature trails |
| Fulshear | Nearby area with a growing number of attractions, appealing to those looking for a quieter stay near Katy. | Fulshear Town Square, Gilbert's Pizza, Fulshear Historical Museum, Parks and green spaces |
Understanding Airbnb License Requirements & STR Laws in Katy (2026)
While Katy, Texas, United States currently shows low STR regulations, specific Airbnb license requirements might still exist or change. Always verify the latest short term rental regulations and Airbnb license requirements directly with local government authorities for Katy to ensure full compliance before hosting.
(Source: AirROI data, 2026, based on 1% licensed listings)
Top Performing Airbnb Properties in Katy (2026)
Benchmark your potential! Explore examples of top-performing Airbnb properties in Katybased on Trailing Twelve Month (TTM) revenue. Analyze their characteristics, revenue, occupancy rate, and ADR to understand what drives success in this market.
Ultimate Sports Ranch (42 Comfortable Beds)
Entire Place • 7 bedrooms
Spacious 5 BR Large Groups | Katy Mall
Entire Place • 5 bedrooms

Art And Aquarium Home In Katy 6 Br
Entire Place • 6 bedrooms
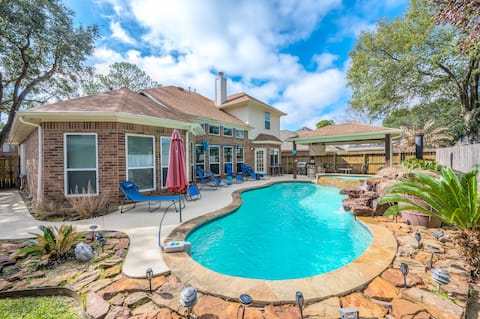
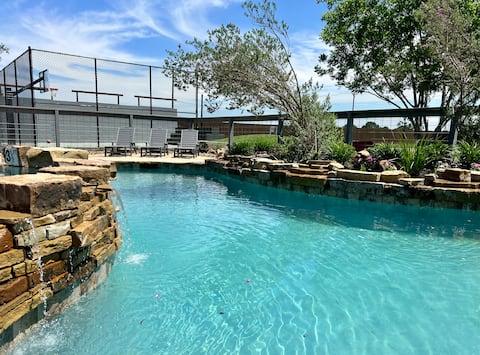
Fire Oasis: 5BR Pool Retreat in Katy
Entire Place • 5 bedrooms

Houston Huge Pool, miniGolf, Katy Asian Town, King
Entire Place • 4 bedrooms

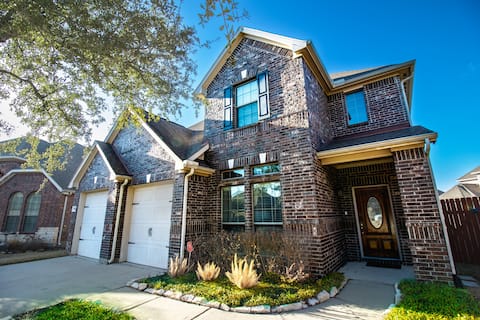
Katy Htd Pool Oasis with Pet-Friendly Yard
Entire Place • 4 bedrooms
Note: Performance varies based on location, size, amenities, seasonality, and management quality. Data reflects the past 12 months.
Top Performing Airbnb Hosts in Katy (2026)
Learn from the best! This table showcases top-performing Airbnb hosts in Katy based on the number of properties managed and estimated total revenue over the past year. Analyze their scale and performance metrics.
| Host Name | Properties | Grossing Revenue | Stay Reviews | Avg Rating |
|---|---|---|---|---|
| Jocelyn | 29 | $307,495 | 577 | 4.84/5.0 |
| Linda | 6 | $294,268 | 591 | 4.84/5.0 |
| Wade | 1 | $253,189 | 35 | 5.00/5.0 |
| Haven Point Rentals | 8 | $216,425 | 309 | 4.67/5.0 |
| Francisca | 5 | $150,852 | 115 | 4.91/5.0 |
| Khanh And Ha | 2 | $139,155 | 106 | 5.00/5.0 |
| Augusta | 3 | $128,389 | 252 | 4.95/5.0 |
| Linse | 3 | $114,952 | 466 | 4.90/5.0 |
| Alexander | 1 | $113,280 | 73 | 4.84/5.0 |
| David | 9 | $102,455 | 242 | 4.63/5.0 |
Analyzing the strategies of top hosts, such as their property selection, pricing, and guest communication, can offer valuable lessons for optimizing your own Airbnb operations in Katy.
Dive Deeper: Advanced Katy STR Market Data (2026)
Ready to unlock more insights? AirROI provides access to advanced metrics and comprehensive Airbnb data for Katy. Explore detailed analytics beyond this report to refine your investment strategy, optimize pricing, and maximize your vacation rental profits.
Explore Advanced MetricsKaty Short-Term Rental Market Composition (2026): Property & Room Types
Room Type Distribution
Property Type Distribution
Market Composition Insights for Katy
- The Katy Airbnb market composition is heavily skewed towards Entire Home/Apt listings, which make up 69.7% of the 386 active rentals. This indicates strong guest preference for privacy and space.
- However, a notable 28.8% share for Private Rooms suggests opportunities for budget-conscious travelers or hosts renting out spare rooms.
- Looking at the property type distribution in Katy, House properties are the most common (79.8%), reflecting the local real estate landscape.
- Houses represent a significant 79.8% portion, catering likely to families or larger groups.
- Smaller segments like hotel/boutique, others, outdoor/unique, unique stays (combined 6.5%) offer potential for unique stay experiences.
Katy Airbnb Room Capacity Analysis (2026): Bedroom Distribution
Distribution of Listings by Number of Bedrooms
Room Capacity Insights for Katy
- The dominant room capacity in Katy is 3 bedrooms listings, making up 22.3% of the market. This suggests a strong demand for properties suitable for families or small groups.
- Together, 3 bedrooms and 4 bedrooms properties represent 44.1% of the active Airbnb listings in Katy, indicating a high concentration in these sizes.
- A significant 49.8% of listings offer 3+ bedrooms, catering to larger groups and families seeking more space in Katy.
Katy Vacation Rental Guest Capacity Trends (2026)
Distribution of Listings by Guest Capacity
Guest Capacity Insights for Katy
- The most common guest capacity trend in Katy vacation rentals is listings accommodating 8+ guests (36.3%). This suggests the primary traveler segment is likely larger groups.
- Properties designed for 8+ guests and 4 guests dominate the Katy STR market, accounting for 49.0% of listings.
- 51.3% of properties accommodate 6+ guests, serving the market segment for larger families or group travel in Katy.
- On average, properties in Katy are equipped to host 4.6 guests.
Katy Airbnb Booking Patterns (2026): Available vs. Booked Days
Available Days Distribution
Booked Days Distribution
Booking Pattern Insights for Katy
- The most common availability pattern in Katy falls within the 271-366 days range, representing 52.3% of listings. This suggests many properties have significant open periods on their calendars.
- Approximately 84.4% of listings show high availability (181+ days open annually), indicating potential for increased bookings or specific owner usage patterns.
- For booked days, the 91-180 days range is most frequent in Katy (32.9%), reflecting common guest stay durations or potential owner blocking patterns.
- A notable 16.6% of properties secure long booking periods (181+ days booked per year), highlighting successful long-term rental strategies or significant owner usage.
Katy Airbnb Minimum Stay Requirements Analysis
Distribution of Listings by Minimum Night Requirement
1 Night
78 listings
20.2% of total
2 Nights
119 listings
30.8% of total
3 Nights
29 listings
7.5% of total
4-6 Nights
28 listings
7.3% of total
7-29 Nights
39 listings
10.1% of total
30+ Nights
93 listings
24.1% of total
Key Insights
- The most prevalent minimum stay requirement in Katy is 2 Nights, adopted by 30.8% of listings. This highlights the market's preference for shorter, flexible bookings.
- A significant segment (24.1%) caters to monthly stays (30+ nights) in Katy, pointing to opportunities in the extended-stay market.
Recommendations
- Align with the market by considering a 2 Nights minimum stay, as 30.8% of Katy hosts use this setting.
- If feasible, allowing 1-night stays, especially midweek or during low season, could capture last-minute bookings, as only 20.2% currently do.
- Explore offering discounts for stays of 30+ nights to attract the 24.1% of the market seeking extended stays.
- Adjust minimum nights based on seasonality – potentially shorter during low season and longer during peak demand periods in Katy.
Katy Airbnb Cancellation Policy Trends Analysis (2026)
Super Strict 30 Days
1 listings
0.3% of total
Limited
6 listings
1.6% of total
Super Strict 60 Days
1 listings
0.3% of total
Flexible
109 listings
28.3% of total
Moderate
122 listings
31.7% of total
Firm
97 listings
25.2% of total
Strict
49 listings
12.7% of total
Cancellation Policy Insights for Katy
- The prevailing Airbnb cancellation policy trend in Katy is Moderate, used by 31.7% of listings.
- There's a relatively balanced mix between guest-friendly (60.0%) and stricter (37.9%) policies, offering choices for different guest needs.
Recommendations for Hosts
- Consider adopting a Moderate policy to align with the 31.7% market standard in Katy.
- Using a Strict policy might deter some guests, as only 12.7% of listings use it. Evaluate if potential revenue protection outweighs possible lower booking rates.
- Regularly review your cancellation policy against competitors and market demand shifts in Katy.
Katy STR Booking Lead Time Analysis (2026)
Average Booking Lead Time by Month
Booking Lead Time Insights for Katy
- The overall average booking lead time for vacation rentals in Katy is 20 days.
- Guests book furthest in advance for stays during November (average 32 days), likely coinciding with peak travel demand or local events.
- The shortest booking windows occur for stays in February (average 14 days), indicating more last-minute travel plans during this time.
- Seasonally, Fall (24 days avg.) sees the longest lead times, while Summer (19 days avg.) has the shortest, reflecting typical travel planning cycles.
Recommendations for Hosts
- Use the overall average lead time (20 days) as a baseline for your pricing and availability strategy in Katy.
- For November stays, consider implementing length-of-stay discounts or slightly higher rates for bookings made less than 32 days out to capitalize on advance planning.
- Target marketing efforts for the Fall season well in advance (at least 24 days) to capture early planners.
- Monitor your own booking lead times against these Katy averages to identify opportunities for dynamic pricing adjustments.
Popular & Essential Airbnb Amenities in Katy (2026)
Amenity Prevalence
Amenity Insights for Katy
- Essential amenities in Katy that guests expect include: Air conditioning, Wifi, Smoke alarm, Free parking on premises, TV. Lacking these (any) could significantly impact bookings.
- Popular amenities like Washer, Heating, Hot water are common but not universal. Offering these can provide a competitive edge.
Recommendations for Hosts
- Ensure your listing includes all essential amenities for Katy: Air conditioning, Wifi, Smoke alarm, Free parking on premises, TV.
- Prioritize adding missing essentials: Wifi, Smoke alarm, Free parking on premises, TV.
- Consider adding popular differentiators like Washer or Heating to increase appeal.
- Highlight unique or less common amenities you offer (e.g., hot tub, dedicated workspace, EV charger) in your listing description and photos.
- Regularly check competitor amenities in Katy to stay competitive.
Katy Airbnb Guest Demographics & Profile Analysis (2026)
Guest Profile Summary for Katy
- The typical guest profile for Airbnb in Katy consists of primarily domestic travelers (92%), often arriving from nearby Houston, typically belonging to the Post-2000s (Gen Z/Alpha) group (50%), primarily speaking English or Spanish.
- Domestic travelers account for 92.0% of guests.
- Key international markets include United States (92%) and Mexico (1.6%).
- Top languages spoken are English (65.5%) followed by Spanish (19.4%).
- A significant demographic segment is the Post-2000s (Gen Z/Alpha) group, representing 50% of guests.
Recommendations for Hosts
- Target domestic marketing efforts towards travelers from Houston and Katy.
- Tailor amenities and listing descriptions to appeal to the dominant Post-2000s (Gen Z/Alpha) demographic (e.g., highlight fast WiFi, smart home features, local guides).
- Highlight unique local experiences or amenities relevant to the primary guest profile.
- Consider seasonal promotions aligned with peak travel times for key origin markets.
Nearby Short-Term Rental Market Comparison
How does the Katy Airbnb market stack up against its neighbors? Compare key performance metrics like average monthly revenue, ADR, and occupancy rates in surrounding areas to understand the broader regional STR landscape.
| Market | Active Properties | Monthly Revenue | Daily Rate | Avg. Occupancy |
|---|---|---|---|---|
| Fairfield | 10 | $4,761 | $360.96 | 42% |
| Midfield | 10 | $4,574 | $539.57 | 23% |
| Jamaica Beach | 199 | $3,774 | $394.20 | 37% |
| Crystal Beach | 143 | $3,768 | $408.48 | 35% |
| Bolivar Peninsula | 913 | $3,311 | $396.49 | 34% |
| Columbus | 17 | $3,218 | $413.88 | 29% |
| Deer Park | 14 | $3,208 | $228.63 | 51% |
| Schulenburg | 25 | $3,157 | $349.06 | 31% |
| Chappell Hill | 11 | $2,947 | $509.72 | 31% |
| Seabrook | 54 | $2,872 | $263.19 | 39% |