Houston Airbnb Market Analysis 2026: Short Term Rental Data & Vacation Rental Statistics in Texas, United States
Is Airbnb profitable in Houston in 2026? Explore comprehensive Airbnb analytics for Houston, Texas, United States to uncover income potential. This 2026 STR market report for Houston, based on AirROI data from February 2025 to January 2026, reveals key trends in the bustling market of 8,450 active listings.
Whether you're considering an Airbnb investment in Houston, optimizing your existing vacation rental, or exploring rental arbitrage opportunities, understanding the Houston Airbnb data is crucial. Understanding the local regulations is key to maximizing your short term rental income potential. Let's dive into the specifics.
Key Houston Airbnb Performance Metrics Overview
Monthly Airbnb Revenue Variations & Income Potential in Houston (2026)
Understanding the monthly revenue variations for Airbnb listings in Houston is key to maximizing your short term rental income potential. Seasonality significantly impacts earnings. Our analysis, based on data from the past 12 months, shows that the peak revenue month for STRs in Houston is typically March, while January often presents the lowest earnings, highlighting opportunities for strategic pricing adjustments during shoulder and low seasons. Explore the typical Airbnb income in Houston across different performance tiers:
- Best-in-class properties (Top 10%) achieve $5,283+ monthly, often utilizing dynamic pricing and superior guest experiences.
- Strong performing properties (Top 25%) earn $3,307 or more, indicating effective management and desirable locations/amenities.
- Typical properties (Median) generate around $1,885 per month, representing the average market performance.
- Entry-level properties (Bottom 25%) see earnings around $883, often with potential for optimization.
Average Monthly Airbnb Earnings Trend in Houston
Houston Airbnb Occupancy Rate Trends (2026)
Maximize your bookings by understanding the Houston STR occupancy trends. Seasonal demand shifts significantly influence how often properties are booked. Typically, Marchsees the highest demand (peak season occupancy), while January experiences the lowest (low season). Effective strategies, like adjusting minimum stays or offering promotions, can boost occupancy during slower periods. Here's how different property tiers perform in Houston:
- Best-in-class properties (Top 10%) achieve 79%+ occupancy, indicating high desirability and potentially optimized availability.
- Strong performing properties (Top 25%) maintain 63% or higher occupancy, suggesting good market fit and guest satisfaction.
- Typical properties (Median) have an occupancy rate around 41%.
- Entry-level properties (Bottom 25%) average 21% occupancy, potentially facing higher vacancy.
Average Monthly Occupancy Rate Trend in Houston
Average Daily Rate (ADR) Airbnb Trends in Houston (2026)
Effective short term rental pricing strategy in Houston involves understanding monthly ADR fluctuations. The Average Daily Rate (ADR) for Airbnb in Houston typically peaks in December and dips lowest during February. Leveraging Airbnb dynamic pricing tools or strategies based on this seasonality can significantly boost revenue. Here's a look at the typical nightly rates achieved:
- Best-in-class properties (Top 10%) command rates of $332+ per night, often due to premium features or locations.
- Strong performing properties (Top 25%) achieve nightly rates of $221 or more.
- Typical properties (Median) charge around $142 per night.
- Entry-level properties (Bottom 25%) earn around $93 per night.
Average Daily Rate (ADR) Trend by Month in Houston
Get Live Houston Market Intelligence 👇

Explore Real-time Analytics
Airbnb Seasonality Analysis & Trends in Houston (2026)
Peak Season (March, July, October)
- Revenue averages $2,840 per month
- Occupancy rates average 47.3%
- Daily rates average $184
Shoulder Season
- Revenue averages $2,548 per month
- Occupancy maintains around 41.6%
- Daily rates hold near $189
Low Season (January, February, April)
- Revenue drops to average $2,202 per month
- Occupancy decreases to average 41.5%
- Daily rates adjust to average $177
Seasonality Insights for Houston
- The Airbnb seasonality in Houston shows moderate seasonality with distinct peak and low periods. While the sections above show seasonal averages, it's also insightful to look at the extremes:
- During the high season, the absolute peak month showcases Houston's highest earning potential, with monthly revenues capable of climbing to $3,126, occupancy reaching a high of 55.4%, and ADRs peaking at $203.
- Conversely, the slowest single month of the year, typically falling within the low season, marks the market's lowest point. In this month, revenue might dip to $2,082, occupancy could drop to 33.6%, and ADRs may adjust down to $166.
- Understanding both the seasonal averages and these monthly peaks and troughs in revenue, occupancy, and ADR is crucial for maximizing your Airbnb profit potential in Houston.
Seasonal Strategies for Maximizing Profit
- Peak Season: Maximize revenue through premium pricing and potentially longer minimum stays. Ensure high availability.
- Low Season: Offer competitive pricing, special promotions (e.g., extended stay discounts), and flexible cancellation policies. Target off-season travelers like remote workers or budget-conscious guests.
- Shoulder Seasons: Implement dynamic pricing that balances peak and low rates. Target weekend travelers or specific events. Offer slightly more flexible terms than peak season.
- Regularly analyze your own performance against these Houston seasonality benchmarks and adjust your pricing and availability strategy accordingly.
Best Areas for Airbnb Investment in Houston (2026)
Exploring the top neighborhoods for short-term rentals in Houston? This section highlights key areas, outlining why they are attractive for hosts and guests, along with notable local attractions. Consider these locations based on your target guest profile and investment strategy.
| Neighborhood / Area | Why Host Here? (Target Guests & Appeal) | Key Attractions & Landmarks |
|---|---|---|
| Montrose | Eclectic neighborhood known for its diverse culture, vibrant arts scene, and historic homes. Popular among young professionals and artists, Montrose offers unique dining, shopping, and nightlife options. | Menil Collection, Buffalo Bayou Park, Montrose Farmers Market, The Contemporary Arts Museum, Czech Cultural Center Houston |
| The Heights | Charming neighborhood with a mix of historic homes and modern developments. The Heights is known for its parks, local shops, and dining options, making it attractive for families and young professionals. | Woodland Park, Heights Hike and Bike Trail, The Heights Theater, Local boutiques, Great dining options |
| Downtown | Houston's central business district with a variety of entertainment, dining, and cultural attractions. Ideal for business travelers and tourists wanting to be at the heart of the city's activity. | Discovery Green, Minute Maid Park, Theatre District, George R. Brown Convention Center, Various bars and restaurants |
| Galleria/Uptown | Upscale area known for its luxury shopping and dining. The Galleria is one of the largest malls in the U.S., attracting shoppers and tourists alike, making it a prime location for hosting. | The Galleria Mall, Uptown Park, Highland Village, Post Oak Boulevard, Various fine dining options |
| Midtown | A vibrant neighborhood that combines residential, retail, and nightlife, making it popular with young professionals and families. Midtown has a lively atmosphere and is close to downtown. | Midtown Park, Restaurants and bars along Bagby Street, Houston Dynamo games, Arts and entertainment venues |
| Museum District | Cultural hub of Houston, home to many museums and cultural institutions. This area attracts tourists and families, making it a great place for short-term rentals. | Houston Museum of Natural Science, The Houston Zoo, The Menil Collection, The Contemporary Arts Museum, Various art galleries |
| Rice Village | Trendy shopping and dining area adjacent to Rice University. It attracts students, young professionals, and families, making it a vibrant place for hosting Airbnb. | Rice Village Shopping Center, Unique boutiques, Restaurants and cafes, Proximity to Rice University, Parks and green spaces |
| Woodlands | Planned community known for its beautiful parks, upscale homes, and shopping areas. The Woodlands offers a suburban experience with access to urban amenities, appealing to families and travelers. | The Woodlands Mall, Waterway Square, George Mitchell Nature Preserve, Cynthia Woods Mitchell Pavilion, Various outdoor activities |
Understanding Airbnb License Requirements & STR Laws in Houston (2026)
With 27% of listings showing registration in 2026, understanding potential Airbnb license requirements is crucial in Houston. Always verify the latest short term rental regulations and Airbnb license requirements directly with local government authorities for Houston to ensure full compliance before hosting.
(Source: AirROI data, 2026, based on 27% licensed listings)
Top Performing Airbnb Properties in Houston (2026)
Benchmark your potential! Explore examples of top-performing Airbnb properties in Houstonbased on Trailing Twelve Month (TTM) revenue. Analyze their characteristics, revenue, occupancy rate, and ADR to understand what drives success in this market.
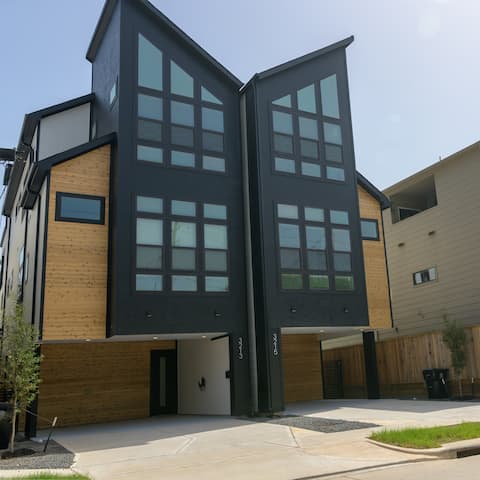
14BR/14BA Luxury Houston Homes with Skyline Views!
Entire Place • 14 bedrooms

2 homes side-by-side custom designed | sleeps 22
Entire Place • 7 bedrooms
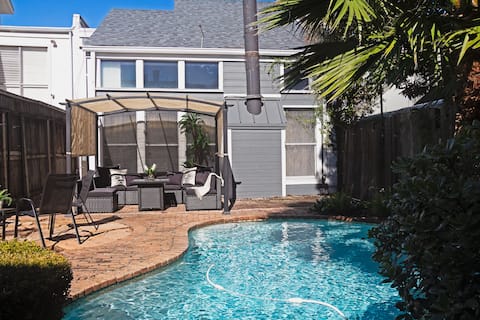
Your Montrose Dream | Sleeps 24/8BR/5BA/2PA
Entire Place • 8 bedrooms
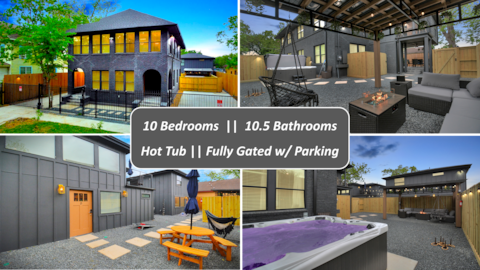
SpanishCowboys | HotTub | Fully Gated w/ Prkng
Entire Place • 10 bedrooms

Downtown 8 min • Sleeps 20 • Spa Lounge •Gated PKG
Entire Place • 6 bedrooms

Private 25 Acre Estate w/ Lake: Fish & Canoe!
Entire Place • 6 bedrooms
Note: Performance varies based on location, size, amenities, seasonality, and management quality. Data reflects the past 12 months.
Top Performing Airbnb Hosts in Houston (2026)
Learn from the best! This table showcases top-performing Airbnb hosts in Houston based on the number of properties managed and estimated total revenue over the past year. Analyze their scale and performance metrics.
| Host Name | Properties | Grossing Revenue | Stay Reviews | Avg Rating |
|---|---|---|---|---|
| Phillip | 238 | $6,553,737 | 12088 | 4.67/5.0 |
| Fernando And Armando | 51 | $2,525,195 | 3525 | 4.83/5.0 |
| Evolve | 83 | $1,816,757 | 1426 | 4.61/5.0 |
| Ehab | 58 | $1,583,833 | 1659 | 4.71/5.0 |
| Goldnest | 20 | $1,335,934 | 505 | 4.67/5.0 |
| Lodgeur | 85 | $1,187,520 | 1719 | 4.78/5.0 |
| Hple-N | 41 | $1,183,051 | 895 | 4.54/5.0 |
| Milliard | 20 | $1,000,389 | 1885 | 4.81/5.0 |
| Starlike Host | 9 | $958,082 | 187 | 4.90/5.0 |
| Jeffrey | 25 | $889,790 | 4540 | 4.82/5.0 |
Analyzing the strategies of top hosts, such as their property selection, pricing, and guest communication, can offer valuable lessons for optimizing your own Airbnb operations in Houston.
Dive Deeper: Advanced Houston STR Market Data (2026)
Ready to unlock more insights? AirROI provides access to advanced metrics and comprehensive Airbnb data for Houston. Explore detailed analytics beyond this report to refine your investment strategy, optimize pricing, and maximize your vacation rental profits.
Explore Advanced MetricsHouston Short-Term Rental Market Composition (2026): Property & Room Types
Room Type Distribution
Property Type Distribution
Market Composition Insights for Houston
- The Houston Airbnb market composition is heavily skewed towards Entire Home/Apt listings, which make up 85.1% of the 8,450 active rentals. This indicates strong guest preference for privacy and space.
- Looking at the property type distribution in Houston, House properties are the most common (57%), reflecting the local real estate landscape.
- Houses represent a significant 57% portion, catering likely to families or larger groups.
- Smaller segments like hotel/boutique, others, unique stays, outdoor/unique (combined 6.1%) offer potential for unique stay experiences.
Houston Airbnb Room Capacity Analysis (2026): Bedroom Distribution
Distribution of Listings by Number of Bedrooms
Room Capacity Insights for Houston
- The dominant room capacity in Houston is 1 bedroom listings, making up 28.7% of the market. This suggests a strong demand for properties suitable for couples or solo travelers.
- Together, 1 bedroom and 3 bedrooms properties represent 52.7% of the active Airbnb listings in Houston, indicating a high concentration in these sizes.
- A significant 37.0% of listings offer 3+ bedrooms, catering to larger groups and families seeking more space in Houston.
Houston Vacation Rental Guest Capacity Trends (2026)
Distribution of Listings by Guest Capacity
Guest Capacity Insights for Houston
- The most common guest capacity trend in Houston vacation rentals is listings accommodating 8+ guests (26.7%). This suggests the primary traveler segment is likely larger groups.
- Properties designed for 8+ guests and 4 guests dominate the Houston STR market, accounting for 42.9% of listings.
- 44.5% of properties accommodate 6+ guests, serving the market segment for larger families or group travel in Houston.
- On average, properties in Houston are equipped to host 4.6 guests.
Houston Airbnb Booking Patterns (2026): Available vs. Booked Days
Available Days Distribution
Booked Days Distribution
Booking Pattern Insights for Houston
- The most common availability pattern in Houston falls within the 271-366 days range, representing 49.1% of listings. This suggests many properties have significant open periods on their calendars.
- Approximately 81.3% of listings show high availability (181+ days open annually), indicating potential for increased bookings or specific owner usage patterns.
- For booked days, the 91-180 days range is most frequent in Houston (32.9%), reflecting common guest stay durations or potential owner blocking patterns.
- A notable 19.7% of properties secure long booking periods (181+ days booked per year), highlighting successful long-term rental strategies or significant owner usage.
Houston Airbnb Minimum Stay Requirements Analysis
Distribution of Listings by Minimum Night Requirement
1 Night
2256 listings
26.7% of total
2 Nights
2109 listings
25% of total
3 Nights
450 listings
5.3% of total
4-6 Nights
405 listings
4.8% of total
7-29 Nights
918 listings
10.9% of total
30+ Nights
2309 listings
27.3% of total
Key Insights
- The most prevalent minimum stay requirement in Houston is 30+ Nights, adopted by 27.3% of listings. This highlights the market's preference for longer commitments.
- A significant segment (27.3%) caters to monthly stays (30+ nights) in Houston, pointing to opportunities in the extended-stay market.
Recommendations
- Align with the market by considering a 30+ Nights minimum stay, as 27.3% of Houston hosts use this setting.
- If feasible, allowing 1-night stays, especially midweek or during low season, could capture last-minute bookings, as only 26.7% currently do.
- Explore offering discounts for stays of 30+ nights to attract the 27.3% of the market seeking extended stays.
- Adjust minimum nights based on seasonality – potentially shorter during low season and longer during peak demand periods in Houston.
Houston Airbnb Cancellation Policy Trends Analysis (2026)
Super Strict 60 Days
74 listings
0.9% of total
Limited
237 listings
2.8% of total
Super Strict 30 Days
75 listings
0.9% of total
Flexible
1783 listings
21.2% of total
Moderate
2131 listings
25.4% of total
Firm
2459 listings
29.3% of total
Strict
1642 listings
19.5% of total
Cancellation Policy Insights for Houston
- The prevailing Airbnb cancellation policy trend in Houston is Firm, used by 29.3% of listings.
- There's a relatively balanced mix between guest-friendly (46.6%) and stricter (48.8%) policies, offering choices for different guest needs.
Recommendations for Hosts
- Consider adopting a Firm policy to align with the 29.3% market standard in Houston.
- Regularly review your cancellation policy against competitors and market demand shifts in Houston.
Houston STR Booking Lead Time Analysis (2026)
Average Booking Lead Time by Month
Booking Lead Time Insights for Houston
- The overall average booking lead time for vacation rentals in Houston is 25 days.
- Guests book furthest in advance for stays during June (average 33 days), likely coinciding with peak travel demand or local events.
- The shortest booking windows occur for stays in February (average 23 days), indicating more last-minute travel plans during this time.
- Seasonally, Spring (28 days avg.) sees the longest lead times, while Winter (24 days avg.) has the shortest, reflecting typical travel planning cycles.
Recommendations for Hosts
- Use the overall average lead time (25 days) as a baseline for your pricing and availability strategy in Houston.
- Target marketing efforts for the Spring season well in advance (at least 28 days) to capture early planners.
- Monitor your own booking lead times against these Houston averages to identify opportunities for dynamic pricing adjustments.
Popular & Essential Airbnb Amenities in Houston (2026)
Amenity Prevalence
Amenity Insights for Houston
- Essential amenities in Houston that guests expect include: Air conditioning, Wifi, Smoke alarm, TV. Lacking these (any) could significantly impact bookings.
- Popular amenities like Kitchen, Heating, Free parking on premises are common but not universal. Offering these can provide a competitive edge.
Recommendations for Hosts
- Ensure your listing includes all essential amenities for Houston: Air conditioning, Wifi, Smoke alarm, TV.
- Prioritize adding missing essentials: Air conditioning, Wifi, Smoke alarm, TV.
- Consider adding popular differentiators like Kitchen or Heating to increase appeal.
- Highlight unique or less common amenities you offer (e.g., hot tub, dedicated workspace, EV charger) in your listing description and photos.
- Regularly check competitor amenities in Houston to stay competitive.
Houston Airbnb Guest Demographics & Profile Analysis (2026)
Guest Profile Summary for Houston
- The typical guest profile for Airbnb in Houston consists of primarily domestic travelers (90%), often arriving from nearby Houston, typically belonging to the Post-2000s (Gen Z/Alpha) group (50%), primarily speaking English or Spanish.
- Domestic travelers account for 90.3% of guests.
- Key international markets include United States (90.3%) and Mexico (1.7%).
- Top languages spoken are English (65.8%) followed by Spanish (18.9%).
- A significant demographic segment is the Post-2000s (Gen Z/Alpha) group, representing 50% of guests.
Recommendations for Hosts
- Target domestic marketing efforts towards travelers from Houston and Austin.
- Tailor amenities and listing descriptions to appeal to the dominant Post-2000s (Gen Z/Alpha) demographic (e.g., highlight fast WiFi, smart home features, local guides).
- Highlight unique local experiences or amenities relevant to the primary guest profile.
- Consider seasonal promotions aligned with peak travel times for key origin markets.
Nearby Short-Term Rental Market Comparison
How does the Houston Airbnb market stack up against its neighbors? Compare key performance metrics like average monthly revenue, ADR, and occupancy rates in surrounding areas to understand the broader regional STR landscape.
| Market | Active Properties | Monthly Revenue | Daily Rate | Avg. Occupancy |
|---|---|---|---|---|
| Fairfield | 10 | $4,761 | $360.96 | 42% |
| Midfield | 10 | $4,574 | $539.57 | 23% |
| Jamaica Beach | 199 | $3,774 | $394.20 | 37% |
| Crystal Beach | 143 | $3,768 | $408.48 | 35% |
| Bolivar Peninsula | 913 | $3,311 | $396.49 | 34% |
| Columbus | 17 | $3,218 | $413.88 | 29% |
| Deer Park | 14 | $3,208 | $228.63 | 51% |
| Schulenburg | 25 | $3,157 | $349.06 | 31% |
| Chappell Hill | 11 | $2,947 | $509.72 | 31% |
| Seabrook | 54 | $2,872 | $263.19 | 39% |