Hornsby Bend Airbnb Market Analysis 2026: Short Term Rental Data & Vacation Rental Statistics in Texas, United States
Is Airbnb profitable in Hornsby Bend in 2026? Explore comprehensive Airbnb analytics for Hornsby Bend, Texas, United States to uncover income potential. This 2026 STR market report for Hornsby Bend, based on AirROI data from February 2025 to January 2026, reveals key trends in the niche market of 49 active listings.
Whether you're considering an Airbnb investment in Hornsby Bend, optimizing your existing vacation rental, or exploring rental arbitrage opportunities, understanding the Hornsby Bend Airbnb data is crucial. Leveraging the low regulation environment is key to maximizing your short term rental income potential. Let's dive into the specifics.
Key Hornsby Bend Airbnb Performance Metrics Overview
Monthly Airbnb Revenue Variations & Income Potential in Hornsby Bend (2026)
Understanding the monthly revenue variations for Airbnb listings in Hornsby Bend is key to maximizing your short term rental income potential. Seasonality significantly impacts earnings. Our analysis, based on data from the past 12 months, shows that the peak revenue month for STRs in Hornsby Bend is typically March, while January often presents the lowest earnings, highlighting opportunities for strategic pricing adjustments during shoulder and low seasons. Explore the typical Airbnb income in Hornsby Bend across different performance tiers:
- Best-in-class properties (Top 10%) achieve $5,456+ monthly, often utilizing dynamic pricing and superior guest experiences.
- Strong performing properties (Top 25%) earn $3,474 or more, indicating effective management and desirable locations/amenities.
- Typical properties (Median) generate around $1,570 per month, representing the average market performance.
- Entry-level properties (Bottom 25%) see earnings around $638, often with potential for optimization.
Average Monthly Airbnb Earnings Trend in Hornsby Bend
Hornsby Bend Airbnb Occupancy Rate Trends (2026)
Maximize your bookings by understanding the Hornsby Bend STR occupancy trends. Seasonal demand shifts significantly influence how often properties are booked. Typically, Marchsees the highest demand (peak season occupancy), while January experiences the lowest (low season). Effective strategies, like adjusting minimum stays or offering promotions, can boost occupancy during slower periods. Here's how different property tiers perform in Hornsby Bend:
- Best-in-class properties (Top 10%) achieve 80%+ occupancy, indicating high desirability and potentially optimized availability.
- Strong performing properties (Top 25%) maintain 62% or higher occupancy, suggesting good market fit and guest satisfaction.
- Typical properties (Median) have an occupancy rate around 40%.
- Entry-level properties (Bottom 25%) average 18% occupancy, potentially facing higher vacancy.
Average Monthly Occupancy Rate Trend in Hornsby Bend
Average Daily Rate (ADR) Airbnb Trends in Hornsby Bend (2026)
Effective short term rental pricing strategy in Hornsby Bend involves understanding monthly ADR fluctuations. The Average Daily Rate (ADR) for Airbnb in Hornsby Bend typically peaks in October and dips lowest during February. Leveraging Airbnb dynamic pricing tools or strategies based on this seasonality can significantly boost revenue. Here's a look at the typical nightly rates achieved:
- Best-in-class properties (Top 10%) command rates of $319+ per night, often due to premium features or locations.
- Strong performing properties (Top 25%) achieve nightly rates of $230 or more.
- Typical properties (Median) charge around $141 per night.
- Entry-level properties (Bottom 25%) earn around $52 per night.
Average Daily Rate (ADR) Trend by Month in Hornsby Bend
Get Live Hornsby Bend Market Intelligence 👇

Explore Real-time Analytics
Airbnb Seasonality Analysis & Trends in Hornsby Bend (2026)
Peak Season (March, August, February)
- Revenue averages $3,048 per month
- Occupancy rates average 47.3%
- Daily rates average $282
Shoulder Season
- Revenue averages $2,509 per month
- Occupancy maintains around 42.3%
- Daily rates hold near $311
Low Season (January, May, July)
- Revenue drops to average $1,755 per month
- Occupancy decreases to average 35.3%
- Daily rates adjust to average $294
Seasonality Insights for Hornsby Bend
- The Airbnb seasonality in Hornsby Bend shows highly seasonal trends requiring careful strategy. While the sections above show seasonal averages, it's also insightful to look at the extremes:
- During the high season, the absolute peak month showcases Hornsby Bend's highest earning potential, with monthly revenues capable of climbing to $3,221, occupancy reaching a high of 52.0%, and ADRs peaking at $342.
- Conversely, the slowest single month of the year, typically falling within the low season, marks the market's lowest point. In this month, revenue might dip to $1,415, occupancy could drop to 33.9%, and ADRs may adjust down to $270.
- Understanding both the seasonal averages and these monthly peaks and troughs in revenue, occupancy, and ADR is crucial for maximizing your Airbnb profit potential in Hornsby Bend.
Seasonal Strategies for Maximizing Profit
- Peak Season: Maximize revenue through premium pricing and potentially longer minimum stays. Ensure high availability.
- Low Season: Offer competitive pricing, special promotions (e.g., extended stay discounts), and flexible cancellation policies. Target off-season travelers like remote workers or budget-conscious guests.
- Shoulder Seasons: Implement dynamic pricing that balances peak and low rates. Target weekend travelers or specific events. Offer slightly more flexible terms than peak season.
- Regularly analyze your own performance against these Hornsby Bend seasonality benchmarks and adjust your pricing and availability strategy accordingly.
Best Areas for Airbnb Investment in Hornsby Bend (2026)
Exploring the top neighborhoods for short-term rentals in Hornsby Bend? This section highlights key areas, outlining why they are attractive for hosts and guests, along with notable local attractions. Consider these locations based on your target guest profile and investment strategy.
| Neighborhood / Area | Why Host Here? (Target Guests & Appeal) | Key Attractions & Landmarks |
|---|---|---|
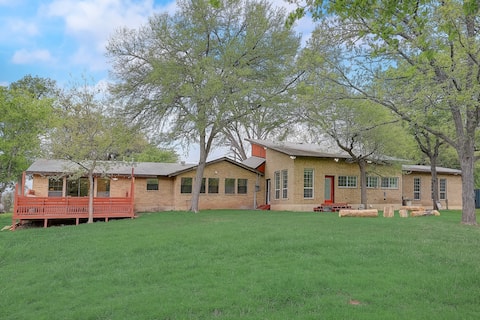
| Hornsby Bend | A quiet, rural area of Austin that offers a peaceful escape while still being close to the city. Great for travelers looking for a nature-oriented experience with opportunities for outdoor activities. | Colorado River, McKinney Falls State Park, Lady Bird Lake, Austin's Greenbelt, Hornsby Bend Bird Observatory |
| Downtown Austin | Austin's bustling urban center known for its live music, vibrant nightlife, and cultural attractions. Ideal for travelers wanting to experience the city's unique energy and entertainment options firsthand. | Texas State Capitol, 6th Street, South Congress Avenue, Lady Bird Lake Hike and Bike Trail, Austin Convention Center |
| South Congress (SoCo) | Famous for its quirky shops, food trucks, and live music venues, SoCo embodies the artistic spirit of Austin making it a popular destination for visitors seeking culture and fun. | SoCo shopping district, Jo's Coffee, The Continental Club, Austin Motel, South Congress Bridge |
| East Austin | A vibrant and diverse area known for its art scene, excellent eateries, and local breweries. Attracts visitors looking for a more authentic Austin experience with a trendy edge. | East Austin Studio Tour, Street art murals, Local breweries, Barbecue joints, Food trucks |
| West Lake Hills | A beautiful suburban area with stunning views of Lake Austin and close proximity to outdoor recreation areas. Popular among families looking for a tranquil retreat. | Zilker Park, Mount Bonnell, Tom Miller Dam, Lake Austin, Westlake Hills shops |
| North Loop | A hip neighborhood known for its vintage shops, music venues, and eclectic dining options. Attracts a younger crowd interested in Austin's local culture. | The Lost Well, Metal & Thread, Highball, Violet Crown Cinema, Local food trucks |
| The Domain | A modern shopping district that combines retail, dining, and entertainment with upscale apartments. Ideal for travelers wanting the convenience of urban living with a suburban feel. | The Domain shopping center, Topgolf, Alamo Drafthouse, The Arboretum, Whole Foods Market |
| Barton Creek | Known for its luxurious homes and natural beauty, Barton Creek offers a serene environment close to Austin's top attractions. Appeals to travelers seeking relaxation and beauty. | Barton Springs Pool, Zilker Botanical Garden, Barton Creek Greenbelt, Barton Creek Square, Golf courses |
Understanding Airbnb License Requirements & STR Laws in Hornsby Bend (2026)
While Hornsby Bend, Texas, United States currently shows low STR regulations, specific Airbnb license requirements might still exist or change. Always verify the latest short term rental regulations and Airbnb license requirements directly with local government authorities for Hornsby Bend to ensure full compliance before hosting.
(Source: AirROI data, 2026, finding no licensed listings among those analyzed)
Top Performing Airbnb Properties in Hornsby Bend (2026)
Benchmark your potential! Explore examples of top-performing Airbnb properties in Hornsby Bendbased on Trailing Twelve Month (TTM) revenue. Analyze their characteristics, revenue, occupancy rate, and ADR to understand what drives success in this market.
Scenic 5BR Ranch on 3 Acres w/Cinema – Near Austin
Entire Place • 5 bedrooms

@ Marbella Lane - 3BR Pristine Home in Austin TX
Entire Place • 3 bedrooms
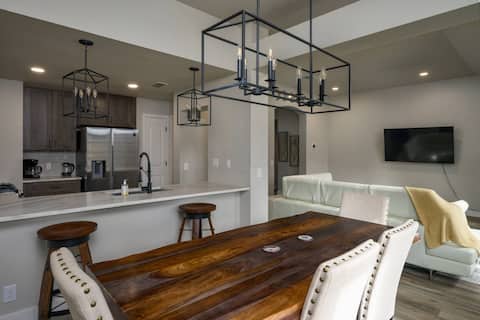
Gourmet Kitchen, Large Dining Table, Quiet Area
Entire Place • 3 bedrooms
Save money here! Value Housing near Tesla!
Entire Place • 6 bedrooms

@ Marbella Lane - Amazing 4BR Lakeview Home
Entire Place • 4 bedrooms
Perfect Retreat: Central Location w/ Serene Vibes.
Entire Place • 3 bedrooms
Note: Performance varies based on location, size, amenities, seasonality, and management quality. Data reflects the past 12 months.
Top Performing Airbnb Hosts in Hornsby Bend (2026)
Learn from the best! This table showcases top-performing Airbnb hosts in Hornsby Bend based on the number of properties managed and estimated total revenue over the past year. Analyze their scale and performance metrics.
| Host Name | Properties | Grossing Revenue | Stay Reviews | Avg Rating |
|---|---|---|---|---|
| Bleuvets Dunlap | 1 | $109,411 | 32 | 5.00/5.0 |
| Vacay | 5 | $64,624 | 38 | 4.98/5.0 |
| Marbella | 1 | $57,541 | 13 | 4.77/5.0 |
| ITrip Austin | 1 | $52,056 | 16 | 4.75/5.0 |
| Alwin | 1 | $46,452 | 21 | 4.57/5.0 |
| Stella | 1 | $46,148 | 35 | 4.71/5.0 |
| Monica | 1 | $38,269 | 52 | 4.88/5.0 |
| Luis | 1 | $35,581 | 56 | 4.96/5.0 |
| Bob | 2 | $35,276 | 17 | 4.61/5.0 |
| One Fine BnB | 2 | $32,036 | 78 | 4.59/5.0 |
Analyzing the strategies of top hosts, such as their property selection, pricing, and guest communication, can offer valuable lessons for optimizing your own Airbnb operations in Hornsby Bend.
Dive Deeper: Advanced Hornsby Bend STR Market Data (2026)
Ready to unlock more insights? AirROI provides access to advanced metrics and comprehensive Airbnb data for Hornsby Bend. Explore detailed analytics beyond this report to refine your investment strategy, optimize pricing, and maximize your vacation rental profits.
Explore Advanced MetricsHornsby Bend Short-Term Rental Market Composition (2026): Property & Room Types
Room Type Distribution
Property Type Distribution
Market Composition Insights for Hornsby Bend
- The Hornsby Bend Airbnb market composition is heavily skewed towards Entire Home/Apt listings, which make up 63.3% of the 49 active rentals. This indicates strong guest preference for privacy and space.
- However, a notable 36.7% share for Private Rooms suggests opportunities for budget-conscious travelers or hosts renting out spare rooms.
- Looking at the property type distribution in Hornsby Bend, House properties are the most common (100%), reflecting the local real estate landscape.
- Houses represent a significant 100% portion, catering likely to families or larger groups.
Hornsby Bend Airbnb Room Capacity Analysis (2026): Bedroom Distribution
Distribution of Listings by Number of Bedrooms
Room Capacity Insights for Hornsby Bend
- The dominant room capacity in Hornsby Bend is 3 bedrooms listings, making up 28.6% of the market. This suggests a strong demand for properties suitable for families or small groups.
- Together, 3 bedrooms and 4 bedrooms properties represent 51.0% of the active Airbnb listings in Hornsby Bend, indicating a high concentration in these sizes.
- A significant 57.1% of listings offer 3+ bedrooms, catering to larger groups and families seeking more space in Hornsby Bend.
Hornsby Bend Vacation Rental Guest Capacity Trends (2026)
Distribution of Listings by Guest Capacity
Guest Capacity Insights for Hornsby Bend
- The most common guest capacity trend in Hornsby Bend vacation rentals is listings accommodating 8+ guests (28.6%). This suggests the primary traveler segment is likely larger groups.
- Properties designed for 8+ guests and 6 guests dominate the Hornsby Bend STR market, accounting for 49.0% of listings.
- 51.0% of properties accommodate 6+ guests, serving the market segment for larger families or group travel in Hornsby Bend.
- On average, properties in Hornsby Bend are equipped to host 4.2 guests.
Hornsby Bend Airbnb Booking Patterns (2026): Available vs. Booked Days
Available Days Distribution
Booked Days Distribution
Booking Pattern Insights for Hornsby Bend
- The most common availability pattern in Hornsby Bend falls within the 271-366 days range, representing 57.1% of listings. This suggests many properties have significant open periods on their calendars.
- Approximately 87.7% of listings show high availability (181+ days open annually), indicating potential for increased bookings or specific owner usage patterns.
- For booked days, the 1-30 days range is most frequent in Hornsby Bend (34.7%), reflecting common guest stay durations or potential owner blocking patterns.
- A notable 12.2% of properties secure long booking periods (181+ days booked per year), highlighting successful long-term rental strategies or significant owner usage.
Hornsby Bend Airbnb Minimum Stay Requirements Analysis
Distribution of Listings by Minimum Night Requirement
1 Night
5 listings
10.2% of total
2 Nights
10 listings
20.4% of total
3 Nights
2 listings
4.1% of total
4-6 Nights
6 listings
12.2% of total
7-29 Nights
11 listings
22.4% of total
30+ Nights
15 listings
30.6% of total
Key Insights
- The most prevalent minimum stay requirement in Hornsby Bend is 30+ Nights, adopted by 30.6% of listings. This highlights the market's preference for longer commitments.
- A significant segment (30.6%) caters to monthly stays (30+ nights) in Hornsby Bend, pointing to opportunities in the extended-stay market.
Recommendations
- Align with the market by considering a 30+ Nights minimum stay, as 30.6% of Hornsby Bend hosts use this setting.
- If feasible, allowing 1-night stays, especially midweek or during low season, could capture last-minute bookings, as only 10.2% currently do.
- Explore offering discounts for stays of 30+ nights to attract the 30.6% of the market seeking extended stays.
- Adjust minimum nights based on seasonality – potentially shorter during low season and longer during peak demand periods in Hornsby Bend.
Hornsby Bend Airbnb Cancellation Policy Trends Analysis (2026)
Super Strict 60 Days
2 listings
4.1% of total
Limited
2 listings
4.1% of total
Flexible
17 listings
34.7% of total
Moderate
6 listings
12.2% of total
Firm
18 listings
36.7% of total
Strict
4 listings
8.2% of total
Cancellation Policy Insights for Hornsby Bend
- The prevailing Airbnb cancellation policy trend in Hornsby Bend is Firm, used by 36.7% of listings.
- There's a relatively balanced mix between guest-friendly (46.9%) and stricter (44.9%) policies, offering choices for different guest needs.
- Strict cancellation policies are quite rare (8.2%), potentially making listings with this policy less competitive unless justified by high demand or property type.
Recommendations for Hosts
- Consider adopting a Firm policy to align with the 36.7% market standard in Hornsby Bend.
- Using a Strict policy might deter some guests, as only 8.2% of listings use it. Evaluate if potential revenue protection outweighs possible lower booking rates.
- Regularly review your cancellation policy against competitors and market demand shifts in Hornsby Bend.
Hornsby Bend STR Booking Lead Time Analysis (2026)
Average Booking Lead Time by Month
Booking Lead Time Insights for Hornsby Bend
- The overall average booking lead time for vacation rentals in Hornsby Bend is 19 days.
- Guests book furthest in advance for stays during October (average 70 days), likely coinciding with peak travel demand or local events.
- The shortest booking windows occur for stays in July (average 10 days), indicating more last-minute travel plans during this time.
- Seasonally, Fall (37 days avg.) sees the longest lead times, while Spring (19 days avg.) has the shortest, reflecting typical travel planning cycles.
Recommendations for Hosts
- Use the overall average lead time (19 days) as a baseline for your pricing and availability strategy in Hornsby Bend.
- For October stays, consider implementing length-of-stay discounts or slightly higher rates for bookings made less than 70 days out to capitalize on advance planning.
- During July, focus on last-minute booking availability and promotions, as guests book with very short notice (10 days avg.).
- Target marketing efforts for the Fall season well in advance (at least 37 days) to capture early planners.
- Monitor your own booking lead times against these Hornsby Bend averages to identify opportunities for dynamic pricing adjustments.
Popular & Essential Airbnb Amenities in Hornsby Bend (2026)
Amenity Prevalence
Amenity Insights for Hornsby Bend
- Essential amenities in Hornsby Bend that guests expect include: Wifi, Air conditioning. Lacking these (any) could significantly impact bookings.
- Popular amenities like Smoke alarm, TV, Free parking on premises are common but not universal. Offering these can provide a competitive edge.
Recommendations for Hosts
- Ensure your listing includes all essential amenities for Hornsby Bend: Wifi, Air conditioning.
- Prioritize adding missing essentials: Wifi, Air conditioning.
- Consider adding popular differentiators like Smoke alarm or TV to increase appeal.
- Highlight unique or less common amenities you offer (e.g., hot tub, dedicated workspace, EV charger) in your listing description and photos.
- Regularly check competitor amenities in Hornsby Bend to stay competitive.
Hornsby Bend Airbnb Guest Demographics & Profile Analysis (2026)
Guest Profile Summary for Hornsby Bend
- The typical guest profile for Airbnb in Hornsby Bend consists of primarily domestic travelers (86%), often arriving from nearby Austin, typically belonging to the Post-2000s (Gen Z/Alpha) group (50%), primarily speaking English or Spanish.
- Domestic travelers account for 85.6% of guests.
- Key international markets include United States (85.6%) and Mexico (7.6%).
- Top languages spoken are English (63.5%) followed by Spanish (22.9%).
- A significant demographic segment is the Post-2000s (Gen Z/Alpha) group, representing 50% of guests.
Recommendations for Hosts
- Target domestic marketing efforts towards travelers from Austin and Houston.
- Tailor amenities and listing descriptions to appeal to the dominant Post-2000s (Gen Z/Alpha) demographic (e.g., highlight fast WiFi, smart home features, local guides).
- Highlight unique local experiences or amenities relevant to the primary guest profile.
- Consider seasonal promotions aligned with peak travel times for key origin markets.
Nearby Short-Term Rental Market Comparison
How does the Hornsby Bend Airbnb market stack up against its neighbors? Compare key performance metrics like average monthly revenue, ADR, and occupancy rates in surrounding areas to understand the broader regional STR landscape.
| Market | Active Properties | Monthly Revenue | Daily Rate | Avg. Occupancy |
|---|---|---|---|---|
| Hudson Bend | 59 | $5,436 | $611.45 | 31% |
| Jonestown | 60 | $5,240 | $513.31 | 32% |
| Gillespie County | 11 | $4,887 | $351.24 | 59% |
| West Lake Hills | 21 | $4,391 | $656.35 | 34% |
| Helotes | 48 | $4,095 | $322.31 | 42% |
| Kingsland | 255 | $4,055 | $564.92 | 27% |
| Cottonwood Shores | 26 | $4,012 | $408.66 | 35% |
| Round Mountain | 17 | $3,781 | $385.24 | 42% |
| Volente | 19 | $3,627 | $462.89 | 30% |
| Dripping Springs | 403 | $3,493 | $389.50 | 32% |