Hondo Airbnb Market Analysis 2026: Short Term Rental Data & Vacation Rental Statistics in Texas, United States
Is Airbnb profitable in Hondo in 2026? Explore comprehensive Airbnb analytics for Hondo, Texas, United States to uncover income potential. This 2026 STR market report for Hondo, based on AirROI data from February 2025 to January 2026, reveals key trends in the niche market of 22 active listings.
Whether you're considering an Airbnb investment in Hondo, optimizing your existing vacation rental, or exploring rental arbitrage opportunities, understanding the Hondo Airbnb data is crucial. Leveraging the low regulation environment is key to maximizing your short term rental income potential. Let's dive into the specifics.
Key Hondo Airbnb Performance Metrics Overview
Monthly Airbnb Revenue Variations & Income Potential in Hondo (2026)
Understanding the monthly revenue variations for Airbnb listings in Hondo is key to maximizing your short term rental income potential. Seasonality significantly impacts earnings. Our analysis, based on data from the past 12 months, shows that the peak revenue month for STRs in Hondo is typically September, while January often presents the lowest earnings, highlighting opportunities for strategic pricing adjustments during shoulder and low seasons. Explore the typical Airbnb income in Hondo across different performance tiers:
- Best-in-class properties (Top 10%) achieve $3,094+ monthly, often utilizing dynamic pricing and superior guest experiences.
- Strong performing properties (Top 25%) earn $2,394 or more, indicating effective management and desirable locations/amenities.
- Typical properties (Median) generate around $1,583 per month, representing the average market performance.
- Entry-level properties (Bottom 25%) see earnings around $981, often with potential for optimization.
Average Monthly Airbnb Earnings Trend in Hondo
Hondo Airbnb Occupancy Rate Trends (2026)
Maximize your bookings by understanding the Hondo STR occupancy trends. Seasonal demand shifts significantly influence how often properties are booked. Typically, Septembersees the highest demand (peak season occupancy), while January experiences the lowest (low season). Effective strategies, like adjusting minimum stays or offering promotions, can boost occupancy during slower periods. Here's how different property tiers perform in Hondo:
- Best-in-class properties (Top 10%) achieve 55%+ occupancy, indicating high desirability and potentially optimized availability.
- Strong performing properties (Top 25%) maintain 43% or higher occupancy, suggesting good market fit and guest satisfaction.
- Typical properties (Median) have an occupancy rate around 27%.
- Entry-level properties (Bottom 25%) average 20% occupancy, potentially facing higher vacancy.
Average Monthly Occupancy Rate Trend in Hondo
Average Daily Rate (ADR) Airbnb Trends in Hondo (2026)
Effective short term rental pricing strategy in Hondo involves understanding monthly ADR fluctuations. The Average Daily Rate (ADR) for Airbnb in Hondo typically peaks in October and dips lowest during February. Leveraging Airbnb dynamic pricing tools or strategies based on this seasonality can significantly boost revenue. Here's a look at the typical nightly rates achieved:
- Best-in-class properties (Top 10%) command rates of $745+ per night, often due to premium features or locations.
- Strong performing properties (Top 25%) achieve nightly rates of $227 or more.
- Typical properties (Median) charge around $187 per night.
- Entry-level properties (Bottom 25%) earn around $142 per night.
Average Daily Rate (ADR) Trend by Month in Hondo
Get Live Hondo Market Intelligence 👇

Explore Real-time Analytics
Airbnb Seasonality Analysis & Trends in Hondo (2026)
Peak Season (September, December, May)
- Revenue averages $2,241 per month
- Occupancy rates average 35.7%
- Daily rates average $369
Shoulder Season
- Revenue averages $1,858 per month
- Occupancy maintains around 33.0%
- Daily rates hold near $365
Low Season (January, February, June)
- Revenue drops to average $1,314 per month
- Occupancy decreases to average 26.4%
- Daily rates adjust to average $344
Seasonality Insights for Hondo
- The Airbnb seasonality in Hondo shows moderate seasonality with distinct peak and low periods. While the sections above show seasonal averages, it's also insightful to look at the extremes:
- During the high season, the absolute peak month showcases Hondo's highest earning potential, with monthly revenues capable of climbing to $2,354, occupancy reaching a high of 40.5%, and ADRs peaking at $411.
- Conversely, the slowest single month of the year, typically falling within the low season, marks the market's lowest point. In this month, revenue might dip to $1,099, occupancy could drop to 21.0%, and ADRs may adjust down to $300.
- Understanding both the seasonal averages and these monthly peaks and troughs in revenue, occupancy, and ADR is crucial for maximizing your Airbnb profit potential in Hondo.
Seasonal Strategies for Maximizing Profit
- Peak Season: Maximize revenue through premium pricing and potentially longer minimum stays. Ensure high availability.
- Low Season: Offer competitive pricing, special promotions (e.g., extended stay discounts), and flexible cancellation policies. Target off-season travelers like remote workers or budget-conscious guests.
- Shoulder Seasons: Implement dynamic pricing that balances peak and low rates. Target weekend travelers or specific events. Offer slightly more flexible terms than peak season.
- Regularly analyze your own performance against these Hondo seasonality benchmarks and adjust your pricing and availability strategy accordingly.
Best Areas for Airbnb Investment in Hondo (2026)
Exploring the top neighborhoods for short-term rentals in Hondo? This section highlights key areas, outlining why they are attractive for hosts and guests, along with notable local attractions. Consider these locations based on your target guest profile and investment strategy.
| Neighborhood / Area | Why Host Here? (Target Guests & Appeal) | Key Attractions & Landmarks |
|---|---|---|
| Downtown Hondo | The heart of Hondo, featuring local shops, restaurants, and community events. An emerging area for travelers wanting to experience local culture and hospitality. | Hondo City Park, Hondo Historical Museum, Local dining options, Community events, Shopping district |
| Hondo Lake Park | A scenic area offering recreational opportunities like fishing, boating, and picnicking. Ideal for families and outdoor enthusiasts looking for a getaway. | Hondo Lake, Fishing and boating, Picnic areas, Nature trails, Wildlife viewing |
| Bandera Street | A vibrant street known for its antique shops and local markets, perfect for tourists looking for unique finds and an authentic Texan experience. | Antique shops, Local markets, Cafes, Art galleries, Community events |
| Hondo ISD Football Stadium | A popular venue for local sports events, attracting families and sports enthusiasts. A good spot for travelers visiting during school events or games. | High school football games, Community sports events |
| Civic Center | The hub for local gatherings, cultural events, and community services. A central location for tourists wanting to engage with the local community. | Local events and festivals, Art showcases, Community meetings |
| Nearby Garner State Park | A natural retreat offering stunning views and outdoor activities. Perfect for visitors who love hiking, camping, and enjoying nature. | Hiking trails, Swimming areas, Camping facilities, Picnic spots, Stargazing opportunities |
| The Medina River | A beautiful river area ideal for relaxation and outdoor activities. Great for families, couples, and nature lovers looking to unwind. | River activities, Fishing opportunities, Scenic views, Picnic areas |
| Local Wineries | The surrounding area has several wineries that attract tourists interested in local wine tasting and vineyard tours. A unique attraction for visitors. | Wine tasting tours, Vineyard experiences, Local produce markets |
Understanding Airbnb License Requirements & STR Laws in Hondo (2026)
While Hondo, Texas, United States currently shows low STR regulations, specific Airbnb license requirements might still exist or change. Always verify the latest short term rental regulations and Airbnb license requirements directly with local government authorities for Hondo to ensure full compliance before hosting.
(Source: AirROI data, 2026, finding no licensed listings among those analyzed)
Top Performing Airbnb Properties in Hondo (2026)
Benchmark your potential! Explore examples of top-performing Airbnb properties in Hondobased on Trailing Twelve Month (TTM) revenue. Analyze their characteristics, revenue, occupancy rate, and ADR to understand what drives success in this market.
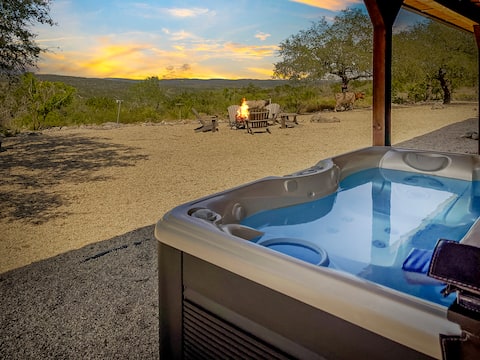
Ranchito | Hilltop Cabin w/ Hot Tub & Scenic Views
Entire Place • 3 bedrooms
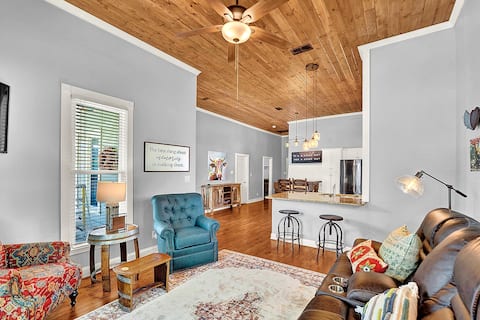
Relax: 2 K Bedrooms, Dogs Welcome, Fenced Yard
Entire Place • 2 bedrooms
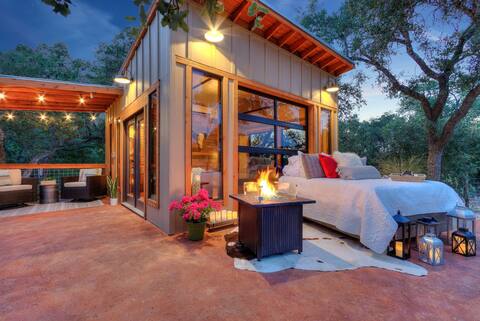
The Hill Country Glass House
Entire Place • 1 bedroom
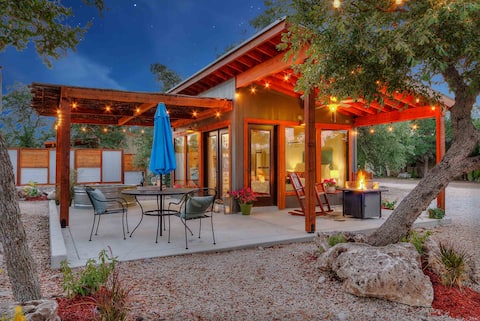
The Patio Casita
Entire Place • 1 bedroom

'The Loft' - Historic Dtwn Hondo Apt w/ Balcony
Entire Place • 2 bedrooms
Starlight Escape Tiny Home
Entire Place • 1 bedroom
Note: Performance varies based on location, size, amenities, seasonality, and management quality. Data reflects the past 12 months.
Top Performing Airbnb Hosts in Hondo (2026)
Learn from the best! This table showcases top-performing Airbnb hosts in Hondo based on the number of properties managed and estimated total revenue over the past year. Analyze their scale and performance metrics.
| Host Name | Properties | Grossing Revenue | Stay Reviews | Avg Rating |
|---|---|---|---|---|
| Twisted Horns Ridge | 8 | $176,676 | 411 | 4.95/5.0 |
| Backroads Reservations | 2 | $43,018 | 30 | 5.00/5.0 |
| Trudy And Mike | 1 | $32,477 | 50 | 4.98/5.0 |
| Amy | 2 | $25,572 | 10 | 4.93/5.0 |
| Evolve | 1 | $25,477 | 16 | 4.75/5.0 |
| Caroline | 3 | $24,835 | 232 | 4.95/5.0 |
| Chris | 1 | $22,570 | 62 | 4.89/5.0 |
| Sondra | 1 | $9,790 | 28 | 4.89/5.0 |
| Host #390744768 | 1 | $3,122 | 0 | Not Rated |
| Stewart | 1 | $3,000 | 93 | 4.95/5.0 |
Analyzing the strategies of top hosts, such as their property selection, pricing, and guest communication, can offer valuable lessons for optimizing your own Airbnb operations in Hondo.
Dive Deeper: Advanced Hondo STR Market Data (2026)
Ready to unlock more insights? AirROI provides access to advanced metrics and comprehensive Airbnb data for Hondo. Explore detailed analytics beyond this report to refine your investment strategy, optimize pricing, and maximize your vacation rental profits.
Explore Advanced MetricsHondo Short-Term Rental Market Composition (2026): Property & Room Types
Room Type Distribution
Property Type Distribution
Market Composition Insights for Hondo
- The Hondo Airbnb market composition is heavily skewed towards Entire Home/Apt listings, which make up 100% of the 22 active rentals. This indicates strong guest preference for privacy and space.
- Looking at the property type distribution in Hondo, House properties are the most common (81.8%), reflecting the local real estate landscape.
- Houses represent a significant 81.8% portion, catering likely to families or larger groups.
- Smaller segments like apartment/condo (combined 4.5%) offer potential for unique stay experiences.
Hondo Airbnb Room Capacity Analysis (2026): Bedroom Distribution
Distribution of Listings by Number of Bedrooms
Room Capacity Insights for Hondo
- The dominant room capacity in Hondo is 1 bedroom listings, making up 50% of the market. This suggests a strong demand for properties suitable for couples or solo travelers.
- Together, 1 bedroom and 2 bedrooms properties represent 72.7% of the active Airbnb listings in Hondo, indicating a high concentration in these sizes.
- A significant 22.7% of listings offer 3+ bedrooms, catering to larger groups and families seeking more space in Hondo.
Hondo Vacation Rental Guest Capacity Trends (2026)
Distribution of Listings by Guest Capacity
Guest Capacity Insights for Hondo
- The most common guest capacity trend in Hondo vacation rentals is listings accommodating 2 guests (50%). This suggests the primary traveler segment is likely couples or solo travelers.
- Properties designed for 2 guests and 8+ guests dominate the Hondo STR market, accounting for 68.2% of listings.
- A significant 50.0% of listings cater specifically to 1-2 guests, highlighting strong demand from couples and solo travelers in Hondo.
- 36.3% of properties accommodate 6+ guests, serving the market segment for larger families or group travel in Hondo.
- On average, properties in Hondo are equipped to host 4.2 guests.
Hondo Airbnb Booking Patterns (2026): Available vs. Booked Days
Available Days Distribution
Booked Days Distribution
Booking Pattern Insights for Hondo
- The most common availability pattern in Hondo falls within the 181-270 days range, representing 59.1% of listings. This suggests many properties have significant open periods on their calendars.
- Approximately 100.0% of listings show high availability (181+ days open annually), indicating potential for increased bookings or specific owner usage patterns.
- For booked days, the 91-180 days range is most frequent in Hondo (59.1%), reflecting common guest stay durations or potential owner blocking patterns.
Hondo Airbnb Minimum Stay Requirements Analysis
Distribution of Listings by Minimum Night Requirement
1 Night
9 listings
40.9% of total
2 Nights
13 listings
59.1% of total
Key Insights
- The most prevalent minimum stay requirement in Hondo is 2 Nights, adopted by 59.1% of listings. This highlights the market's preference for shorter, flexible bookings.
- A strong majority (100.0%) of the Hondo Airbnb data shows acceptance of very short stays (1-2 nights), indicating a dynamic, high-turnover market.
Recommendations
- Align with the market by considering a 2 Nights minimum stay, as 59.1% of Hondo hosts use this setting.
- Adjust minimum nights based on seasonality – potentially shorter during low season and longer during peak demand periods in Hondo.
Hondo Airbnb Cancellation Policy Trends Analysis (2026)
Limited
1 listings
4.8% of total
Flexible
1 listings
4.8% of total
Moderate
2 listings
9.5% of total
Firm
13 listings
61.9% of total
Strict
4 listings
19% of total
Cancellation Policy Insights for Hondo
- The prevailing Airbnb cancellation policy trend in Hondo is Firm, used by 61.9% of listings.
- A majority (80.9%) of hosts in Hondo utilize Firm or Strict policies, indicating a market where hosts prioritize booking security.
Recommendations for Hosts
- Consider adopting a Firm policy to align with the 61.9% market standard in Hondo.
- Regularly review your cancellation policy against competitors and market demand shifts in Hondo.
Hondo STR Booking Lead Time Analysis (2026)
Average Booking Lead Time by Month
Booking Lead Time Insights for Hondo
- The overall average booking lead time for vacation rentals in Hondo is 45 days.
- Guests book furthest in advance for stays during October (average 64 days), likely coinciding with peak travel demand or local events.
- The shortest booking windows occur for stays in August (average 19 days), indicating more last-minute travel plans during this time.
- Seasonally, Fall (56 days avg.) sees the longest lead times, while Summer (25 days avg.) has the shortest, reflecting typical travel planning cycles.
Recommendations for Hosts
- Use the overall average lead time (45 days) as a baseline for your pricing and availability strategy in Hondo.
- For October stays, consider implementing length-of-stay discounts or slightly higher rates for bookings made less than 64 days out to capitalize on advance planning.
- Target marketing efforts for the Fall season well in advance (at least 56 days) to capture early planners.
- Monitor your own booking lead times against these Hondo averages to identify opportunities for dynamic pricing adjustments.
Popular & Essential Airbnb Amenities in Hondo (2026)
Amenity Prevalence
Amenity Insights for Hondo
- Essential amenities in Hondo that guests expect include: Air conditioning, Heating, Free parking on premises, Hot water, Cooking basics, BBQ grill, Essentials. Lacking these (any) could significantly impact bookings.
- Popular amenities like Bed linens, Coffee maker, Microwave are common but not universal. Offering these can provide a competitive edge.
Recommendations for Hosts
- Ensure your listing includes all essential amenities for Hondo: Air conditioning, Heating, Free parking on premises, Hot water, Cooking basics, BBQ grill, Essentials.
- Prioritize adding missing essentials: Cooking basics, BBQ grill, Essentials.
- Consider adding popular differentiators like Bed linens or Coffee maker to increase appeal.
- Highlight unique or less common amenities you offer (e.g., hot tub, dedicated workspace, EV charger) in your listing description and photos.
- Regularly check competitor amenities in Hondo to stay competitive.
Hondo Airbnb Guest Demographics & Profile Analysis (2026)
Guest Profile Summary for Hondo
- The typical guest profile for Airbnb in Hondo consists of primarily domestic travelers (99%), often arriving from nearby San Antonio, typically belonging to the Post-2000s (Gen Z/Alpha) group (50%), primarily speaking English or Spanish.
- Domestic travelers account for 98.8% of guests.
- Key international markets include United States (98.8%) and DC (1.2%).
- Top languages spoken are English (76.1%) followed by Spanish (15.2%).
- A significant demographic segment is the Post-2000s (Gen Z/Alpha) group, representing 50% of guests.
Recommendations for Hosts
- Target domestic marketing efforts towards travelers from San Antonio and Houston.
- Tailor amenities and listing descriptions to appeal to the dominant Post-2000s (Gen Z/Alpha) demographic (e.g., highlight fast WiFi, smart home features, local guides).
- Highlight unique local experiences or amenities relevant to the primary guest profile.
- Consider seasonal promotions aligned with peak travel times for key origin markets.
Nearby Short-Term Rental Market Comparison
How does the Hondo Airbnb market stack up against its neighbors? Compare key performance metrics like average monthly revenue, ADR, and occupancy rates in surrounding areas to understand the broader regional STR landscape.
| Market | Active Properties | Monthly Revenue | Daily Rate | Avg. Occupancy |
|---|---|---|---|---|
| Gillespie County | 11 | $4,887 | $351.24 | 59% |
| Helotes | 48 | $4,095 | $322.31 | 42% |
| Kingsland | 255 | $4,055 | $564.92 | 27% |
| Cottonwood Shores | 26 | $4,012 | $408.66 | 35% |
| Round Mountain | 17 | $3,781 | $385.24 | 42% |
| Dripping Springs | 403 | $3,493 | $389.50 | 32% |
| Briarcliff | 34 | $3,429 | $422.87 | 28% |
| Driftwood | 78 | $3,425 | $342.45 | 32% |
| Fredericksburg | 2,142 | $3,235 | $326.22 | 34% |
| Wimberley | 610 | $3,155 | $320.55 | 35% |