Highlands Airbnb Market Analysis 2026: Short Term Rental Data & Vacation Rental Statistics in Texas, United States
Is Airbnb profitable in Highlands in 2026? Explore comprehensive Airbnb analytics for Highlands, Texas, United States to uncover income potential. This 2026 STR market report for Highlands, based on AirROI data from February 2025 to January 2026, reveals key trends in the niche market of 23 active listings.
Whether you're considering an Airbnb investment in Highlands, optimizing your existing vacation rental, or exploring rental arbitrage opportunities, understanding the Highlands Airbnb data is crucial. Leveraging the low regulation environment is key to maximizing your short term rental income potential. Let's dive into the specifics.
Key Highlands Airbnb Performance Metrics Overview
Monthly Airbnb Revenue Variations & Income Potential in Highlands (2026)
Understanding the monthly revenue variations for Airbnb listings in Highlands is key to maximizing your short term rental income potential. Seasonality significantly impacts earnings. Our analysis, based on data from the past 12 months, shows that the peak revenue month for STRs in Highlands is typically July, while April often presents the lowest earnings, highlighting opportunities for strategic pricing adjustments during shoulder and low seasons. Explore the typical Airbnb income in Highlands across different performance tiers:
- Best-in-class properties (Top 10%) achieve $5,921+ monthly, often utilizing dynamic pricing and superior guest experiences.
- Strong performing properties (Top 25%) earn $3,896 or more, indicating effective management and desirable locations/amenities.
- Typical properties (Median) generate around $2,040 per month, representing the average market performance.
- Entry-level properties (Bottom 25%) see earnings around $1,087, often with potential for optimization.
Average Monthly Airbnb Earnings Trend in Highlands
Highlands Airbnb Occupancy Rate Trends (2026)
Maximize your bookings by understanding the Highlands STR occupancy trends. Seasonal demand shifts significantly influence how often properties are booked. Typically, Julysees the highest demand (peak season occupancy), while April experiences the lowest (low season). Effective strategies, like adjusting minimum stays or offering promotions, can boost occupancy during slower periods. Here's how different property tiers perform in Highlands:
- Best-in-class properties (Top 10%) achieve 61%+ occupancy, indicating high desirability and potentially optimized availability.
- Strong performing properties (Top 25%) maintain 47% or higher occupancy, suggesting good market fit and guest satisfaction.
- Typical properties (Median) have an occupancy rate around 29%.
- Entry-level properties (Bottom 25%) average 18% occupancy, potentially facing higher vacancy.
Average Monthly Occupancy Rate Trend in Highlands
Average Daily Rate (ADR) Airbnb Trends in Highlands (2026)
Effective short term rental pricing strategy in Highlands involves understanding monthly ADR fluctuations. The Average Daily Rate (ADR) for Airbnb in Highlands typically peaks in July and dips lowest during January. Leveraging Airbnb dynamic pricing tools or strategies based on this seasonality can significantly boost revenue. Here's a look at the typical nightly rates achieved:
- Best-in-class properties (Top 10%) command rates of $486+ per night, often due to premium features or locations.
- Strong performing properties (Top 25%) achieve nightly rates of $378 or more.
- Typical properties (Median) charge around $197 per night.
- Entry-level properties (Bottom 25%) earn around $145 per night.
Average Daily Rate (ADR) Trend by Month in Highlands
Get Live Highlands Market Intelligence 👇

Explore Real-time Analytics
Airbnb Seasonality Analysis & Trends in Highlands (2026)
Peak Season (July, June, March)
- Revenue averages $3,977 per month
- Occupancy rates average 43.6%
- Daily rates average $292
Shoulder Season
- Revenue averages $2,881 per month
- Occupancy maintains around 32.9%
- Daily rates hold near $271
Low Season (January, February, April)
- Revenue drops to average $1,744 per month
- Occupancy decreases to average 25.5%
- Daily rates adjust to average $266
Seasonality Insights for Highlands
- The Airbnb seasonality in Highlands shows highly seasonal trends requiring careful strategy. While the sections above show seasonal averages, it's also insightful to look at the extremes:
- During the high season, the absolute peak month showcases Highlands's highest earning potential, with monthly revenues capable of climbing to $4,717, occupancy reaching a high of 47.0%, and ADRs peaking at $298.
- Conversely, the slowest single month of the year, typically falling within the low season, marks the market's lowest point. In this month, revenue might dip to $1,547, occupancy could drop to 21.4%, and ADRs may adjust down to $255.
- Understanding both the seasonal averages and these monthly peaks and troughs in revenue, occupancy, and ADR is crucial for maximizing your Airbnb profit potential in Highlands.
Seasonal Strategies for Maximizing Profit
- Peak Season: Maximize revenue through premium pricing and potentially longer minimum stays. Ensure high availability.
- Low Season: Offer competitive pricing, special promotions (e.g., extended stay discounts), and flexible cancellation policies. Target off-season travelers like remote workers or budget-conscious guests.
- Shoulder Seasons: Implement dynamic pricing that balances peak and low rates. Target weekend travelers or specific events. Offer slightly more flexible terms than peak season.
- Regularly analyze your own performance against these Highlands seasonality benchmarks and adjust your pricing and availability strategy accordingly.
Best Areas for Airbnb Investment in Highlands (2026)
Exploring the top neighborhoods for short-term rentals in Highlands? This section highlights key areas, outlining why they are attractive for hosts and guests, along with notable local attractions. Consider these locations based on your target guest profile and investment strategy.
| Neighborhood / Area | Why Host Here? (Target Guests & Appeal) | Key Attractions & Landmarks |
|---|---|---|
| Crosby | A small town with a growing population, ideal for families and outdoor enthusiasts. Close to Lake Livingston and many parks, making it attractive for those seeking a quieter, nature-oriented experience. | Lake Livingston, Crosby Park, Klein Memorial Park, Crosby Historical Museum |
| Kingwood | Known as 'The Livable Forest', Kingwood is a master-planned community with scenic views and excellent amenities. Perfect for families visiting the Houston area. | Kingwood Township Park, Lake Kingwood, Deer Ridge Park, Kingwood Green Park |
| Humble | A suburban city with a variety of entertainment options, shopping, and outdoor activities. Proximity to both George Bush Intercontinental Airport and downtown Houston. | Old West-style Humble Museum, Lakeside Park, Deerbrook Mall, Humble Civic Center |
| Atascocita | A growing area that offers access to Lake Houston and numerous recreational activities. It appeals to families and outdoor lovers. | Lake Houston, Atascocita Park, Civic Club Park, Humble ISD Athletic Complex |
| New Caney | An affordable area with an emphasis on nature and rural living, it's great for those looking for a peaceful getaway close to Houston. | Lake Livingstone State Park, Old MacDonald's Farm, East End Park, Grand Texas Theme Park |
| Porter | A rapidly developing town with easy access to the Woodlands and I-69, making it suitable for tourists exploring nearby areas, and offering a small-town feel. | Lake Houston Wilderness Park, Oakhurst Golf Club |
| Spring | Part of the Houston metropolitan area with many attractions like The Woodlands and the Old Town Spring historic district, making it appealing for tourists and locals. | Old Town Spring, The Woodlands Mall, Splashtown Waterpark, Wet 'n' Wild SplashTown |
| Tomball | A charming Texas town with a rich history and close-knit community. Its historic downtown features shops and restaurants that attract visitors looking for a unique experience. | Tomball Museum Center, Bracher Park, Tomball Farmers Market, The Depot |
Understanding Airbnb License Requirements & STR Laws in Highlands (2026)
While Highlands, Texas, United States currently shows low STR regulations, specific Airbnb license requirements might still exist or change. Always verify the latest short term rental regulations and Airbnb license requirements directly with local government authorities for Highlands to ensure full compliance before hosting.
(Source: AirROI data, 2026, based on 4% licensed listings)
Top Performing Airbnb Properties in Highlands (2026)
Benchmark your potential! Explore examples of top-performing Airbnb properties in Highlandsbased on Trailing Twelve Month (TTM) revenue. Analyze their characteristics, revenue, occupancy rate, and ADR to understand what drives success in this market.
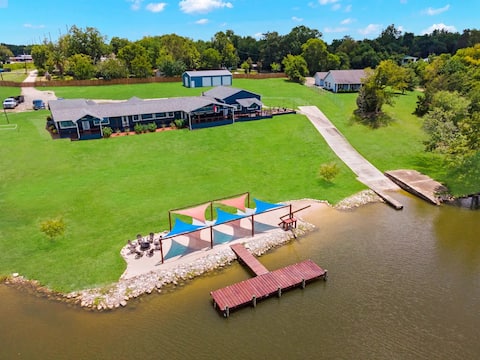
【Waterfront Home Boat Ramp Dock Pool & b-ball】
Entire Place • 7 bedrooms
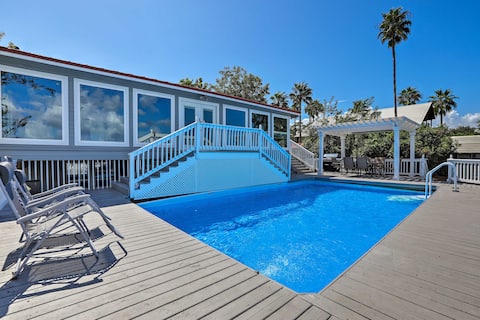
Home on San Jacinto River w/ Pool, Dock & Deck!
Entire Place • 5 bedrooms

Riverfront Modern Loft
Entire Place • 3 bedrooms
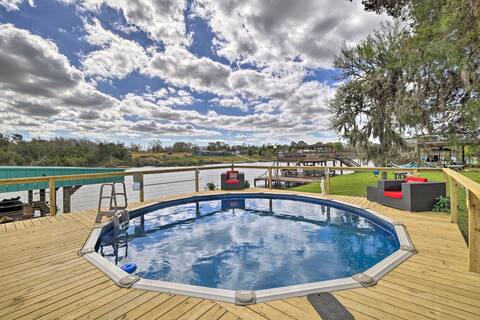
Waterfront San Jacinto River Home w/ Boat Slip!
Entire Place • 3 bedrooms

Houston Riverfront Cabin Retreat
Entire Place • 5 bedrooms

The rio villa
Entire Place • 4 bedrooms
Note: Performance varies based on location, size, amenities, seasonality, and management quality. Data reflects the past 12 months.
Top Performing Airbnb Hosts in Highlands (2026)
Learn from the best! This table showcases top-performing Airbnb hosts in Highlands based on the number of properties managed and estimated total revenue over the past year. Analyze their scale and performance metrics.
| Host Name | Properties | Grossing Revenue | Stay Reviews | Avg Rating |
|---|---|---|---|---|
| Aaron | 5 | $134,909 | 111 | 4.87/5.0 |
| Evolve | 2 | $122,179 | 114 | 4.83/5.0 |
| Mariana | 2 | $105,272 | 68 | 4.97/5.0 |
| Gibran | 5 | $80,979 | 487 | 4.84/5.0 |
| Alex | 1 | $46,460 | 8 | 5.00/5.0 |
| Ross | 1 | $28,693 | 21 | 4.14/5.0 |
| LaTrice | 1 | $22,275 | 28 | 4.86/5.0 |
| Ingrid | 1 | $18,226 | 4 | 5.00/5.0 |
| Linde Duran | 1 | $17,650 | 107 | 4.91/5.0 |
| Yvette | 1 | $16,402 | 250 | 4.96/5.0 |
Analyzing the strategies of top hosts, such as their property selection, pricing, and guest communication, can offer valuable lessons for optimizing your own Airbnb operations in Highlands.
Dive Deeper: Advanced Highlands STR Market Data (2026)
Ready to unlock more insights? AirROI provides access to advanced metrics and comprehensive Airbnb data for Highlands. Explore detailed analytics beyond this report to refine your investment strategy, optimize pricing, and maximize your vacation rental profits.
Explore Advanced MetricsHighlands Short-Term Rental Market Composition (2026): Property & Room Types
Room Type Distribution
Property Type Distribution
Market Composition Insights for Highlands
- The Highlands Airbnb market composition is heavily skewed towards Entire Home/Apt listings, which make up 100% of the 23 active rentals. This indicates strong guest preference for privacy and space.
- Looking at the property type distribution in Highlands, House properties are the most common (87%), reflecting the local real estate landscape.
- Houses represent a significant 87% portion, catering likely to families or larger groups.
- Smaller segments like others (combined 4.3%) offer potential for unique stay experiences.
Highlands Airbnb Room Capacity Analysis (2026): Bedroom Distribution
Distribution of Listings by Number of Bedrooms
Room Capacity Insights for Highlands
- The dominant room capacity in Highlands is 3 bedrooms listings, making up 34.8% of the market. This suggests a strong demand for properties suitable for families or small groups.
- Together, 3 bedrooms and 1 bedroom properties represent 60.9% of the active Airbnb listings in Highlands, indicating a high concentration in these sizes.
- A significant 60.9% of listings offer 3+ bedrooms, catering to larger groups and families seeking more space in Highlands.
Highlands Vacation Rental Guest Capacity Trends (2026)
Distribution of Listings by Guest Capacity
Guest Capacity Insights for Highlands
- The most common guest capacity trend in Highlands vacation rentals is listings accommodating 8+ guests (60.9%). This suggests the primary traveler segment is likely larger groups.
- Properties designed for 8+ guests and 2 guests dominate the Highlands STR market, accounting for 73.9% of listings.
- 69.5% of properties accommodate 6+ guests, serving the market segment for larger families or group travel in Highlands.
- On average, properties in Highlands are equipped to host 6.3 guests.
Highlands Airbnb Booking Patterns (2026): Available vs. Booked Days
Available Days Distribution
Booked Days Distribution
Booking Pattern Insights for Highlands
- The most common availability pattern in Highlands falls within the 181-270 days range, representing 56.5% of listings. This suggests many properties have significant open periods on their calendars.
- Approximately 95.6% of listings show high availability (181+ days open annually), indicating potential for increased bookings or specific owner usage patterns.
- For booked days, the 91-180 days range is most frequent in Highlands (60.9%), reflecting common guest stay durations or potential owner blocking patterns.
- A notable 4.3% of properties secure long booking periods (181+ days booked per year), highlighting successful long-term rental strategies or significant owner usage.
Highlands Airbnb Minimum Stay Requirements Analysis
Distribution of Listings by Minimum Night Requirement
1 Night
2 listings
8.7% of total
2 Nights
8 listings
34.8% of total
3 Nights
4 listings
17.4% of total
4-6 Nights
1 listings
4.3% of total
30+ Nights
8 listings
34.8% of total
Key Insights
- The most prevalent minimum stay requirement in Highlands is 2 Nights, adopted by 34.8% of listings. This highlights the market's preference for shorter, flexible bookings.
- A significant segment (34.8%) caters to monthly stays (30+ nights) in Highlands, pointing to opportunities in the extended-stay market.
Recommendations
- Align with the market by considering a 2 Nights minimum stay, as 34.8% of Highlands hosts use this setting.
- If feasible, allowing 1-night stays, especially midweek or during low season, could capture last-minute bookings, as only 8.7% currently do.
- A 2-night minimum appears standard (34.8%). Consider this for weekends or peak periods.
- Explore offering discounts for stays of 30+ nights to attract the 34.8% of the market seeking extended stays.
- Adjust minimum nights based on seasonality – potentially shorter during low season and longer during peak demand periods in Highlands.
Highlands Airbnb Cancellation Policy Trends Analysis (2026)
Super Strict 30 Days
1 listings
4.3% of total
Flexible
2 listings
8.7% of total
Moderate
6 listings
26.1% of total
Firm
9 listings
39.1% of total
Strict
5 listings
21.7% of total
Cancellation Policy Insights for Highlands
- The prevailing Airbnb cancellation policy trend in Highlands is Firm, used by 39.1% of listings.
- A majority (60.8%) of hosts in Highlands utilize Firm or Strict policies, indicating a market where hosts prioritize booking security.
Recommendations for Hosts
- Consider adopting a Firm policy to align with the 39.1% market standard in Highlands.
- Regularly review your cancellation policy against competitors and market demand shifts in Highlands.
Highlands STR Booking Lead Time Analysis (2026)
Average Booking Lead Time by Month
Booking Lead Time Insights for Highlands
- The overall average booking lead time for vacation rentals in Highlands is 26 days.
- Guests book furthest in advance for stays during July (average 47 days), likely coinciding with peak travel demand or local events.
- The shortest booking windows occur for stays in January (average 19 days), indicating more last-minute travel plans during this time.
- Seasonally, Summer (34 days avg.) sees the longest lead times, while Winter (24 days avg.) has the shortest, reflecting typical travel planning cycles.
Recommendations for Hosts
- Use the overall average lead time (26 days) as a baseline for your pricing and availability strategy in Highlands.
- For July stays, consider implementing length-of-stay discounts or slightly higher rates for bookings made less than 47 days out to capitalize on advance planning.
- Target marketing efforts for the Summer season well in advance (at least 34 days) to capture early planners.
- Monitor your own booking lead times against these Highlands averages to identify opportunities for dynamic pricing adjustments.
Popular & Essential Airbnb Amenities in Highlands (2026)
Amenity Prevalence
Amenity Insights for Highlands
- Essential amenities in Highlands that guests expect include: Wifi, TV, Air conditioning, Kitchen, Free parking on premises, Hot water, Refrigerator. Lacking these (any) could significantly impact bookings.
- Popular amenities like Essentials, Shampoo, Coffee maker are common but not universal. Offering these can provide a competitive edge.
Recommendations for Hosts
- Ensure your listing includes all essential amenities for Highlands: Wifi, TV, Air conditioning, Kitchen, Free parking on premises, Hot water, Refrigerator.
- Prioritize adding missing essentials: Kitchen, Free parking on premises, Hot water, Refrigerator.
- Consider adding popular differentiators like Essentials or Shampoo to increase appeal.
- Highlight unique or less common amenities you offer (e.g., hot tub, dedicated workspace, EV charger) in your listing description and photos.
- Regularly check competitor amenities in Highlands to stay competitive.
Highlands Airbnb Guest Demographics & Profile Analysis (2026)
Guest Profile Summary for Highlands
- The typical guest profile for Airbnb in Highlands consists of primarily domestic travelers (97%), often arriving from nearby Houston, typically belonging to the Post-2000s (Gen Z/Alpha) group (50%), primarily speaking English or Spanish.
- Domestic travelers account for 96.6% of guests.
- Key international markets include United States (96.6%) and Canada (2.5%).
- Top languages spoken are English (69.4%) followed by Spanish (21.2%).
- A significant demographic segment is the Post-2000s (Gen Z/Alpha) group, representing 50% of guests.
Recommendations for Hosts
- Target domestic marketing efforts towards travelers from Houston and Fort Worth.
- Tailor amenities and listing descriptions to appeal to the dominant Post-2000s (Gen Z/Alpha) demographic (e.g., highlight fast WiFi, smart home features, local guides).
- Highlight unique local experiences or amenities relevant to the primary guest profile.
- Consider seasonal promotions aligned with peak travel times for key origin markets.
Nearby Short-Term Rental Market Comparison
How does the Highlands Airbnb market stack up against its neighbors? Compare key performance metrics like average monthly revenue, ADR, and occupancy rates in surrounding areas to understand the broader regional STR landscape.
| Market | Active Properties | Monthly Revenue | Daily Rate | Avg. Occupancy |
|---|---|---|---|---|
| Fairfield | 10 | $4,761 | $360.96 | 42% |
| Midfield | 10 | $4,574 | $539.57 | 23% |
| Jamaica Beach | 199 | $3,774 | $394.20 | 37% |
| Crystal Beach | 143 | $3,768 | $408.48 | 35% |
| Bolivar Peninsula | 913 | $3,311 | $396.49 | 34% |
| Columbus | 17 | $3,218 | $413.88 | 29% |
| Deer Park | 14 | $3,208 | $228.63 | 51% |
| Schulenburg | 25 | $3,157 | $349.06 | 31% |
| Chappell Hill | 11 | $2,947 | $509.72 | 31% |
| Seabrook | 54 | $2,872 | $263.19 | 39% |