Harlingen Airbnb Market Analysis 2026: Short Term Rental Data & Vacation Rental Statistics in Texas, United States
Is Airbnb profitable in Harlingen in 2026? Explore comprehensive Airbnb analytics for Harlingen, Texas, United States to uncover income potential. This 2026 STR market report for Harlingen, based on AirROI data from February 2025 to January 2026, reveals key trends in the niche market of 127 active listings.
Whether you're considering an Airbnb investment in Harlingen, optimizing your existing vacation rental, or exploring rental arbitrage opportunities, understanding the Harlingen Airbnb data is crucial. Leveraging the low regulation environment is key to maximizing your short term rental income potential. Let's dive into the specifics.
Key Harlingen Airbnb Performance Metrics Overview
Monthly Airbnb Revenue Variations & Income Potential in Harlingen (2026)
Understanding the monthly revenue variations for Airbnb listings in Harlingen is key to maximizing your short term rental income potential. Seasonality significantly impacts earnings. Our analysis, based on data from the past 12 months, shows that the peak revenue month for STRs in Harlingen is typically July, while January often presents the lowest earnings, highlighting opportunities for strategic pricing adjustments during shoulder and low seasons. Explore the typical Airbnb income in Harlingen across different performance tiers:
- Best-in-class properties (Top 10%) achieve $4,025+ monthly, often utilizing dynamic pricing and superior guest experiences.
- Strong performing properties (Top 25%) earn $2,514 or more, indicating effective management and desirable locations/amenities.
- Typical properties (Median) generate around $1,466 per month, representing the average market performance.
- Entry-level properties (Bottom 25%) see earnings around $715, often with potential for optimization.
Average Monthly Airbnb Earnings Trend in Harlingen
Harlingen Airbnb Occupancy Rate Trends (2026)
Maximize your bookings by understanding the Harlingen STR occupancy trends. Seasonal demand shifts significantly influence how often properties are booked. Typically, Marchsees the highest demand (peak season occupancy), while September experiences the lowest (low season). Effective strategies, like adjusting minimum stays or offering promotions, can boost occupancy during slower periods. Here's how different property tiers perform in Harlingen:
- Best-in-class properties (Top 10%) achieve 82%+ occupancy, indicating high desirability and potentially optimized availability.
- Strong performing properties (Top 25%) maintain 66% or higher occupancy, suggesting good market fit and guest satisfaction.
- Typical properties (Median) have an occupancy rate around 45%.
- Entry-level properties (Bottom 25%) average 24% occupancy, potentially facing higher vacancy.
Average Monthly Occupancy Rate Trend in Harlingen
Average Daily Rate (ADR) Airbnb Trends in Harlingen (2026)
Effective short term rental pricing strategy in Harlingen involves understanding monthly ADR fluctuations. The Average Daily Rate (ADR) for Airbnb in Harlingen typically peaks in November and dips lowest during April. Leveraging Airbnb dynamic pricing tools or strategies based on this seasonality can significantly boost revenue. Here's a look at the typical nightly rates achieved:
- Best-in-class properties (Top 10%) command rates of $243+ per night, often due to premium features or locations.
- Strong performing properties (Top 25%) achieve nightly rates of $154 or more.
- Typical properties (Median) charge around $109 per night.
- Entry-level properties (Bottom 25%) earn around $72 per night.
Average Daily Rate (ADR) Trend by Month in Harlingen
Get Live Harlingen Market Intelligence 👇

Explore Real-time Analytics
Airbnb Seasonality Analysis & Trends in Harlingen (2026)
Peak Season (July, December, November)
- Revenue averages $2,372 per month
- Occupancy rates average 48.6%
- Daily rates average $151
Shoulder Season
- Revenue averages $2,022 per month
- Occupancy maintains around 44.2%
- Daily rates hold near $143
Low Season (January, February, April)
- Revenue drops to average $1,725 per month
- Occupancy decreases to average 46.2%
- Daily rates adjust to average $138
Seasonality Insights for Harlingen
- The Airbnb seasonality in Harlingen shows moderate seasonality with distinct peak and low periods. While the sections above show seasonal averages, it's also insightful to look at the extremes:
- During the high season, the absolute peak month showcases Harlingen's highest earning potential, with monthly revenues capable of climbing to $2,692, occupancy reaching a high of 55.8%, and ADRs peaking at $155.
- Conversely, the slowest single month of the year, typically falling within the low season, marks the market's lowest point. In this month, revenue might dip to $1,654, occupancy could drop to 38.0%, and ADRs may adjust down to $130.
- Understanding both the seasonal averages and these monthly peaks and troughs in revenue, occupancy, and ADR is crucial for maximizing your Airbnb profit potential in Harlingen.
Seasonal Strategies for Maximizing Profit
- Peak Season: Maximize revenue through premium pricing and potentially longer minimum stays. Ensure high availability.
- Low Season: Offer competitive pricing, special promotions (e.g., extended stay discounts), and flexible cancellation policies. Target off-season travelers like remote workers or budget-conscious guests.
- Shoulder Seasons: Implement dynamic pricing that balances peak and low rates. Target weekend travelers or specific events. Offer slightly more flexible terms than peak season.
- Regularly analyze your own performance against these Harlingen seasonality benchmarks and adjust your pricing and availability strategy accordingly.
Best Areas for Airbnb Investment in Harlingen (2026)
Exploring the top neighborhoods for short-term rentals in Harlingen? This section highlights key areas, outlining why they are attractive for hosts and guests, along with notable local attractions. Consider these locations based on your target guest profile and investment strategy.
| Neighborhood / Area | Why Host Here? (Target Guests & Appeal) | Key Attractions & Landmarks |
|---|---|---|
| Downtown Harlingen | The heart of the city with restaurants, shops, and cultural attractions. A prime spot for travelers looking to experience local life and entertainment. | Harlingen Arts and Heritage Museum, The Historic Plaza Theatre, Downtown Harlingen Farmers Market, Harlingen Civic Center |
| Harlingen Medical District | Close to hospitals and healthcare facilities, attracting medical travelers and their families. Ideal for those seeking convenience to medical services. | Valley Baptist Medical Center, Harlingen Medical Center, San Juanita Park |
| Phoenix Park | A family-friendly neighborhood with parks and community activities. Great for families visiting the area or needing extended stays. | Phoenix Park, Community events, Local dining |
| Los Palacios | A suburban area offering a quieter stay while still being near main attractions. Great for visitors looking for a peaceful environment. | Local parks, Shopping areas, Community centers |
| Resaca de la Palma State Park | Perfect for nature lovers and outdoor enthusiasts. Offers camping, hiking, and birdwatching opportunities, attracting ecotourists. | Resaca de la Palma, Wildlife watching, Nature trails |
| South Texas College | Attracts students and visiting families. Ideal for short-term rentals during academic events and graduations. | South Texas College events, Student activities nearby |
| Harlingen Sports Complex | Hosts various sports events and tournaments, drawing fans and families. Ideal for short-term rentals during events. | Sports events, Local dining options |
| Beaumont Park | A residential area perfect for those looking to experience local living. Close to shops and family-friendly activities. | Beaumont Park, Local eateries, Family-friendly venues |
Understanding Airbnb License Requirements & STR Laws in Harlingen (2026)
While Harlingen, Texas, United States currently shows low STR regulations, specific Airbnb license requirements might still exist or change. Always verify the latest short term rental regulations and Airbnb license requirements directly with local government authorities for Harlingen to ensure full compliance before hosting.
(Source: AirROI data, 2026, based on 2% licensed listings)
Top Performing Airbnb Properties in Harlingen (2026)
Benchmark your potential! Explore examples of top-performing Airbnb properties in Harlingenbased on Trailing Twelve Month (TTM) revenue. Analyze their characteristics, revenue, occupancy rate, and ADR to understand what drives success in this market.

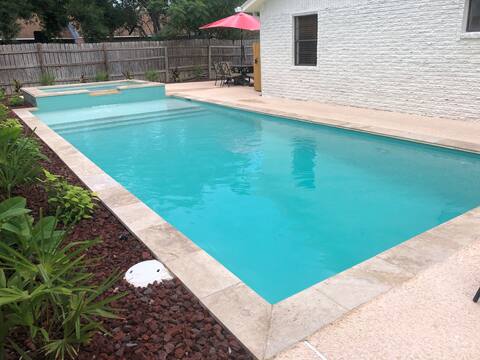
Private Pool: Lakefront Harlingen Home
Entire Place • 6 bedrooms
Entire home - Private heated pool & pool table
Entire Place • 4 bedrooms
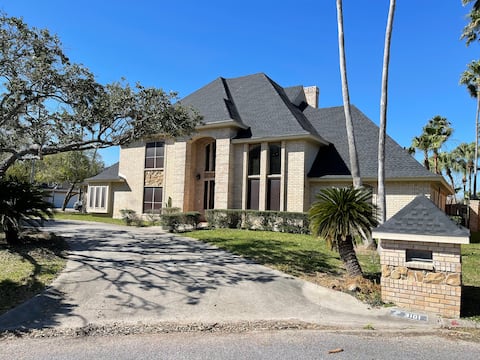
Breathtaking, Lakefront, Pool, Private, big group
Entire Place • 7 bedrooms

The Carriage House in Harlingen, Texas 14
Entire Place • 6 bedrooms

Serene Getaway –Quiet Oasis w/ Pool & Rain Showers
Entire Place • 3 bedrooms
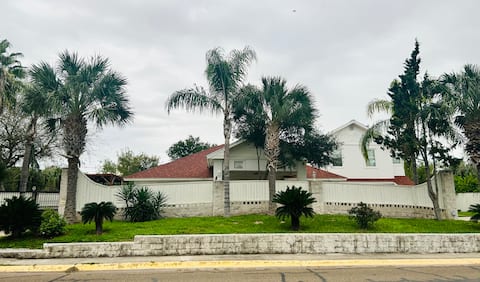
Casa Grande
Entire Place • 6 bedrooms
Note: Performance varies based on location, size, amenities, seasonality, and management quality. Data reflects the past 12 months.
Top Performing Airbnb Hosts in Harlingen (2026)
Learn from the best! This table showcases top-performing Airbnb hosts in Harlingen based on the number of properties managed and estimated total revenue over the past year. Analyze their scale and performance metrics.
| Host Name | Properties | Grossing Revenue | Stay Reviews | Avg Rating |
|---|---|---|---|---|
| Henry | 6 | $199,161 | 276 | 4.98/5.0 |
| Evolve | 3 | $181,796 | 141 | 4.41/5.0 |
| Gina | 2 | $100,067 | 36 | 4.78/5.0 |
| Thacker Properties Llc | 1 | $89,106 | 115 | 4.92/5.0 |
| Ruth | 1 | $88,856 | 118 | 4.97/5.0 |
| Gloria | 1 | $88,808 | 49 | 4.90/5.0 |
| Justin | 1 | $83,215 | 26 | 5.00/5.0 |
| Debbie Gonzales | 3 | $63,039 | 226 | 4.94/5.0 |
| Jose G | 3 | $60,275 | 46 | 4.94/5.0 |
| Fernando | 5 | $59,688 | 374 | 4.95/5.0 |
Analyzing the strategies of top hosts, such as their property selection, pricing, and guest communication, can offer valuable lessons for optimizing your own Airbnb operations in Harlingen.
Dive Deeper: Advanced Harlingen STR Market Data (2026)
Ready to unlock more insights? AirROI provides access to advanced metrics and comprehensive Airbnb data for Harlingen. Explore detailed analytics beyond this report to refine your investment strategy, optimize pricing, and maximize your vacation rental profits.
Explore Advanced MetricsHarlingen Short-Term Rental Market Composition (2026): Property & Room Types
Room Type Distribution
Property Type Distribution
Market Composition Insights for Harlingen
- The Harlingen Airbnb market composition is heavily skewed towards Entire Home/Apt listings, which make up 89.8% of the 127 active rentals. This indicates strong guest preference for privacy and space.
- Looking at the property type distribution in Harlingen, House properties are the most common (55.9%), reflecting the local real estate landscape.
- Houses represent a significant 55.9% portion, catering likely to families or larger groups.
- The presence of 7.9% Hotel/Boutique listings indicates integration with traditional hospitality.
- Smaller segments like others, outdoor/unique (combined 5.5%) offer potential for unique stay experiences.
Harlingen Airbnb Room Capacity Analysis (2026): Bedroom Distribution
Distribution of Listings by Number of Bedrooms
Room Capacity Insights for Harlingen
- The dominant room capacity in Harlingen is 1 bedroom listings, making up 27.6% of the market. This suggests a strong demand for properties suitable for couples or solo travelers.
- Together, 1 bedroom and 3 bedrooms properties represent 54.4% of the active Airbnb listings in Harlingen, indicating a high concentration in these sizes.
- A significant 41.0% of listings offer 3+ bedrooms, catering to larger groups and families seeking more space in Harlingen.
Harlingen Vacation Rental Guest Capacity Trends (2026)
Distribution of Listings by Guest Capacity
Guest Capacity Insights for Harlingen
- The most common guest capacity trend in Harlingen vacation rentals is listings accommodating 6 guests (22%). This suggests the primary traveler segment is likely larger groups.
- Properties designed for 6 guests and 2 guests dominate the Harlingen STR market, accounting for 41.7% of listings.
- 46.4% of properties accommodate 6+ guests, serving the market segment for larger families or group travel in Harlingen.
- On average, properties in Harlingen are equipped to host 4.7 guests.
Harlingen Airbnb Booking Patterns (2026): Available vs. Booked Days
Available Days Distribution
Booked Days Distribution
Booking Pattern Insights for Harlingen
- The most common availability pattern in Harlingen falls within the 271-366 days range, representing 40.2% of listings. This suggests many properties have significant open periods on their calendars.
- Approximately 74.1% of listings show high availability (181+ days open annually), indicating potential for increased bookings or specific owner usage patterns.
- For booked days, the 91-180 days range is most frequent in Harlingen (35.4%), reflecting common guest stay durations or potential owner blocking patterns.
- A notable 26.7% of properties secure long booking periods (181+ days booked per year), highlighting successful long-term rental strategies or significant owner usage.
Harlingen Airbnb Minimum Stay Requirements Analysis
Distribution of Listings by Minimum Night Requirement
1 Night
45 listings
35.4% of total
2 Nights
29 listings
22.8% of total
3 Nights
18 listings
14.2% of total
4-6 Nights
3 listings
2.4% of total
7-29 Nights
4 listings
3.1% of total
30+ Nights
28 listings
22% of total
Key Insights
- The most prevalent minimum stay requirement in Harlingen is 1 Night, adopted by 35.4% of listings. This highlights the market's preference for shorter, flexible bookings.
- A significant segment (22%) caters to monthly stays (30+ nights) in Harlingen, pointing to opportunities in the extended-stay market.
Recommendations
- Align with the market by considering a 1 Night minimum stay, as 35.4% of Harlingen hosts use this setting.
- Explore offering discounts for stays of 30+ nights to attract the 22% of the market seeking extended stays.
- Adjust minimum nights based on seasonality – potentially shorter during low season and longer during peak demand periods in Harlingen.
Harlingen Airbnb Cancellation Policy Trends Analysis (2026)
Super Strict 30 Days
1 listings
0.8% of total
Limited
3 listings
2.4% of total
Flexible
39 listings
31.5% of total
Moderate
34 listings
27.4% of total
Firm
35 listings
28.2% of total
Strict
12 listings
9.7% of total
Cancellation Policy Insights for Harlingen
- The prevailing Airbnb cancellation policy trend in Harlingen is Flexible, used by 31.5% of listings.
- There's a relatively balanced mix between guest-friendly (58.9%) and stricter (37.9%) policies, offering choices for different guest needs.
- Strict cancellation policies are quite rare (9.7%), potentially making listings with this policy less competitive unless justified by high demand or property type.
Recommendations for Hosts
- Consider adopting a Flexible policy to align with the 31.5% market standard in Harlingen.
- Using a Strict policy might deter some guests, as only 9.7% of listings use it. Evaluate if potential revenue protection outweighs possible lower booking rates.
- Regularly review your cancellation policy against competitors and market demand shifts in Harlingen.
Harlingen STR Booking Lead Time Analysis (2026)
Average Booking Lead Time by Month
Booking Lead Time Insights for Harlingen
- The overall average booking lead time for vacation rentals in Harlingen is 25 days.
- Guests book furthest in advance for stays during November (average 33 days), likely coinciding with peak travel demand or local events.
- The shortest booking windows occur for stays in August (average 17 days), indicating more last-minute travel plans during this time.
- Seasonally, Winter (29 days avg.) sees the longest lead times, while Summer (21 days avg.) has the shortest, reflecting typical travel planning cycles.
Recommendations for Hosts
- Use the overall average lead time (25 days) as a baseline for your pricing and availability strategy in Harlingen.
- Target marketing efforts for the Winter season well in advance (at least 29 days) to capture early planners.
- Monitor your own booking lead times against these Harlingen averages to identify opportunities for dynamic pricing adjustments.
Popular & Essential Airbnb Amenities in Harlingen (2026)
Amenity Prevalence
Amenity Insights for Harlingen
- Essential amenities in Harlingen that guests expect include: Air conditioning, Wifi, Free parking on premises, TV. Lacking these (any) could significantly impact bookings.
- Popular amenities like Smoke alarm, Kitchen, Hot water are common but not universal. Offering these can provide a competitive edge.
Recommendations for Hosts
- Ensure your listing includes all essential amenities for Harlingen: Air conditioning, Wifi, Free parking on premises, TV.
- Prioritize adding missing essentials: Air conditioning, Wifi, Free parking on premises, TV.
- Consider adding popular differentiators like Smoke alarm or Kitchen to increase appeal.
- Highlight unique or less common amenities you offer (e.g., hot tub, dedicated workspace, EV charger) in your listing description and photos.
- Regularly check competitor amenities in Harlingen to stay competitive.
Harlingen Airbnb Guest Demographics & Profile Analysis (2026)
Guest Profile Summary for Harlingen
- The typical guest profile for Airbnb in Harlingen consists of primarily domestic travelers (95%), often arriving from nearby San Antonio, typically belonging to the Post-2000s (Gen Z/Alpha) group (50%), primarily speaking English or Spanish.
- Domestic travelers account for 95.1% of guests.
- Key international markets include United States (95.1%) and Mexico (3.6%).
- Top languages spoken are English (55.8%) followed by Spanish (27.9%).
- A significant demographic segment is the Post-2000s (Gen Z/Alpha) group, representing 50% of guests.
Recommendations for Hosts
- Target domestic marketing efforts towards travelers from San Antonio and Houston.
- Tailor amenities and listing descriptions to appeal to the dominant Post-2000s (Gen Z/Alpha) demographic (e.g., highlight fast WiFi, smart home features, local guides).
- Highlight unique local experiences or amenities relevant to the primary guest profile.
- Consider seasonal promotions aligned with peak travel times for key origin markets.
Nearby Short-Term Rental Market Comparison
How does the Harlingen Airbnb market stack up against its neighbors? Compare key performance metrics like average monthly revenue, ADR, and occupancy rates in surrounding areas to understand the broader regional STR landscape.
| Market | Active Properties | Monthly Revenue | Daily Rate | Avg. Occupancy |
|---|---|---|---|---|
| City-by-the Sea | 24 | $4,479 | $520.08 | 35% |
| Port Aransas | 2,361 | $3,422 | $437.85 | 34% |
| South Padre Island | 2,347 | $2,957 | $341.64 | 36% |
| Port Mansfield | 29 | $2,788 | $374.59 | 32% |
| Alton | 13 | $2,484 | $392.58 | 23% |
| Rio Hondo | 46 | $2,381 | $309.67 | 31% |
| Port Isabel | 249 | $2,138 | $253.87 | 38% |
| Portland | 10 | $2,123 | $239.57 | 50% |
| Corpus Christi | 1,950 | $2,047 | $224.99 | 39% |
| Kingsville | 16 | $2,008 | $152.10 | 46% |