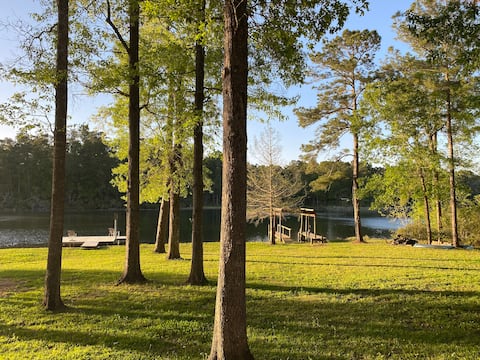
Goodrich Airbnb Market Analysis 2026: Short Term Rental Data & Vacation Rental Statistics in Texas, United States
Is Airbnb profitable in Goodrich in 2026? Explore comprehensive Airbnb analytics for Goodrich, Texas, United States to uncover income potential. This 2026 STR market report for Goodrich, based on AirROI data from February 2025 to January 2026, reveals key trends in the niche market of 23 active listings.
Whether you're considering an Airbnb investment in Goodrich, optimizing your existing vacation rental, or exploring rental arbitrage opportunities, understanding the Goodrich Airbnb data is crucial. Leveraging the low regulation environment is key to maximizing your short term rental income potential. Let's dive into the specifics.
Key Goodrich Airbnb Performance Metrics Overview
Monthly Airbnb Revenue Variations & Income Potential in Goodrich (2026)
Understanding the monthly revenue variations for Airbnb listings in Goodrich is key to maximizing your short term rental income potential. Seasonality significantly impacts earnings. Our analysis, based on data from the past 12 months, shows that the peak revenue month for STRs in Goodrich is typically March, while February often presents the lowest earnings, highlighting opportunities for strategic pricing adjustments during shoulder and low seasons. Explore the typical Airbnb income in Goodrich across different performance tiers:
- Best-in-class properties (Top 10%) achieve $5,482+ monthly, often utilizing dynamic pricing and superior guest experiences.
- Strong performing properties (Top 25%) earn $2,641 or more, indicating effective management and desirable locations/amenities.
- Typical properties (Median) generate around $1,119 per month, representing the average market performance.
- Entry-level properties (Bottom 25%) see earnings around $472, often with potential for optimization.
Average Monthly Airbnb Earnings Trend in Goodrich
Goodrich Airbnb Occupancy Rate Trends (2026)
Maximize your bookings by understanding the Goodrich STR occupancy trends. Seasonal demand shifts significantly influence how often properties are booked. Typically, Junesees the highest demand (peak season occupancy), while October experiences the lowest (low season). Effective strategies, like adjusting minimum stays or offering promotions, can boost occupancy during slower periods. Here's how different property tiers perform in Goodrich:
- Best-in-class properties (Top 10%) achieve 68%+ occupancy, indicating high desirability and potentially optimized availability.
- Strong performing properties (Top 25%) maintain 46% or higher occupancy, suggesting good market fit and guest satisfaction.
- Typical properties (Median) have an occupancy rate around 24%.
- Entry-level properties (Bottom 25%) average 12% occupancy, potentially facing higher vacancy.
Average Monthly Occupancy Rate Trend in Goodrich
Average Daily Rate (ADR) Airbnb Trends in Goodrich (2026)
Effective short term rental pricing strategy in Goodrich involves understanding monthly ADR fluctuations. The Average Daily Rate (ADR) for Airbnb in Goodrich typically peaks in October and dips lowest during February. Leveraging Airbnb dynamic pricing tools or strategies based on this seasonality can significantly boost revenue. Here's a look at the typical nightly rates achieved:
- Best-in-class properties (Top 10%) command rates of $299+ per night, often due to premium features or locations.
- Strong performing properties (Top 25%) achieve nightly rates of $184 or more.
- Typical properties (Median) charge around $117 per night.
- Entry-level properties (Bottom 25%) earn around $76 per night.
Average Daily Rate (ADR) Trend by Month in Goodrich
Get Live Goodrich Market Intelligence 👇

Explore Real-time Analytics
Airbnb Seasonality Analysis & Trends in Goodrich (2026)
Peak Season (March, June, July)
- Revenue averages $2,576 per month
- Occupancy rates average 39.5%
- Daily rates average $140
Shoulder Season
- Revenue averages $2,135 per month
- Occupancy maintains around 30.8%
- Daily rates hold near $162
Low Season (January, February, April)
- Revenue drops to average $1,378 per month
- Occupancy decreases to average 25.9%
- Daily rates adjust to average $148
Seasonality Insights for Goodrich
- The Airbnb seasonality in Goodrich shows highly seasonal trends requiring careful strategy. While the sections above show seasonal averages, it's also insightful to look at the extremes:
- During the high season, the absolute peak month showcases Goodrich's highest earning potential, with monthly revenues capable of climbing to $2,638, occupancy reaching a high of 42.6%, and ADRs peaking at $177.
- Conversely, the slowest single month of the year, typically falling within the low season, marks the market's lowest point. In this month, revenue might dip to $1,140, occupancy could drop to 22.8%, and ADRs may adjust down to $136.
- Understanding both the seasonal averages and these monthly peaks and troughs in revenue, occupancy, and ADR is crucial for maximizing your Airbnb profit potential in Goodrich.
Seasonal Strategies for Maximizing Profit
- Peak Season: Maximize revenue through premium pricing and potentially longer minimum stays. Ensure high availability.
- Low Season: Offer competitive pricing, special promotions (e.g., extended stay discounts), and flexible cancellation policies. Target off-season travelers like remote workers or budget-conscious guests.
- Shoulder Seasons: Implement dynamic pricing that balances peak and low rates. Target weekend travelers or specific events. Offer slightly more flexible terms than peak season.
- Regularly analyze your own performance against these Goodrich seasonality benchmarks and adjust your pricing and availability strategy accordingly.
Best Areas for Airbnb Investment in Goodrich (2026)
Exploring the top neighborhoods for short-term rentals in Goodrich? This section highlights key areas, outlining why they are attractive for hosts and guests, along with notable local attractions. Consider these locations based on your target guest profile and investment strategy.
| Neighborhood / Area | Why Host Here? (Target Guests & Appeal) | Key Attractions & Landmarks |
|---|---|---|
| Lake Worth | A popular destination for water sports and outdoor activities, Lake Worth attracts tourists for its scenic views and cultural events. Great for vacationers looking to relax by the water and explore local art. | Lake Worth Beach, Lake Worth Playhouse, Mango Groves Park, Cultural Plaza, Lake Worth Farmers Market |
| Southlake | Known for its beautiful suburban setting, Southlake offers shopping, dining, and family-friendly activities, making it a great area for family vacations. | Southlake Town Square, Bob Jones Nature Center, Parks at the Town Center, Southlake Community Band |
| Grapevine | Famous for its vineyards and charming downtown area, Grapevine is a favorite for wine lovers and those attending events in its historic district. | Grapevine Vintage Railroad, Great Wolf Lodge, Grapevine Main Street, Grapevine Mills Mall, Wine Tours |
| Cedar Hill State Park | Ideal for nature lovers, this park offers outdoor recreation like hiking, fishing, and picnicking. Perfect for those seeking a retreat from city life. | Cedar Hill State Park, Joe Pool Lake, Cedar Hill Towne Center, Dogwood Canyon Audubon Center |
| Addison | A vibrant area known for its dining and entertaining options, Addison's numerous festivals attract both locals and visitors, making it ideal for short-term rentals. | Addison Circle Park, restaurants, WaterTower Theatre, Addison Oktoberfest, Kaboom Town! |
| Frisco | With a rapidly growing population and many sports teams, Frisco is thriving and attracts visitors for its parks and entertainment options. | The Star in Frisco, Frisco Square, Zero Gravity Thrill Amusement Park, Frisco Heritage Museum |
| The Colony | Situated near the shores of Lewisville Lake, The Colony offers recreational activities and a community feel, popular with families and travelers looking for leisure time. | Hawaiian Falls Waterpark, The Colony Five Star Complex, Lewisville Lake, Stewart Peninsula Golf Course |
| Mansfield | A quiet and family-oriented community, Mansfield offers parks and a small-town feel, appealing to those looking for a peaceful getaway. | Mansfield Historical Museum, Elmer W. Oliver Nature Park, Hawaiian Falls Mansfield, Big League Dreams Sports Park |
Understanding Airbnb License Requirements & STR Laws in Goodrich (2026)
While Goodrich, Texas, United States currently shows low STR regulations, specific Airbnb license requirements might still exist or change. Always verify the latest short term rental regulations and Airbnb license requirements directly with local government authorities for Goodrich to ensure full compliance before hosting.
(Source: AirROI data, 2026, finding no licensed listings among those analyzed)
Top Performing Airbnb Properties in Goodrich (2026)
Benchmark your potential! Explore examples of top-performing Airbnb properties in Goodrichbased on Trailing Twelve Month (TTM) revenue. Analyze their characteristics, revenue, occupancy rate, and ADR to understand what drives success in this market.

Luxury Lake Front Home w/Hot Tub
Entire Place • 3 bedrooms

Early check in Late check out/ Kayaks
Entire Place • 4 bedrooms
Sunflower Landing
Entire Place • 3 bedrooms
Gentle Villa
Entire Place • 8 bedrooms

Lake House Retreat-Boats-Hammocks- Campfire Nights
Entire Place • 3 bedrooms

LAKE HOUSE in the WOODS! St. Amos
Entire Place • 1 bedroom
Note: Performance varies based on location, size, amenities, seasonality, and management quality. Data reflects the past 12 months.
Top Performing Airbnb Hosts in Goodrich (2026)
Learn from the best! This table showcases top-performing Airbnb hosts in Goodrich based on the number of properties managed and estimated total revenue over the past year. Analyze their scale and performance metrics.
| Host Name | Properties | Grossing Revenue | Stay Reviews | Avg Rating |
|---|---|---|---|---|
| James | 1 | $71,133 | 46 | 5.00/5.0 |
| Alise | 1 | $70,071 | 94 | 4.97/5.0 |
| Linda | 1 | $40,505 | 63 | 4.97/5.0 |
| Jose | 12 | $38,556 | 70 | 4.72/5.0 |
| Raphael Terrance | 1 | $34,706 | 66 | 4.65/5.0 |
| Richard | 1 | $27,715 | 114 | 4.83/5.0 |
| Anissa | 1 | $27,409 | 113 | 4.93/5.0 |
| Tuan | 1 | $20,877 | 81 | 4.93/5.0 |
| Calicia | 1 | $15,005 | 38 | 4.87/5.0 |
| Susy | 2 | $11,385 | 28 | 4.69/5.0 |
Analyzing the strategies of top hosts, such as their property selection, pricing, and guest communication, can offer valuable lessons for optimizing your own Airbnb operations in Goodrich.
Dive Deeper: Advanced Goodrich STR Market Data (2026)
Ready to unlock more insights? AirROI provides access to advanced metrics and comprehensive Airbnb data for Goodrich. Explore detailed analytics beyond this report to refine your investment strategy, optimize pricing, and maximize your vacation rental profits.
Explore Advanced MetricsGoodrich Short-Term Rental Market Composition (2026): Property & Room Types
Room Type Distribution
Property Type Distribution
Market Composition Insights for Goodrich
- The Goodrich Airbnb market composition is heavily skewed towards Entire Home/Apt listings, which make up 100% of the 23 active rentals. This indicates strong guest preference for privacy and space.
- Looking at the property type distribution in Goodrich, House properties are the most common (95.7%), reflecting the local real estate landscape.
- Houses represent a significant 95.7% portion, catering likely to families or larger groups.
- Smaller segments like apartment/condo (combined 4.3%) offer potential for unique stay experiences.
Goodrich Airbnb Room Capacity Analysis (2026): Bedroom Distribution
Distribution of Listings by Number of Bedrooms
Room Capacity Insights for Goodrich
- The dominant room capacity in Goodrich is 3 bedrooms listings, making up 30.4% of the market. This suggests a strong demand for properties suitable for families or small groups.
- Together, 3 bedrooms and 1 bedroom properties represent 56.5% of the active Airbnb listings in Goodrich, indicating a high concentration in these sizes.
- A significant 56.5% of listings offer 3+ bedrooms, catering to larger groups and families seeking more space in Goodrich.
Goodrich Vacation Rental Guest Capacity Trends (2026)
Distribution of Listings by Guest Capacity
Guest Capacity Insights for Goodrich
- The most common guest capacity trend in Goodrich vacation rentals is listings accommodating 8+ guests (39.1%). This suggests the primary traveler segment is likely larger groups.
- Properties designed for 8+ guests and 6 guests dominate the Goodrich STR market, accounting for 60.8% of listings.
- 73.8% of properties accommodate 6+ guests, serving the market segment for larger families or group travel in Goodrich.
- On average, properties in Goodrich are equipped to host 6.1 guests.
Goodrich Airbnb Booking Patterns (2026): Available vs. Booked Days
Available Days Distribution
Booked Days Distribution
Booking Pattern Insights for Goodrich
- The most common availability pattern in Goodrich falls within the 271-366 days range, representing 69.6% of listings. This suggests many properties have significant open periods on their calendars.
- Approximately 87.0% of listings show high availability (181+ days open annually), indicating potential for increased bookings or specific owner usage patterns.
- For booked days, the 31-90 days range is most frequent in Goodrich (34.8%), reflecting common guest stay durations or potential owner blocking patterns.
- A notable 13.0% of properties secure long booking periods (181+ days booked per year), highlighting successful long-term rental strategies or significant owner usage.
Goodrich Airbnb Minimum Stay Requirements Analysis
Distribution of Listings by Minimum Night Requirement
1 Night
1 listings
4.3% of total
2 Nights
14 listings
60.9% of total
3 Nights
2 listings
8.7% of total
30+ Nights
6 listings
26.1% of total
Key Insights
- The most prevalent minimum stay requirement in Goodrich is 2 Nights, adopted by 60.9% of listings. This highlights the market's preference for shorter, flexible bookings.
- A strong majority (65.2%) of the Goodrich Airbnb data shows acceptance of very short stays (1-2 nights), indicating a dynamic, high-turnover market.
- A significant segment (26.1%) caters to monthly stays (30+ nights) in Goodrich, pointing to opportunities in the extended-stay market.
Recommendations
- Align with the market by considering a 2 Nights minimum stay, as 60.9% of Goodrich hosts use this setting.
- If feasible, allowing 1-night stays, especially midweek or during low season, could capture last-minute bookings, as only 4.3% currently do.
- A 2-night minimum appears standard (60.9%). Consider this for weekends or peak periods.
- Explore offering discounts for stays of 30+ nights to attract the 26.1% of the market seeking extended stays.
- Adjust minimum nights based on seasonality – potentially shorter during low season and longer during peak demand periods in Goodrich.
Goodrich Airbnb Cancellation Policy Trends Analysis (2026)
Flexible
7 listings
30.4% of total
Moderate
12 listings
52.2% of total
Firm
4 listings
17.4% of total
Cancellation Policy Insights for Goodrich
- The prevailing Airbnb cancellation policy trend in Goodrich is Moderate, used by 52.2% of listings.
- The market strongly favors guest-friendly terms, with 82.6% of listings offering Flexible or Moderate policies. This suggests guests in Goodrich may expect booking flexibility.
Recommendations for Hosts
- Consider adopting a Moderate policy to align with the 52.2% market standard in Goodrich.
- Regularly review your cancellation policy against competitors and market demand shifts in Goodrich.
Goodrich STR Booking Lead Time Analysis (2026)
Average Booking Lead Time by Month
Booking Lead Time Insights for Goodrich
- The overall average booking lead time for vacation rentals in Goodrich is 21 days.
- Guests book furthest in advance for stays during April (average 51 days), likely coinciding with peak travel demand or local events.
- The shortest booking windows occur for stays in January (average 8 days), indicating more last-minute travel plans during this time.
- Seasonally, Spring (36 days avg.) sees the longest lead times, while Winter (16 days avg.) has the shortest, reflecting typical travel planning cycles.
Recommendations for Hosts
- Use the overall average lead time (21 days) as a baseline for your pricing and availability strategy in Goodrich.
- For April stays, consider implementing length-of-stay discounts or slightly higher rates for bookings made less than 51 days out to capitalize on advance planning.
- During January, focus on last-minute booking availability and promotions, as guests book with very short notice (8 days avg.).
- Target marketing efforts for the Spring season well in advance (at least 36 days) to capture early planners.
- Monitor your own booking lead times against these Goodrich averages to identify opportunities for dynamic pricing adjustments.
Popular & Essential Airbnb Amenities in Goodrich (2026)
Amenity Prevalence
Amenity Insights for Goodrich
- Essential amenities in Goodrich that guests expect include: Free parking on premises, Kitchen, TV, Wifi, BBQ grill, Air conditioning. Lacking these (any) could significantly impact bookings.
- Popular amenities like Lake access, Hot water, Pets allowed are common but not universal. Offering these can provide a competitive edge.
Recommendations for Hosts
- Ensure your listing includes all essential amenities for Goodrich: Free parking on premises, Kitchen, TV, Wifi, BBQ grill, Air conditioning.
- Prioritize adding missing essentials: BBQ grill, Air conditioning.
- Consider adding popular differentiators like Lake access or Hot water to increase appeal.
- Highlight unique or less common amenities you offer (e.g., hot tub, dedicated workspace, EV charger) in your listing description and photos.
- Regularly check competitor amenities in Goodrich to stay competitive.
Goodrich Airbnb Guest Demographics & Profile Analysis (2026)
Guest Profile Summary for Goodrich
- The typical guest profile for Airbnb in Goodrich consists of primarily domestic travelers (96%), often arriving from nearby Houston, typically belonging to the Post-2000s (Gen Z/Alpha) group (50%), primarily speaking English or Spanish.
- Domestic travelers account for 95.7% of guests.
- Key international markets include United States (95.7%) and Canada (1.1%).
- Top languages spoken are English (69.2%) followed by Spanish (25.6%).
- A significant demographic segment is the Post-2000s (Gen Z/Alpha) group, representing 50% of guests.
Recommendations for Hosts
- Target domestic marketing efforts towards travelers from Houston and Austin.
- Tailor amenities and listing descriptions to appeal to the dominant Post-2000s (Gen Z/Alpha) demographic (e.g., highlight fast WiFi, smart home features, local guides).
- Highlight unique local experiences or amenities relevant to the primary guest profile.
- Consider seasonal promotions aligned with peak travel times for key origin markets.
Nearby Short-Term Rental Market Comparison
How does the Goodrich Airbnb market stack up against its neighbors? Compare key performance metrics like average monthly revenue, ADR, and occupancy rates in surrounding areas to understand the broader regional STR landscape.
| Market | Active Properties | Monthly Revenue | Daily Rate | Avg. Occupancy |
|---|---|---|---|---|
| Fairfield | 10 | $4,761 | $360.96 | 42% |
| Jamaica Beach | 199 | $3,774 | $394.20 | 37% |
| Crystal Beach | 143 | $3,768 | $408.48 | 35% |
| Bolivar Peninsula | 913 | $3,311 | $396.49 | 34% |
| Deer Park | 14 | $3,208 | $228.63 | 51% |
| Milam | 12 | $2,955 | $346.16 | 41% |
| Seabrook | 54 | $2,872 | $263.19 | 39% |
| Hackberry | 26 | $2,869 | $332.54 | 31% |
| Friendswood | 31 | $2,816 | $247.85 | 46% |
| Porter | 17 | $2,773 | $213.97 | 43% |