Galveston Airbnb Market Analysis 2026: Short Term Rental Data & Vacation Rental Statistics in Texas, United States
Is Airbnb profitable in Galveston in 2026? Explore comprehensive Airbnb analytics for Galveston, Texas, United States to uncover income potential. This 2026 STR market report for Galveston, based on AirROI data from February 2025 to January 2026, reveals key trends in the bustling market of 3,732 active listings.
Whether you're considering an Airbnb investment in Galveston, optimizing your existing vacation rental, or exploring rental arbitrage opportunities, understanding the Galveston Airbnb data is crucial. Navigating the high regulation landscape is key to maximizing your short term rental income potential. Let's dive into the specifics.
Key Galveston Airbnb Performance Metrics Overview
Monthly Airbnb Revenue Variations & Income Potential in Galveston (2026)
Understanding the monthly revenue variations for Airbnb listings in Galveston is key to maximizing your short term rental income potential. Seasonality significantly impacts earnings. Our analysis, based on data from the past 12 months, shows that the peak revenue month for STRs in Galveston is typically July, while February often presents the lowest earnings, highlighting opportunities for strategic pricing adjustments during shoulder and low seasons. Explore the typical Airbnb income in Galveston across different performance tiers:
- Best-in-class properties (Top 10%) achieve $7,006+ monthly, often utilizing dynamic pricing and superior guest experiences.
- Strong performing properties (Top 25%) earn $4,180 or more, indicating effective management and desirable locations/amenities.
- Typical properties (Median) generate around $2,373 per month, representing the average market performance.
- Entry-level properties (Bottom 25%) see earnings around $1,267, often with potential for optimization.
Average Monthly Airbnb Earnings Trend in Galveston
Galveston Airbnb Occupancy Rate Trends (2026)
Maximize your bookings by understanding the Galveston STR occupancy trends. Seasonal demand shifts significantly influence how often properties are booked. Typically, Julysees the highest demand (peak season occupancy), while January experiences the lowest (low season). Effective strategies, like adjusting minimum stays or offering promotions, can boost occupancy during slower periods. Here's how different property tiers perform in Galveston:
- Best-in-class properties (Top 10%) achieve 70%+ occupancy, indicating high desirability and potentially optimized availability.
- Strong performing properties (Top 25%) maintain 52% or higher occupancy, suggesting good market fit and guest satisfaction.
- Typical properties (Median) have an occupancy rate around 33%.
- Entry-level properties (Bottom 25%) average 18% occupancy, potentially facing higher vacancy.
Average Monthly Occupancy Rate Trend in Galveston
Average Daily Rate (ADR) Airbnb Trends in Galveston (2026)
Effective short term rental pricing strategy in Galveston involves understanding monthly ADR fluctuations. The Average Daily Rate (ADR) for Airbnb in Galveston typically peaks in June and dips lowest during February. Leveraging Airbnb dynamic pricing tools or strategies based on this seasonality can significantly boost revenue. Here's a look at the typical nightly rates achieved:
- Best-in-class properties (Top 10%) command rates of $527+ per night, often due to premium features or locations.
- Strong performing properties (Top 25%) achieve nightly rates of $354 or more.
- Typical properties (Median) charge around $239 per night.
- Entry-level properties (Bottom 25%) earn around $166 per night.
Average Daily Rate (ADR) Trend by Month in Galveston
Get Live Galveston Market Intelligence 👇

Explore Real-time Analytics
Airbnb Seasonality Analysis & Trends in Galveston (2026)
Peak Season (July, June, August)
- Revenue averages $5,114 per month
- Occupancy rates average 49.1%
- Daily rates average $319
Shoulder Season
- Revenue averages $2,989 per month
- Occupancy maintains around 34.5%
- Daily rates hold near $288
Low Season (January, February, November)
- Revenue drops to average $2,172 per month
- Occupancy decreases to average 28.1%
- Daily rates adjust to average $284
Seasonality Insights for Galveston
- The Airbnb seasonality in Galveston shows highly seasonal trends requiring careful strategy. While the sections above show seasonal averages, it's also insightful to look at the extremes:
- During the high season, the absolute peak month showcases Galveston's highest earning potential, with monthly revenues capable of climbing to $5,963, occupancy reaching a high of 55.4%, and ADRs peaking at $331.
- Conversely, the slowest single month of the year, typically falling within the low season, marks the market's lowest point. In this month, revenue might dip to $1,956, occupancy could drop to 24.0%, and ADRs may adjust down to $253.
- Understanding both the seasonal averages and these monthly peaks and troughs in revenue, occupancy, and ADR is crucial for maximizing your Airbnb profit potential in Galveston.
Seasonal Strategies for Maximizing Profit
- Peak Season: Maximize revenue through premium pricing and potentially longer minimum stays. Ensure high availability.
- Low Season: Offer competitive pricing, special promotions (e.g., extended stay discounts), and flexible cancellation policies. Target off-season travelers like remote workers or budget-conscious guests.
- Shoulder Seasons: Implement dynamic pricing that balances peak and low rates. Target weekend travelers or specific events. Offer slightly more flexible terms than peak season.
- Regularly analyze your own performance against these Galveston seasonality benchmarks and adjust your pricing and availability strategy accordingly.
Best Areas for Airbnb Investment in Galveston (2026)
Exploring the top neighborhoods for short-term rentals in Galveston? This section highlights key areas, outlining why they are attractive for hosts and guests, along with notable local attractions. Consider these locations based on your target guest profile and investment strategy.
| Neighborhood / Area | Why Host Here? (Target Guests & Appeal) | Key Attractions & Landmarks |
|---|---|---|
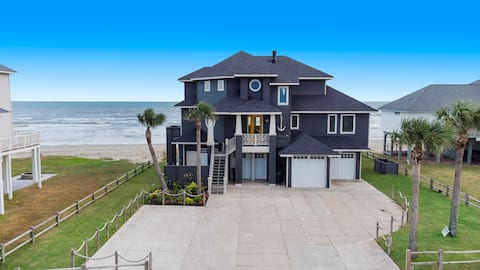
| Galveston Island | A popular destination for beachgoers and tourists looking for a coastal getaway. Offers a variety of attractions including beaches and historical sites. | Stewart Beach, Galveston Island Historic Pleasure Pier, Moody Gardens, Bishop's Palace, The Strand Historic District |
| The Strand District | Known for its historic architecture, shops, and restaurants. A vibrant area that attracts visitors who enjoy dining and shopping. | The Strand, Galveston Historical Foundation, Tremont Park, The Grand 1894 Opera House, Galveston Railroad Museum |
| West End | Offers a more relaxed and less crowded beach experience, ideal for families and group getaways. Known for its vacation rentals and beautiful beach houses. | West Beach, Beaches of Galveston, Galveston State Park, Fishing spots, Local restaurants |
| East End | Features beautiful Victorian homes and a historic feel, attracting those interested in architecture and history. Close to several key attractions. | East End Historic District, St. Mary Cathedral Basilica, Bishop's Palace, Lakeside Park, East Beach |
| Seawall Boulevard | A prime location along the coast with easy access to the beach, restaurants, and entertainment. Very popular among tourists. | Galveston Seawall, Pleasure Pier, restaurants with ocean views, bicycle paths, beach access points |
| North Side | Offers a quieter, residential feel and is home to many local families. Great for longer stays and those interested in living like a local. | Galveston Community College, local parks, quiet residential areas, Marina |
| Pelican Island | Known for its nature sanctuary, it attracts nature lovers and those looking for a peaceful environment close to the water. | Pelican Island National Wildlife Refuge, fishing spots, bird watching, nature trails |
| San Luis Pass | A more secluded area, ideal for those looking for privacy and a getaway from the more touristy spots, popular for fishing and water sports. | San Luis Beach, water sports activities, fishing spots, camping areas |
Understanding Airbnb License Requirements & STR Laws in Galveston (2026)
Yes, Galveston, Texas, United States enforces high STR regulations. Obtaining a license and ensuring compliance is almost certainly required according to current 2026 STR laws. Always verify the latest short term rental regulations and Airbnb license requirements directly with local government authorities for Galveston to ensure full compliance before hosting.
(Source: AirROI data, 2026, based on 92% licensed listings)
Top Performing Airbnb Properties in Galveston (2026)
Benchmark your potential! Explore examples of top-performing Airbnb properties in Galvestonbased on Trailing Twelve Month (TTM) revenue. Analyze their characteristics, revenue, occupancy rate, and ADR to understand what drives success in this market.
A Step Into Paradise - Gulf Oasis w/ Indoor Pool
Entire Place • 8 bedrooms

Beachfront-Swim Spa, Elevator, Golf Cart,Game Room
Entire Place • 5 bedrooms
The Shores at Galveston
Entire Place • 9 bedrooms

Fat Tuesday's
Entire Place • 5 bedrooms

Modern Coastal Home, Private Pool & Hot-Tub
Entire Place • 6 bedrooms

Beachfront Estate w/ Expansive Deck & Ocean Views
Entire Place • 8 bedrooms
Note: Performance varies based on location, size, amenities, seasonality, and management quality. Data reflects the past 12 months.
Top Performing Airbnb Hosts in Galveston (2026)
Learn from the best! This table showcases top-performing Airbnb hosts in Galveston based on the number of properties managed and estimated total revenue over the past year. Analyze their scale and performance metrics.
| Host Name | Properties | Grossing Revenue | Stay Reviews | Avg Rating |
|---|---|---|---|---|
| Ryson Vacation Rentals | 244 | $7,021,637 | 1900 | 4.34/5.0 |
| Evolve | 198 | $5,034,139 | 5506 | 4.62/5.0 |
| StayBeachBox Vacations | 68 | $3,832,072 | 4055 | 4.55/5.0 |
| Porter VRM Texas | 83 | $3,673,378 | 2432 | 4.60/5.0 |
| Jason And Danielle | 39 | $3,145,031 | 1289 | 4.97/5.0 |
| Ryson Vacation Rentals | 45 | $1,797,395 | 179 | 4.58/5.0 |
| Tyler | 30 | $1,604,998 | 1621 | 4.90/5.0 |
| Vacay Time | 37 | $1,565,626 | 667 | 4.75/5.0 |
| Natalie | 12 | $1,256,503 | 1072 | 4.53/5.0 |
| James & Mirna | 48 | $1,044,553 | 3920 | 4.70/5.0 |
Analyzing the strategies of top hosts, such as their property selection, pricing, and guest communication, can offer valuable lessons for optimizing your own Airbnb operations in Galveston.
Dive Deeper: Advanced Galveston STR Market Data (2026)
Ready to unlock more insights? AirROI provides access to advanced metrics and comprehensive Airbnb data for Galveston. Explore detailed analytics beyond this report to refine your investment strategy, optimize pricing, and maximize your vacation rental profits.
Explore Advanced MetricsGalveston Short-Term Rental Market Composition (2026): Property & Room Types
Room Type Distribution
Property Type Distribution
Market Composition Insights for Galveston
- The Galveston Airbnb market composition is heavily skewed towards Entire Home/Apt listings, which make up 98.2% of the 3,732 active rentals. This indicates strong guest preference for privacy and space.
- Looking at the property type distribution in Galveston, House properties are the most common (62%), reflecting the local real estate landscape.
- Houses represent a significant 62% portion, catering likely to families or larger groups.
- Smaller segments like hotel/boutique, others, outdoor/unique (combined 3.5%) offer potential for unique stay experiences.
Galveston Airbnb Room Capacity Analysis (2026): Bedroom Distribution
Distribution of Listings by Number of Bedrooms
Room Capacity Insights for Galveston
- The dominant room capacity in Galveston is 3 bedrooms listings, making up 28.2% of the market. This suggests a strong demand for properties suitable for families or small groups.
- Together, 3 bedrooms and 2 bedrooms properties represent 53.3% of the active Airbnb listings in Galveston, indicating a high concentration in these sizes.
- A significant 48.4% of listings offer 3+ bedrooms, catering to larger groups and families seeking more space in Galveston.
Galveston Vacation Rental Guest Capacity Trends (2026)
Distribution of Listings by Guest Capacity
Guest Capacity Insights for Galveston
- The most common guest capacity trend in Galveston vacation rentals is listings accommodating 8+ guests (46.9%). This suggests the primary traveler segment is likely larger groups.
- Properties designed for 8+ guests and 6 guests dominate the Galveston STR market, accounting for 71.1% of listings.
- 74.9% of properties accommodate 6+ guests, serving the market segment for larger families or group travel in Galveston.
- On average, properties in Galveston are equipped to host 6.4 guests.
Galveston Airbnb Booking Patterns (2026): Available vs. Booked Days
Available Days Distribution
Booked Days Distribution
Booking Pattern Insights for Galveston
- The most common availability pattern in Galveston falls within the 271-366 days range, representing 50.1% of listings. This suggests many properties have significant open periods on their calendars.
- Approximately 86.4% of listings show high availability (181+ days open annually), indicating potential for increased bookings or specific owner usage patterns.
- For booked days, the 91-180 days range is most frequent in Galveston (37.4%), reflecting common guest stay durations or potential owner blocking patterns.
- A notable 14.8% of properties secure long booking periods (181+ days booked per year), highlighting successful long-term rental strategies or significant owner usage.
Galveston Airbnb Minimum Stay Requirements Analysis
Distribution of Listings by Minimum Night Requirement
1 Night
655 listings
17.6% of total
2 Nights
1543 listings
41.3% of total
3 Nights
113 listings
3% of total
4-6 Nights
40 listings
1.1% of total
7-29 Nights
26 listings
0.7% of total
30+ Nights
1355 listings
36.3% of total
Key Insights
- The most prevalent minimum stay requirement in Galveston is 2 Nights, adopted by 41.3% of listings. This highlights the market's preference for shorter, flexible bookings.
- A significant segment (36.3%) caters to monthly stays (30+ nights) in Galveston, pointing to opportunities in the extended-stay market.
Recommendations
- Align with the market by considering a 2 Nights minimum stay, as 41.3% of Galveston hosts use this setting.
- If feasible, allowing 1-night stays, especially midweek or during low season, could capture last-minute bookings, as only 17.6% currently do.
- A 2-night minimum appears standard (41.3%). Consider this for weekends or peak periods.
- Explore offering discounts for stays of 30+ nights to attract the 36.3% of the market seeking extended stays.
- Adjust minimum nights based on seasonality – potentially shorter during low season and longer during peak demand periods in Galveston.
Galveston Airbnb Cancellation Policy Trends Analysis (2026)
Limited
115 listings
3.1% of total
Super Strict 60 Days
62 listings
1.7% of total
Super Strict 30 Days
147 listings
3.9% of total
Flexible
439 listings
11.8% of total
Moderate
874 listings
23.5% of total
Firm
1597 listings
42.9% of total
Strict
491 listings
13.2% of total
Cancellation Policy Insights for Galveston
- The prevailing Airbnb cancellation policy trend in Galveston is Firm, used by 42.9% of listings.
- A majority (56.1%) of hosts in Galveston utilize Firm or Strict policies, indicating a market where hosts prioritize booking security.
Recommendations for Hosts
- Consider adopting a Firm policy to align with the 42.9% market standard in Galveston.
- Using a Strict policy might deter some guests, as only 13.2% of listings use it. Evaluate if potential revenue protection outweighs possible lower booking rates.
- Regularly review your cancellation policy against competitors and market demand shifts in Galveston.
Galveston STR Booking Lead Time Analysis (2026)
Average Booking Lead Time by Month
Booking Lead Time Insights for Galveston
- The overall average booking lead time for vacation rentals in Galveston is 42 days.
- Guests book furthest in advance for stays during November (average 71 days), likely coinciding with peak travel demand or local events.
- The shortest booking windows occur for stays in March (average 33 days), indicating more last-minute travel plans during this time.
- Seasonally, Fall (50 days avg.) sees the longest lead times, while Spring (38 days avg.) has the shortest, reflecting typical travel planning cycles.
Recommendations for Hosts
- Use the overall average lead time (42 days) as a baseline for your pricing and availability strategy in Galveston.
- For November stays, consider implementing length-of-stay discounts or slightly higher rates for bookings made less than 71 days out to capitalize on advance planning.
- Target marketing efforts for the Fall season well in advance (at least 50 days) to capture early planners.
- Monitor your own booking lead times against these Galveston averages to identify opportunities for dynamic pricing adjustments.
Popular & Essential Airbnb Amenities in Galveston (2026)
Amenity Prevalence
Amenity Insights for Galveston
- Essential amenities in Galveston that guests expect include: Air conditioning, TV, Wifi, Smoke alarm, Coffee maker. Lacking these (any) could significantly impact bookings.
- Popular amenities like Kitchen, Refrigerator, Heating are common but not universal. Offering these can provide a competitive edge.
Recommendations for Hosts
- Ensure your listing includes all essential amenities for Galveston: Air conditioning, TV, Wifi, Smoke alarm, Coffee maker.
- Prioritize adding missing essentials: Air conditioning, TV, Wifi, Smoke alarm, Coffee maker.
- Consider adding popular differentiators like Kitchen or Refrigerator to increase appeal.
- Highlight unique or less common amenities you offer (e.g., hot tub, dedicated workspace, EV charger) in your listing description and photos.
- Regularly check competitor amenities in Galveston to stay competitive.
Galveston Airbnb Guest Demographics & Profile Analysis (2026)
Guest Profile Summary for Galveston
- The typical guest profile for Airbnb in Galveston consists of primarily domestic travelers (97%), often arriving from nearby Houston, typically belonging to the Post-2000s (Gen Z/Alpha) group (50%), primarily speaking English or Spanish.
- Domestic travelers account for 97.4% of guests.
- Key international markets include United States (97.4%) and Canada (0.7%).
- Top languages spoken are English (75%) followed by Spanish (16.2%).
- A significant demographic segment is the Post-2000s (Gen Z/Alpha) group, representing 50% of guests.
Recommendations for Hosts
- Target domestic marketing efforts towards travelers from Houston and Austin.
- Tailor amenities and listing descriptions to appeal to the dominant Post-2000s (Gen Z/Alpha) demographic (e.g., highlight fast WiFi, smart home features, local guides).
- Highlight unique local experiences or amenities relevant to the primary guest profile.
- Consider seasonal promotions aligned with peak travel times for key origin markets.
Nearby Short-Term Rental Market Comparison
How does the Galveston Airbnb market stack up against its neighbors? Compare key performance metrics like average monthly revenue, ADR, and occupancy rates in surrounding areas to understand the broader regional STR landscape.
| Market | Active Properties | Monthly Revenue | Daily Rate | Avg. Occupancy |
|---|---|---|---|---|
| Fairfield | 10 | $4,761 | $360.96 | 42% |
| Jamaica Beach | 199 | $3,774 | $394.20 | 37% |
| Crystal Beach | 143 | $3,768 | $408.48 | 35% |
| Bolivar Peninsula | 913 | $3,311 | $396.49 | 34% |
| Deer Park | 14 | $3,208 | $228.63 | 51% |
| Seabrook | 54 | $2,872 | $263.19 | 39% |
| Hackberry | 26 | $2,869 | $332.54 | 31% |
| Friendswood | 31 | $2,816 | $247.85 | 46% |
| Surfside Beach | 405 | $2,779 | $325.48 | 35% |
| Porter | 17 | $2,773 | $213.98 | 43% |