Frisco Airbnb Market Analysis 2026: Short Term Rental Data & Vacation Rental Statistics in Texas, United States
Is Airbnb profitable in Frisco in 2026? Explore comprehensive Airbnb analytics for Frisco, Texas, United States to uncover income potential. This 2026 STR market report for Frisco, based on AirROI data from February 2025 to January 2026, reveals key trends in the market of 390 active listings.
Whether you're considering an Airbnb investment in Frisco, optimizing your existing vacation rental, or exploring rental arbitrage opportunities, understanding the Frisco Airbnb data is crucial. Leveraging the low regulation environment is key to maximizing your short term rental income potential. Let's dive into the specifics.
Key Frisco Airbnb Performance Metrics Overview
Monthly Airbnb Revenue Variations & Income Potential in Frisco (2026)
Understanding the monthly revenue variations for Airbnb listings in Frisco is key to maximizing your short term rental income potential. Seasonality significantly impacts earnings. Our analysis, based on data from the past 12 months, shows that the peak revenue month for STRs in Frisco is typically October, while January often presents the lowest earnings, highlighting opportunities for strategic pricing adjustments during shoulder and low seasons. Explore the typical Airbnb income in Frisco across different performance tiers:
- Best-in-class properties (Top 10%) achieve $7,139+ monthly, often utilizing dynamic pricing and superior guest experiences.
- Strong performing properties (Top 25%) earn $4,672 or more, indicating effective management and desirable locations/amenities.
- Typical properties (Median) generate around $2,686 per month, representing the average market performance.
- Entry-level properties (Bottom 25%) see earnings around $1,261, often with potential for optimization.
Average Monthly Airbnb Earnings Trend in Frisco
Frisco Airbnb Occupancy Rate Trends (2026)
Maximize your bookings by understanding the Frisco STR occupancy trends. Seasonal demand shifts significantly influence how often properties are booked. Typically, Marchsees the highest demand (peak season occupancy), while January experiences the lowest (low season). Effective strategies, like adjusting minimum stays or offering promotions, can boost occupancy during slower periods. Here's how different property tiers perform in Frisco:
- Best-in-class properties (Top 10%) achieve 84%+ occupancy, indicating high desirability and potentially optimized availability.
- Strong performing properties (Top 25%) maintain 67% or higher occupancy, suggesting good market fit and guest satisfaction.
- Typical properties (Median) have an occupancy rate around 45%.
- Entry-level properties (Bottom 25%) average 23% occupancy, potentially facing higher vacancy.
Average Monthly Occupancy Rate Trend in Frisco
Average Daily Rate (ADR) Airbnb Trends in Frisco (2026)
Effective short term rental pricing strategy in Frisco involves understanding monthly ADR fluctuations. The Average Daily Rate (ADR) for Airbnb in Frisco typically peaks in November and dips lowest during February. Leveraging Airbnb dynamic pricing tools or strategies based on this seasonality can significantly boost revenue. Here's a look at the typical nightly rates achieved:
- Best-in-class properties (Top 10%) command rates of $375+ per night, often due to premium features or locations.
- Strong performing properties (Top 25%) achieve nightly rates of $282 or more.
- Typical properties (Median) charge around $196 per night.
- Entry-level properties (Bottom 25%) earn around $122 per night.
Average Daily Rate (ADR) Trend by Month in Frisco
Get Live Frisco Market Intelligence 👇

Explore Real-time Analytics
Airbnb Seasonality Analysis & Trends in Frisco (2026)
Peak Season (October, July, June)
- Revenue averages $4,129 per month
- Occupancy rates average 50.1%
- Daily rates average $235
Shoulder Season
- Revenue averages $3,622 per month
- Occupancy maintains around 45.8%
- Daily rates hold near $230
Low Season (January, February, April)
- Revenue drops to average $2,736 per month
- Occupancy decreases to average 42.2%
- Daily rates adjust to average $217
Seasonality Insights for Frisco
- The Airbnb seasonality in Frisco shows moderate seasonality with distinct peak and low periods. While the sections above show seasonal averages, it's also insightful to look at the extremes:
- During the high season, the absolute peak month showcases Frisco's highest earning potential, with monthly revenues capable of climbing to $4,209, occupancy reaching a high of 54.8%, and ADRs peaking at $244.
- Conversely, the slowest single month of the year, typically falling within the low season, marks the market's lowest point. In this month, revenue might dip to $2,377, occupancy could drop to 33.2%, and ADRs may adjust down to $211.
- Understanding both the seasonal averages and these monthly peaks and troughs in revenue, occupancy, and ADR is crucial for maximizing your Airbnb profit potential in Frisco.
Seasonal Strategies for Maximizing Profit
- Peak Season: Maximize revenue through premium pricing and potentially longer minimum stays. Ensure high availability.
- Low Season: Offer competitive pricing, special promotions (e.g., extended stay discounts), and flexible cancellation policies. Target off-season travelers like remote workers or budget-conscious guests.
- Shoulder Seasons: Implement dynamic pricing that balances peak and low rates. Target weekend travelers or specific events. Offer slightly more flexible terms than peak season.
- Regularly analyze your own performance against these Frisco seasonality benchmarks and adjust your pricing and availability strategy accordingly.
Best Areas for Airbnb Investment in Frisco (2026)
Exploring the top neighborhoods for short-term rentals in Frisco? This section highlights key areas, outlining why they are attractive for hosts and guests, along with notable local attractions. Consider these locations based on your target guest profile and investment strategy.
| Neighborhood / Area | Why Host Here? (Target Guests & Appeal) | Key Attractions & Landmarks |
|---|---|---|
| Frisco Square | A vibrant mixed-use development that offers restaurants, shopping, and entertainment. It's a lively area that attracts both locals and visitors, making it perfect for short-term rentals. | Dr Pepper Ballpark, Frisco Commons Park, Frisco Discovery Center, Restaurants and shops, The Star in Frisco |
| Stonebriar Centre | Frisco's premier shopping destination with a large mall and entertainment options. Popular with shoppers and families, making it a desirable area for Airbnb hosting. | Stonebriar Centre Mall, Restaurants, Bowling alleys, Movie theaters |
| The Star | This is the Dallas Cowboys' headquarters and a major attraction in Frisco. Ideal for sports fans and events, ensuring a steady flow of visitors. | Dallas Cowboys Headquarters, The Star District shops and restaurants, Training camp events, Live concerts |
| Legacy Business Park | A major business hub with numerous corporate offices, attracting business travelers. The area is ideal for those looking to cater to business guests. | Corporate headquarters, Nearby hotels and restaurants, Proximity to Legacy West |
| Frisco Lakes | A vibrant community with a strong focus on active lifestyles and amenities. An ideal area for hosting long-term stays for retirees or families. | Golf courses, Lake activities, Community events, Parks |
| Palmilla Beach | A resort-style location that offers a relaxing beach atmosphere, appealing to vacationers looking for a getaway. | Beaches, Golf courses, Dining options, Water sports |
| Wade Park | An upscale mixed-use community that includes luxury apartments, shopping, and entertainment options. Attractive to tourists and affluent visitors. | Shops, Dining, Entertainment venues, Luxury accommodations |
| Custer Road | A residential area with easy access to major attractions, making it a comfortable location for families and visitors to stay when exploring Frisco and nearby Dallas. | Parks, Schools, Residential amenities, Shopping centers |
Understanding Airbnb License Requirements & STR Laws in Frisco (2026)
While Frisco, Texas, United States currently shows low STR regulations, specific Airbnb license requirements might still exist or change. Always verify the latest short term rental regulations and Airbnb license requirements directly with local government authorities for Frisco to ensure full compliance before hosting.
(Source: AirROI data, 2026, based on 10% licensed listings)
Top Performing Airbnb Properties in Frisco (2026)
Benchmark your potential! Explore examples of top-performing Airbnb properties in Friscobased on Trailing Twelve Month (TTM) revenue. Analyze their characteristics, revenue, occupancy rate, and ADR to understand what drives success in this market.

Pool, Hot tub, Theater, Game Room, on Golf Course
Entire Place • 6 bedrooms

Frisco Diamond Estate Mansion
Entire Place • 12 bedrooms
The Palmera -Pool/Spa/Sauna/Skee Ball/Bowling
Entire Place • 4 bedrooms

Fabulously Frisco -5Bed/4Bath/HomeTheater/PingPong
Entire Place • 5 bedrooms
Modern & Upscale Frisco Getaway
Entire Place • 5 bedrooms
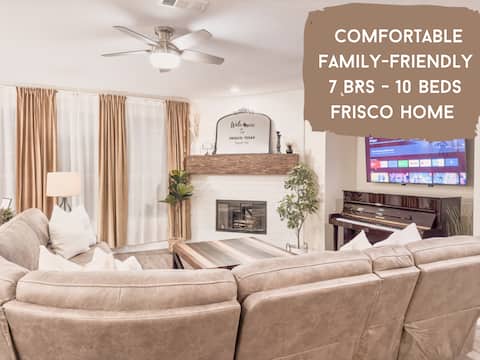
Modern Spacious 7 BR Movie, Game Room & King Beds
Entire Place • 7 bedrooms
Note: Performance varies based on location, size, amenities, seasonality, and management quality. Data reflects the past 12 months.
Top Performing Airbnb Hosts in Frisco (2026)
Learn from the best! This table showcases top-performing Airbnb hosts in Frisco based on the number of properties managed and estimated total revenue over the past year. Analyze their scale and performance metrics.
| Host Name | Properties | Grossing Revenue | Stay Reviews | Avg Rating |
|---|---|---|---|---|
| Matt | 19 | $381,902 | 166 | 4.46/5.0 |
| Diana | 2 | $350,482 | 273 | 4.98/5.0 |
| Wesley | 2 | $270,313 | 104 | 5.00/5.0 |
| R. Michael | 1 | $226,562 | 5 | 5.00/5.0 |
| Evolve | 5 | $210,588 | 119 | 4.77/5.0 |
| Jollin | 4 | $161,819 | 305 | 4.93/5.0 |
| Roy | 4 | $154,894 | 67 | 4.90/5.0 |
| Adrienne And Daniel | 1 | $139,258 | 5 | 5.00/5.0 |
| Patrick | 6 | $138,296 | 198 | 4.77/5.0 |
| Casavanaa | 7 | $133,114 | 119 | 4.63/5.0 |
Analyzing the strategies of top hosts, such as their property selection, pricing, and guest communication, can offer valuable lessons for optimizing your own Airbnb operations in Frisco.
Dive Deeper: Advanced Frisco STR Market Data (2026)
Ready to unlock more insights? AirROI provides access to advanced metrics and comprehensive Airbnb data for Frisco. Explore detailed analytics beyond this report to refine your investment strategy, optimize pricing, and maximize your vacation rental profits.
Explore Advanced MetricsFrisco Short-Term Rental Market Composition (2026): Property & Room Types
Room Type Distribution
Property Type Distribution
Market Composition Insights for Frisco
- The Frisco Airbnb market composition is heavily skewed towards Entire Home/Apt listings, which make up 85.4% of the 390 active rentals. This indicates strong guest preference for privacy and space.
- Looking at the property type distribution in Frisco, House properties are the most common (71.8%), reflecting the local real estate landscape.
- Houses represent a significant 71.8% portion, catering likely to families or larger groups.
- Smaller segments like hotel/boutique, others, unique stays, outdoor/unique (combined 3.4%) offer potential for unique stay experiences.
Frisco Airbnb Room Capacity Analysis (2026): Bedroom Distribution
Distribution of Listings by Number of Bedrooms
Room Capacity Insights for Frisco
- The dominant room capacity in Frisco is 3 bedrooms listings, making up 26.2% of the market. This suggests a strong demand for properties suitable for families or small groups.
- Together, 3 bedrooms and 1 bedroom properties represent 46.5% of the active Airbnb listings in Frisco, indicating a high concentration in these sizes.
- A significant 51.3% of listings offer 3+ bedrooms, catering to larger groups and families seeking more space in Frisco.
Frisco Vacation Rental Guest Capacity Trends (2026)
Distribution of Listings by Guest Capacity
Guest Capacity Insights for Frisco
- The most common guest capacity trend in Frisco vacation rentals is listings accommodating 8+ guests (37.4%). This suggests the primary traveler segment is likely larger groups.
- Properties designed for 8+ guests and 6 guests dominate the Frisco STR market, accounting for 51.8% of listings.
- 58.7% of properties accommodate 6+ guests, serving the market segment for larger families or group travel in Frisco.
- On average, properties in Frisco are equipped to host 5.3 guests.
Frisco Airbnb Booking Patterns (2026): Available vs. Booked Days
Available Days Distribution
Booked Days Distribution
Booking Pattern Insights for Frisco
- The most common availability pattern in Frisco falls within the 271-366 days range, representing 45.6% of listings. This suggests many properties have significant open periods on their calendars.
- Approximately 82.0% of listings show high availability (181+ days open annually), indicating potential for increased bookings or specific owner usage patterns.
- For booked days, the 91-180 days range is most frequent in Frisco (38.5%), reflecting common guest stay durations or potential owner blocking patterns.
- A notable 18.9% of properties secure long booking periods (181+ days booked per year), highlighting successful long-term rental strategies or significant owner usage.
Frisco Airbnb Minimum Stay Requirements Analysis
Distribution of Listings by Minimum Night Requirement
1 Night
80 listings
20.5% of total
2 Nights
112 listings
28.7% of total
3 Nights
16 listings
4.1% of total
4-6 Nights
21 listings
5.4% of total
7-29 Nights
34 listings
8.7% of total
30+ Nights
127 listings
32.6% of total
Key Insights
- The most prevalent minimum stay requirement in Frisco is 30+ Nights, adopted by 32.6% of listings. This highlights the market's preference for longer commitments.
- A significant segment (32.6%) caters to monthly stays (30+ nights) in Frisco, pointing to opportunities in the extended-stay market.
Recommendations
- Align with the market by considering a 30+ Nights minimum stay, as 32.6% of Frisco hosts use this setting.
- If feasible, allowing 1-night stays, especially midweek or during low season, could capture last-minute bookings, as only 20.5% currently do.
- Explore offering discounts for stays of 30+ nights to attract the 32.6% of the market seeking extended stays.
- Adjust minimum nights based on seasonality – potentially shorter during low season and longer during peak demand periods in Frisco.
Frisco Airbnb Cancellation Policy Trends Analysis (2026)
Limited
2 listings
0.5% of total
Super Strict 30 Days
6 listings
1.6% of total
Super Strict 60 Days
3 listings
0.8% of total
Flexible
59 listings
15.2% of total
Moderate
125 listings
32.3% of total
Firm
142 listings
36.7% of total
Strict
50 listings
12.9% of total
Cancellation Policy Insights for Frisco
- The prevailing Airbnb cancellation policy trend in Frisco is Firm, used by 36.7% of listings.
- There's a relatively balanced mix between guest-friendly (47.5%) and stricter (49.6%) policies, offering choices for different guest needs.
Recommendations for Hosts
- Consider adopting a Firm policy to align with the 36.7% market standard in Frisco.
- Using a Strict policy might deter some guests, as only 12.9% of listings use it. Evaluate if potential revenue protection outweighs possible lower booking rates.
- Regularly review your cancellation policy against competitors and market demand shifts in Frisco.
Frisco STR Booking Lead Time Analysis (2026)
Average Booking Lead Time by Month
Booking Lead Time Insights for Frisco
- The overall average booking lead time for vacation rentals in Frisco is 26 days.
- Guests book furthest in advance for stays during November (average 39 days), likely coinciding with peak travel demand or local events.
- The shortest booking windows occur for stays in January (average 22 days), indicating more last-minute travel plans during this time.
- Seasonally, Fall (33 days avg.) sees the longest lead times, while Winter (24 days avg.) has the shortest, reflecting typical travel planning cycles.
Recommendations for Hosts
- Use the overall average lead time (26 days) as a baseline for your pricing and availability strategy in Frisco.
- For November stays, consider implementing length-of-stay discounts or slightly higher rates for bookings made less than 39 days out to capitalize on advance planning.
- Target marketing efforts for the Fall season well in advance (at least 33 days) to capture early planners.
- Monitor your own booking lead times against these Frisco averages to identify opportunities for dynamic pricing adjustments.
Popular & Essential Airbnb Amenities in Frisco (2026)
Amenity Prevalence
Amenity Insights for Frisco
- Essential amenities in Frisco that guests expect include: Air conditioning, Wifi, Smoke alarm, Washer, Free parking on premises, Kitchen, TV. Lacking these (any) could significantly impact bookings.
- Popular amenities like Heating, Microwave, Hot water are common but not universal. Offering these can provide a competitive edge.
Recommendations for Hosts
- Ensure your listing includes all essential amenities for Frisco: Air conditioning, Wifi, Smoke alarm, Washer, Free parking on premises, Kitchen, TV.
- Prioritize adding missing essentials: Wifi, Smoke alarm, Washer, Free parking on premises, Kitchen, TV.
- Consider adding popular differentiators like Heating or Microwave to increase appeal.
- Highlight unique or less common amenities you offer (e.g., hot tub, dedicated workspace, EV charger) in your listing description and photos.
- Regularly check competitor amenities in Frisco to stay competitive.
Frisco Airbnb Guest Demographics & Profile Analysis (2026)
Guest Profile Summary for Frisco
- The typical guest profile for Airbnb in Frisco consists of primarily domestic travelers (94%), often arriving from nearby Dallas, typically belonging to the Post-2000s (Gen Z/Alpha) group (50%), primarily speaking English or Spanish.
- Domestic travelers account for 94.1% of guests.
- Key international markets include United States (94.1%) and Canada (1.4%).
- Top languages spoken are English (71.8%) followed by Spanish (12.4%).
- A significant demographic segment is the Post-2000s (Gen Z/Alpha) group, representing 50% of guests.
Recommendations for Hosts
- Target domestic marketing efforts towards travelers from Dallas and Austin.
- Tailor amenities and listing descriptions to appeal to the dominant Post-2000s (Gen Z/Alpha) demographic (e.g., highlight fast WiFi, smart home features, local guides).
- Highlight unique local experiences or amenities relevant to the primary guest profile.
- Consider seasonal promotions aligned with peak travel times for key origin markets.
Nearby Short-Term Rental Market Comparison
How does the Frisco Airbnb market stack up against its neighbors? Compare key performance metrics like average monthly revenue, ADR, and occupancy rates in surrounding areas to understand the broader regional STR landscape.
| Market | Active Properties | Monthly Revenue | Daily Rate | Avg. Occupancy |
|---|---|---|---|---|
| Star Harbor | 11 | $5,474 | $741.72 | 33% |
| Valley View | 25 | $5,111 | $484.73 | 39% |
| Bluff Dale | 18 | $4,063 | $411.68 | 29% |
| Red Oak | 17 | $3,978 | $288.35 | 50% |
| DeSoto | 29 | $3,947 | $332.58 | 47% |
| Holly Lake Ranch | 11 | $3,836 | $358.93 | 36% |
| Flower Mound | 79 | $3,760 | $326.24 | 45% |
| Wilburton | 16 | $3,710 | $294.70 | 39% |
| Azle | 62 | $3,533 | $323.80 | 41% |
| Westworth Village | 11 | $3,530 | $240.30 | 48% |