Dickinson Airbnb Market Analysis 2025: Short Term Rental Data & Vacation Rental Statistics in Texas, United States
Is Airbnb profitable in Dickinson in 2025? Explore comprehensive Airbnb analytics for Dickinson, Texas, United States to uncover income potential. This 2025 STR market report for Dickinson, based on AirROI data from December 2024 to November 2025, reveals key trends in the niche market of 24 active listings.
Whether you're considering an Airbnb investment in Dickinson, optimizing your existing vacation rental, or exploring rental arbitrage opportunities, understanding the Dickinson Airbnb data is crucial. Leveraging the low regulation environment is key to maximizing your short term rental income potential. Let's dive into the specifics.
Key Dickinson Airbnb Performance Metrics Overview
Monthly Airbnb Revenue Variations & Income Potential in Dickinson (2025)
Understanding the monthly revenue variations for Airbnb listings in Dickinson is key to maximizing your short term rental income potential. Seasonality significantly impacts earnings. Our analysis, based on data from the past 12 months, shows that the peak revenue month for STRs in Dickinson is typically July, while September often presents the lowest earnings, highlighting opportunities for strategic pricing adjustments during shoulder and low seasons. Explore the typical Airbnb income in Dickinson across different performance tiers:
- Best-in-class properties (Top 10%) achieve $6,929+ monthly, often utilizing dynamic pricing and superior guest experiences.
- Strong performing properties (Top 25%) earn $3,993 or more, indicating effective management and desirable locations/amenities.
- Typical properties (Median) generate around $2,255 per month, representing the average market performance.
- Entry-level properties (Bottom 25%) see earnings around $1,031, often with potential for optimization.
Average Monthly Airbnb Earnings Trend in Dickinson
Dickinson Airbnb Occupancy Rate Trends (2025)
Maximize your bookings by understanding the Dickinson STR occupancy trends. Seasonal demand shifts significantly influence how often properties are booked. Typically, Junesees the highest demand (peak season occupancy), while August experiences the lowest (low season). Effective strategies, like adjusting minimum stays or offering promotions, can boost occupancy during slower periods. Here's how different property tiers perform in Dickinson:
- Best-in-class properties (Top 10%) achieve 76%+ occupancy, indicating high desirability and potentially optimized availability.
- Strong performing properties (Top 25%) maintain 60% or higher occupancy, suggesting good market fit and guest satisfaction.
- Typical properties (Median) have an occupancy rate around 44%.
- Entry-level properties (Bottom 25%) average 27% occupancy, potentially facing higher vacancy.
Average Monthly Occupancy Rate Trend in Dickinson
Average Daily Rate (ADR) Airbnb Trends in Dickinson (2025)
Effective short term rental pricing strategy in Dickinson involves understanding monthly ADR fluctuations. The Average Daily Rate (ADR) for Airbnb in Dickinson typically peaks in July and dips lowest during January. Leveraging Airbnb dynamic pricing tools or strategies based on this seasonality can significantly boost revenue. Here's a look at the typical nightly rates achieved:
- Best-in-class properties (Top 10%) command rates of $418+ per night, often due to premium features or locations.
- Strong performing properties (Top 25%) achieve nightly rates of $328 or more.
- Typical properties (Median) charge around $205 per night.
- Entry-level properties (Bottom 25%) earn around $130 per night.
Average Daily Rate (ADR) Trend by Month in Dickinson
Get Live Dickinson Market Intelligence 👇

Explore Real-time Analytics
Airbnb Seasonality Analysis & Trends in Dickinson (2025)
Peak Season (July, June, March)
- Revenue averages $4,311 per month
- Occupancy rates average 52.9%
- Daily rates average $268
Shoulder Season
- Revenue averages $2,682 per month
- Occupancy maintains around 43.3%
- Daily rates hold near $256
Low Season (January, September, November)
- Revenue drops to average $2,246 per month
- Occupancy decreases to average 39.2%
- Daily rates adjust to average $254
Seasonality Insights for Dickinson
- The Airbnb seasonality in Dickinson shows highly seasonal trends requiring careful strategy. While the sections above show seasonal averages, it's also insightful to look at the extremes:
- During the high season, the absolute peak month showcases Dickinson's highest earning potential, with monthly revenues capable of climbing to $4,885, occupancy reaching a high of 56.1%, and ADRs peaking at $273.
- Conversely, the slowest single month of the year, typically falling within the low season, marks the market's lowest point. In this month, revenue might dip to $2,153, occupancy could drop to 34.3%, and ADRs may adjust down to $247.
- Understanding both the seasonal averages and these monthly peaks and troughs in revenue, occupancy, and ADR is crucial for maximizing your Airbnb profit potential in Dickinson.
Seasonal Strategies for Maximizing Profit
- Peak Season: Maximize revenue through premium pricing and potentially longer minimum stays. Ensure high availability.
- Low Season: Offer competitive pricing, special promotions (e.g., extended stay discounts), and flexible cancellation policies. Target off-season travelers like remote workers or budget-conscious guests.
- Shoulder Seasons: Implement dynamic pricing that balances peak and low rates. Target weekend travelers or specific events. Offer slightly more flexible terms than peak season.
- Regularly analyze your own performance against these Dickinson seasonality benchmarks and adjust your pricing and availability strategy accordingly.
Best Areas for Airbnb Investment in Dickinson (2025)
Exploring the top neighborhoods for short-term rentals in Dickinson? This section highlights key areas, outlining why they are attractive for hosts and guests, along with notable local attractions. Consider these locations based on your target guest profile and investment strategy.
| Neighborhood / Area | Why Host Here? (Target Guests & Appeal) | Key Attractions & Landmarks |
|---|---|---|
| Downtown Dickinson | A growing hub for dining and entertainment, ideal for travelers looking to explore local cuisine and culture. | Dickinson Historical Society, Bay Colony Park, Huckleberry Park, The Beacon, Local Restaurants |
| Bayou Wildlife Park | A unique location for families and nature lovers, offering a one-of-a-kind wildlife experience. | Bayou Wildlife Park, Petting Zoo, Wildlife Tours |
| Dickinson City Park | A favorite spot for outdoor activities, attracting families and sports enthusiasts. | City Park Walking Trails, Playgrounds, Picnic Areas, Sporting Facilities |
| Galveston Bay | Close proximity to Galveston and its beaches, attracting many tourists looking for beach activities and water sports. | Galveston Island, Moody Gardens, Beach Access, Watersports |
| Houston Space Center | Attracts those interested in space exploration and science, making it a great destination for tourists. | Space Center Houston, NASA Tours |
| Local Wineries | Situated in the Texas wine country, appealing to wine enthusiasts and those looking for unique local experiences. | Wine Tastings, Vineyard Tours |
| Shopping Districts | Offers a variety of shopping experiences from local shops to larger retail centers, perfect for shoppers. | Local Shops, Retail Centers, Farmers Markets |
| Crosby Park | A peaceful retreat with nature trails and scenic views, great for those looking for relaxation and outdoor fun. | Nature Trails, Fishing Areas, Bird Watching |
Understanding Airbnb License Requirements & STR Laws in Dickinson (2025)
While Dickinson, Texas, United States currently shows low STR regulations, specific Airbnb license requirements might still exist or change. Always verify the latest short term rental regulations and Airbnb license requirements directly with local government authorities for Dickinson to ensure full compliance before hosting.
(Source: AirROI data, 2025, based on 4% licensed listings)
Top Performing Airbnb Properties in Dickinson (2025)
Benchmark your potential! Explore examples of top-performing Airbnb properties in Dickinsonbased on Trailing Twelve Month (TTM) revenue. Analyze their characteristics, revenue, occupancy rate, and ADR to understand what drives success in this market.

Cozy Beachcity home*4Brs*pool*12 Beds*Mini Golf
Entire Place • 4 bedrooms

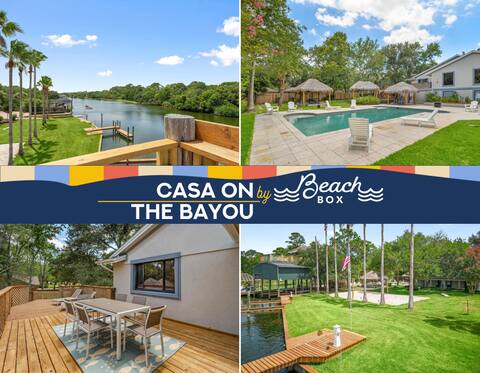
Lakefront Retreat Getaway Gameroom Firepit Fishing
Entire Place • 5 bedrooms
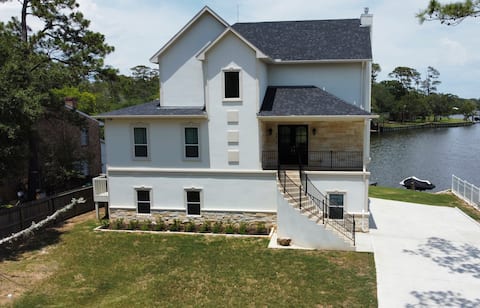
Waterfront Retreat Getaway Gameroom FirepitFishing
Entire Place • 4 bedrooms

Cheerful 3 bedroom home with loft
Entire Place • 3 bedrooms
Waterfront Oasis w/ Pool & Volleyball Court
Entire Place • 7 bedrooms
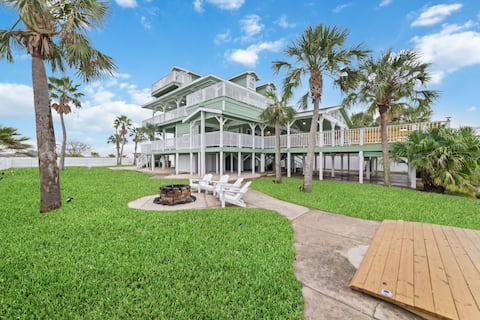
Escape Summer w/ Backyard, BBQ, Fishing & Crabbing
Entire Place • 5 bedrooms
Note: Performance varies based on location, size, amenities, seasonality, and management quality. Data reflects the past 12 months.
Top Performing Airbnb Hosts in Dickinson (2025)
Learn from the best! This table showcases top-performing Airbnb hosts in Dickinson based on the number of properties managed and estimated total revenue over the past year. Analyze their scale and performance metrics.
| Host Name | Properties | Grossing Revenue | Stay Reviews | Avg Rating |
|---|---|---|---|---|
| Eddie | 2 | $141,781 | 245 | 4.91/5.0 |
| Helen | 1 | $79,784 | 52 | 4.54/5.0 |
| Jason | 1 | $48,261 | 136 | 4.90/5.0 |
| Chris | 1 | $38,346 | 11 | 4.00/5.0 |
| Trang | 1 | $38,083 | 27 | 4.81/5.0 |
| Yong | 1 | $33,725 | 85 | 4.85/5.0 |
| George | 1 | $33,457 | 177 | 4.86/5.0 |
| Peggy | 1 | $30,007 | 40 | 4.98/5.0 |
| Ivan | 1 | $26,470 | 112 | 4.95/5.0 |
| Kenny | 1 | $26,047 | 19 | 4.84/5.0 |
Analyzing the strategies of top hosts, such as their property selection, pricing, and guest communication, can offer valuable lessons for optimizing your own Airbnb operations in Dickinson.
Dive Deeper: Advanced Dickinson STR Market Data (2025)
Ready to unlock more insights? AirROI provides access to advanced metrics and comprehensive Airbnb data for Dickinson. Explore detailed analytics beyond this report to refine your investment strategy, optimize pricing, and maximize your vacation rental profits.
Explore Advanced MetricsDickinson Short-Term Rental Market Composition (2025): Property & Room Types
Room Type Distribution
Property Type Distribution
Market Composition Insights for Dickinson
- The Dickinson Airbnb market composition is heavily skewed towards Entire Home/Apt listings, which make up 87.5% of the 24 active rentals. This indicates strong guest preference for privacy and space.
- Looking at the property type distribution in Dickinson, House properties are the most common (79.2%), reflecting the local real estate landscape.
- Houses represent a significant 79.2% portion, catering likely to families or larger groups.
- The presence of 12.5% Hotel/Boutique listings indicates integration with traditional hospitality.
- Smaller segments like others, outdoor/unique (combined 8.4%) offer potential for unique stay experiences.
Dickinson Airbnb Room Capacity Analysis (2025): Bedroom Distribution
Distribution of Listings by Number of Bedrooms
Room Capacity Insights for Dickinson
- The dominant room capacity in Dickinson is 4 bedrooms listings, making up 25% of the market. This suggests a strong demand for properties suitable for families or small groups.
- Together, 4 bedrooms and 3 bedrooms properties represent 50.0% of the active Airbnb listings in Dickinson, indicating a high concentration in these sizes.
- A significant 62.5% of listings offer 3+ bedrooms, catering to larger groups and families seeking more space in Dickinson.
Dickinson Vacation Rental Guest Capacity Trends (2025)
Distribution of Listings by Guest Capacity
Guest Capacity Insights for Dickinson
- The most common guest capacity trend in Dickinson vacation rentals is listings accommodating 8+ guests (41.7%). This suggests the primary traveler segment is likely larger groups.
- Properties designed for 8+ guests and 6 guests dominate the Dickinson STR market, accounting for 54.2% of listings.
- 62.5% of properties accommodate 6+ guests, serving the market segment for larger families or group travel in Dickinson.
- On average, properties in Dickinson are equipped to host 5.6 guests.
Dickinson Airbnb Booking Patterns (2025): Available vs. Booked Days
Available Days Distribution
Booked Days Distribution
Booking Pattern Insights for Dickinson
- The most common availability pattern in Dickinson falls within the 271-366 days range, representing 41.7% of listings. This suggests many properties have significant open periods on their calendars.
- Approximately 83.4% of listings show high availability (181+ days open annually), indicating potential for increased bookings or specific owner usage patterns.
- For booked days, the 91-180 days range is most frequent in Dickinson (41.7%), reflecting common guest stay durations or potential owner blocking patterns.
- A notable 16.7% of properties secure long booking periods (181+ days booked per year), highlighting successful long-term rental strategies or significant owner usage.
Dickinson Airbnb Minimum Stay Requirements Analysis
Distribution of Listings by Minimum Night Requirement
1 Night
7 listings
29.2% of total
2 Nights
6 listings
25% of total
3 Nights
2 listings
8.3% of total
30+ Nights
9 listings
37.5% of total
Key Insights
- The most prevalent minimum stay requirement in Dickinson is 30+ Nights, adopted by 37.5% of listings. This highlights the market's preference for longer commitments.
- A significant segment (37.5%) caters to monthly stays (30+ nights) in Dickinson, pointing to opportunities in the extended-stay market.
Recommendations
- Align with the market by considering a 30+ Nights minimum stay, as 37.5% of Dickinson hosts use this setting.
- If feasible, allowing 1-night stays, especially midweek or during low season, could capture last-minute bookings, as only 29.2% currently do.
- Explore offering discounts for stays of 30+ nights to attract the 37.5% of the market seeking extended stays.
- Adjust minimum nights based on seasonality – potentially shorter during low season and longer during peak demand periods in Dickinson.
Dickinson Airbnb Cancellation Policy Trends Analysis (2025)
Flexible
8 listings
33.3% of total
Moderate
6 listings
25% of total
Firm
7 listings
29.2% of total
Strict
3 listings
12.5% of total
Cancellation Policy Insights for Dickinson
- The prevailing Airbnb cancellation policy trend in Dickinson is Flexible, used by 33.3% of listings.
- There's a relatively balanced mix between guest-friendly (58.3%) and stricter (41.7%) policies, offering choices for different guest needs.
Recommendations for Hosts
- Consider adopting a Flexible policy to align with the 33.3% market standard in Dickinson.
- Using a Strict policy might deter some guests, as only 12.5% of listings use it. Evaluate if potential revenue protection outweighs possible lower booking rates.
- Regularly review your cancellation policy against competitors and market demand shifts in Dickinson.
Dickinson STR Booking Lead Time Analysis (2025)
Average Booking Lead Time by Month
Booking Lead Time Insights for Dickinson
- The overall average booking lead time for vacation rentals in Dickinson is 27 days.
- Guests book furthest in advance for stays during July (average 39 days), likely coinciding with peak travel demand or local events.
- The shortest booking windows occur for stays in March (average 15 days), indicating more last-minute travel plans during this time.
- Seasonally, Fall (29 days avg.) sees the longest lead times, while Winter (24 days avg.) has the shortest, reflecting typical travel planning cycles.
Recommendations for Hosts
- Use the overall average lead time (27 days) as a baseline for your pricing and availability strategy in Dickinson.
- For July stays, consider implementing length-of-stay discounts or slightly higher rates for bookings made less than 39 days out to capitalize on advance planning.
- Target marketing efforts for the Fall season well in advance (at least 29 days) to capture early planners.
- Monitor your own booking lead times against these Dickinson averages to identify opportunities for dynamic pricing adjustments.
Popular & Essential Airbnb Amenities in Dickinson (2025)
Amenity Prevalence
Amenity Insights for Dickinson
- Essential amenities in Dickinson that guests expect include: Wifi, Heating, Free parking on premises, Air conditioning, Refrigerator, Essentials, TV. Lacking these (any) could significantly impact bookings.
- Popular amenities like Bed linens, Dishes and silverware, Hot water are common but not universal. Offering these can provide a competitive edge.
Recommendations for Hosts
- Ensure your listing includes all essential amenities for Dickinson: Wifi, Heating, Free parking on premises, Air conditioning, Refrigerator, Essentials, TV.
- Prioritize adding missing essentials: Refrigerator, Essentials, TV.
- Consider adding popular differentiators like Bed linens or Dishes and silverware to increase appeal.
- Highlight unique or less common amenities you offer (e.g., hot tub, dedicated workspace, EV charger) in your listing description and photos.
- Regularly check competitor amenities in Dickinson to stay competitive.
Dickinson Airbnb Guest Demographics & Profile Analysis (2025)
Guest Profile Summary for Dickinson
- The typical guest profile for Airbnb in Dickinson consists of primarily domestic travelers (98%), often arriving from nearby Houston, typically belonging to the Post-2000s (Gen Z/Alpha) group (50%), primarily speaking English or Spanish.
- Domestic travelers account for 97.7% of guests.
- Key international markets include United States (97.7%) and Canada (0.5%).
- Top languages spoken are English (75.6%) followed by Spanish (14.6%).
- A significant demographic segment is the Post-2000s (Gen Z/Alpha) group, representing 50% of guests.
Recommendations for Hosts
- Target domestic marketing efforts towards travelers from Houston and Dallas.
- Tailor amenities and listing descriptions to appeal to the dominant Post-2000s (Gen Z/Alpha) demographic (e.g., highlight fast WiFi, smart home features, local guides).
- Highlight unique local experiences or amenities relevant to the primary guest profile.
- Consider seasonal promotions aligned with peak travel times for key origin markets.
Nearby Short-Term Rental Market Comparison
How does the Dickinson Airbnb market stack up against its neighbors? Compare key performance metrics like average monthly revenue, ADR, and occupancy rates in surrounding areas to understand the broader regional STR landscape.
| Market | Active Properties | Monthly Revenue | Daily Rate | Avg. Occupancy |
|---|---|---|---|---|
| Midfield | 10 | $4,652 | $549.07 | 23% |
| Fairfield | 11 | $4,470 | $355.96 | 42% |
| Jamaica Beach | 194 | $3,977 | $402.10 | 37% |
| Crystal Beach | 144 | $3,829 | $408.06 | 34% |
| Bolivar Peninsula | 883 | $3,488 | $405.24 | 34% |
| Deer Park | 13 | $3,402 | $236.91 | 51% |
| Columbus | 18 | $3,309 | $429.36 | 33% |
| Chappell Hill | 11 | $2,982 | $520.11 | 31% |
| Friendswood | 32 | $2,978 | $253.88 | 47% |
| Franklin | 11 | $2,965 | $307.47 | 40% |