Denton Airbnb Market Analysis 2026: Short Term Rental Data & Vacation Rental Statistics in Texas, United States
Is Airbnb profitable in Denton in 2026? Explore comprehensive Airbnb analytics for Denton, Texas, United States to uncover income potential. This 2026 STR market report for Denton, based on AirROI data from February 2025 to January 2026, reveals key trends in the market of 251 active listings.
Whether you're considering an Airbnb investment in Denton, optimizing your existing vacation rental, or exploring rental arbitrage opportunities, understanding the Denton Airbnb data is crucial. Leveraging the low regulation environment is key to maximizing your short term rental income potential. Let's dive into the specifics.
Key Denton Airbnb Performance Metrics Overview
Monthly Airbnb Revenue Variations & Income Potential in Denton (2026)
Understanding the monthly revenue variations for Airbnb listings in Denton is key to maximizing your short term rental income potential. Seasonality significantly impacts earnings. Our analysis, based on data from the past 12 months, shows that the peak revenue month for STRs in Denton is typically October, while January often presents the lowest earnings, highlighting opportunities for strategic pricing adjustments during shoulder and low seasons. Explore the typical Airbnb income in Denton across different performance tiers:
- Best-in-class properties (Top 10%) achieve $5,109+ monthly, often utilizing dynamic pricing and superior guest experiences.
- Strong performing properties (Top 25%) earn $3,219 or more, indicating effective management and desirable locations/amenities.
- Typical properties (Median) generate around $1,820 per month, representing the average market performance.
- Entry-level properties (Bottom 25%) see earnings around $841, often with potential for optimization.
Average Monthly Airbnb Earnings Trend in Denton
Denton Airbnb Occupancy Rate Trends (2026)
Maximize your bookings by understanding the Denton STR occupancy trends. Seasonal demand shifts significantly influence how often properties are booked. Typically, Marchsees the highest demand (peak season occupancy), while January experiences the lowest (low season). Effective strategies, like adjusting minimum stays or offering promotions, can boost occupancy during slower periods. Here's how different property tiers perform in Denton:
- Best-in-class properties (Top 10%) achieve 79%+ occupancy, indicating high desirability and potentially optimized availability.
- Strong performing properties (Top 25%) maintain 64% or higher occupancy, suggesting good market fit and guest satisfaction.
- Typical properties (Median) have an occupancy rate around 45%.
- Entry-level properties (Bottom 25%) average 26% occupancy, potentially facing higher vacancy.
Average Monthly Occupancy Rate Trend in Denton
Average Daily Rate (ADR) Airbnb Trends in Denton (2026)
Effective short term rental pricing strategy in Denton involves understanding monthly ADR fluctuations. The Average Daily Rate (ADR) for Airbnb in Denton typically peaks in November and dips lowest during February. Leveraging Airbnb dynamic pricing tools or strategies based on this seasonality can significantly boost revenue. Here's a look at the typical nightly rates achieved:
- Best-in-class properties (Top 10%) command rates of $275+ per night, often due to premium features or locations.
- Strong performing properties (Top 25%) achieve nightly rates of $194 or more.
- Typical properties (Median) charge around $126 per night.
- Entry-level properties (Bottom 25%) earn around $73 per night.
Average Daily Rate (ADR) Trend by Month in Denton
Get Live Denton Market Intelligence 👇

Explore Real-time Analytics
Airbnb Seasonality Analysis & Trends in Denton (2026)
Peak Season (October, July, March)
- Revenue averages $2,658 per month
- Occupancy rates average 50.9%
- Daily rates average $155
Shoulder Season
- Revenue averages $2,479 per month
- Occupancy maintains around 45.5%
- Daily rates hold near $161
Low Season (January, February, April)
- Revenue drops to average $1,996 per month
- Occupancy decreases to average 40.8%
- Daily rates adjust to average $147
Seasonality Insights for Denton
- The Airbnb seasonality in Denton shows moderate seasonality with distinct peak and low periods. While the sections above show seasonal averages, it's also insightful to look at the extremes:
- During the high season, the absolute peak month showcases Denton's highest earning potential, with monthly revenues capable of climbing to $2,667, occupancy reaching a high of 53.7%, and ADRs peaking at $171.
- Conversely, the slowest single month of the year, typically falling within the low season, marks the market's lowest point. In this month, revenue might dip to $1,736, occupancy could drop to 30.5%, and ADRs may adjust down to $140.
- Understanding both the seasonal averages and these monthly peaks and troughs in revenue, occupancy, and ADR is crucial for maximizing your Airbnb profit potential in Denton.
Seasonal Strategies for Maximizing Profit
- Peak Season: Maximize revenue through premium pricing and potentially longer minimum stays. Ensure high availability.
- Low Season: Offer competitive pricing, special promotions (e.g., extended stay discounts), and flexible cancellation policies. Target off-season travelers like remote workers or budget-conscious guests.
- Shoulder Seasons: Implement dynamic pricing that balances peak and low rates. Target weekend travelers or specific events. Offer slightly more flexible terms than peak season.
- Regularly analyze your own performance against these Denton seasonality benchmarks and adjust your pricing and availability strategy accordingly.
Best Areas for Airbnb Investment in Denton (2026)
Exploring the top neighborhoods for short-term rentals in Denton? This section highlights key areas, outlining why they are attractive for hosts and guests, along with notable local attractions. Consider these locations based on your target guest profile and investment strategy.
| Neighborhood / Area | Why Host Here? (Target Guests & Appeal) | Key Attractions & Landmarks |
|---|---|---|
| University of North Texas | A vibrant area that attracts students, faculty, and visitors to events. It's ideal for short-term rentals due to the constant influx of visitors. | University of North Texas, Apogee Stadium, UNT Art Gallery, The Texas Fashion Collection |
| Denton Square | The historic downtown area filled with charming shops, restaurants, and entertainment venues. It's a cultural hub that draws tourists and locals alike. | Denton County Courthouse, Oak Street, Local shops and cafes, Music venues, Festivals and events |
| Golden Triangle Mall | A shopping and entertainment district that attracts visitors looking for dining and leisure activities. Great for families and shoppers. | Golden Triangle Mall, Cinemark movie theater, Restaurants, Shopping |
| South Denton | A growing residential area that offers proximity to parks and community activities. Ideal for those visiting friends or family in the area. | Parks and recreational areas, Community events, Family-friendly attractions |
| North Lakes Park | A beautiful park area that offers natural beauty and recreational opportunities. Attracts those seeking outdoor activities and relaxation. | North Lakes Park, Lake access, Trails and picnic areas |
| Denton Arts District | Known for its cultural and artistic community. Perfect for those who appreciate local art, music, and culture. | Denton Community Theatre, Art galleries, Live music, Art festivals |
| Rayzor Ranch | A new development area with shops and restaurants. Appeals to visitors seeking modern amenities in a convenient location. | Shopping centers, Restaurants, Entertainment options |
| Ponder, TX (near Denton) | A small town atmosphere that offers a unique experience for guests looking for peace and quiet while still being close to city amenities. | Parks and natural scenery, Small town charm, Local dining |
Understanding Airbnb License Requirements & STR Laws in Denton (2026)
While Denton, Texas, United States currently shows low STR regulations, specific Airbnb license requirements might still exist or change. Always verify the latest short term rental regulations and Airbnb license requirements directly with local government authorities for Denton to ensure full compliance before hosting.
(Source: AirROI data, 2026, finding no licensed listings among those analyzed)
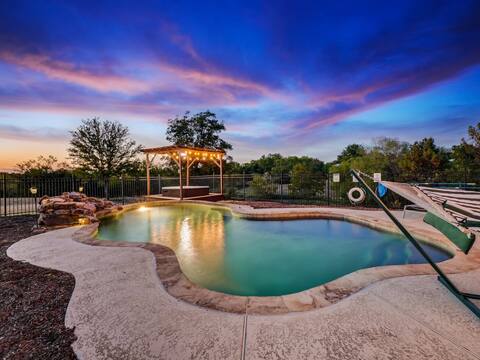
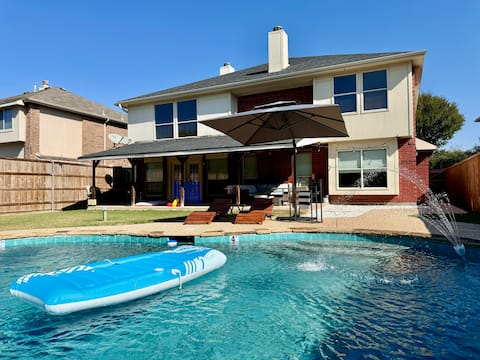
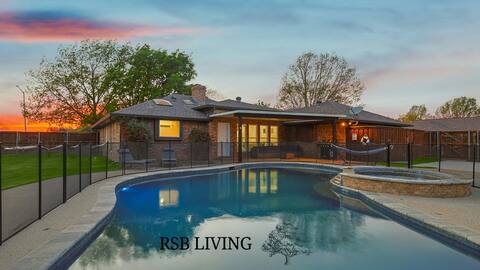
Top Performing Airbnb Properties in Denton (2026)
Benchmark your potential! Explore examples of top-performing Airbnb properties in Dentonbased on Trailing Twelve Month (TTM) revenue. Analyze their characteristics, revenue, occupancy rate, and ADR to understand what drives success in this market.

Lakefront Resort|Sleeps 16|Pool Hot Tub Game Room
Entire Place • 4 bedrooms
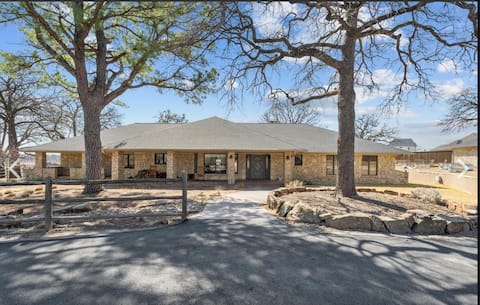
True Ranch House on 15 acres Tranquil in DFW
Entire Place • 5 bedrooms
Modern Home - 1 Acre Lot w/ Pool, Patios, Jacuzzi
Entire Place • 4 bedrooms
Massive 6BR Home | Near Denton, UNT & Lake Fun!
Entire Place • 6 bedrooms

Private Ranch Retreat with Pool & Hot Tub
Entire Place • 4 bedrooms
Gorgeous 4BR Home with Huge Yard, Pool
Entire Place • 4 bedrooms
Note: Performance varies based on location, size, amenities, seasonality, and management quality. Data reflects the past 12 months.
Top Performing Airbnb Hosts in Denton (2026)
Learn from the best! This table showcases top-performing Airbnb hosts in Denton based on the number of properties managed and estimated total revenue over the past year. Analyze their scale and performance metrics.
| Host Name | Properties | Grossing Revenue | Stay Reviews | Avg Rating |
|---|---|---|---|---|
| Cecilia | 6 | $210,728 | 987 | 4.80/5.0 |
| Breanne | 1 | $154,140 | 121 | 4.86/5.0 |
| Shannon | 2 | $145,138 | 30 | 5.00/5.0 |
| Branson Vacation Retreats | 2 | $133,162 | 210 | 4.93/5.0 |
| Aaron And Tiffany | 6 | $132,104 | 328 | 4.88/5.0 |
| Emily | 2 | $116,318 | 146 | 4.93/5.0 |
| Ryan | 3 | $114,677 | 378 | 4.83/5.0 |
| Melinda | 5 | $114,337 | 348 | 4.81/5.0 |
| Nate | 2 | $112,859 | 351 | 4.89/5.0 |
| RSB Living | 2 | $103,860 | 52 | 4.71/5.0 |
Analyzing the strategies of top hosts, such as their property selection, pricing, and guest communication, can offer valuable lessons for optimizing your own Airbnb operations in Denton.
Dive Deeper: Advanced Denton STR Market Data (2026)
Ready to unlock more insights? AirROI provides access to advanced metrics and comprehensive Airbnb data for Denton. Explore detailed analytics beyond this report to refine your investment strategy, optimize pricing, and maximize your vacation rental profits.
Explore Advanced MetricsDenton Short-Term Rental Market Composition (2026): Property & Room Types
Room Type Distribution
Property Type Distribution
Market Composition Insights for Denton
- The Denton Airbnb market composition is heavily skewed towards Entire Home/Apt listings, which make up 75.7% of the 251 active rentals. This indicates strong guest preference for privacy and space.
- Looking at the property type distribution in Denton, House properties are the most common (63.3%), reflecting the local real estate landscape.
- Houses represent a significant 63.3% portion, catering likely to families or larger groups.
- The presence of 10% Hotel/Boutique listings indicates integration with traditional hospitality.
- Smaller segments like outdoor/unique, others, unique stays (combined 5.2%) offer potential for unique stay experiences.
Denton Airbnb Room Capacity Analysis (2026): Bedroom Distribution
Distribution of Listings by Number of Bedrooms
Room Capacity Insights for Denton
- The dominant room capacity in Denton is 1 bedroom listings, making up 28.7% of the market. This suggests a strong demand for properties suitable for couples or solo travelers.
- Together, 1 bedroom and 3 bedrooms properties represent 47.0% of the active Airbnb listings in Denton, indicating a high concentration in these sizes.
- A significant 32.3% of listings offer 3+ bedrooms, catering to larger groups and families seeking more space in Denton.
Denton Vacation Rental Guest Capacity Trends (2026)
Distribution of Listings by Guest Capacity
Guest Capacity Insights for Denton
- The most common guest capacity trend in Denton vacation rentals is listings accommodating 8+ guests (19.9%). This suggests the primary traveler segment is likely larger groups.
- Properties designed for 8+ guests and 2 guests dominate the Denton STR market, accounting for 37.8% of listings.
- 36.2% of properties accommodate 6+ guests, serving the market segment for larger families or group travel in Denton.
- On average, properties in Denton are equipped to host 3.8 guests.
Denton Airbnb Booking Patterns (2026): Available vs. Booked Days
Available Days Distribution
Booked Days Distribution
Booking Pattern Insights for Denton
- The most common availability pattern in Denton falls within the 181-270 days range, representing 39.4% of listings. This suggests many properties have significant open periods on their calendars.
- Approximately 72.5% of listings show high availability (181+ days open annually), indicating potential for increased bookings or specific owner usage patterns.
- For booked days, the 91-180 days range is most frequent in Denton (39.8%), reflecting common guest stay durations or potential owner blocking patterns.
- A notable 29.1% of properties secure long booking periods (181+ days booked per year), highlighting successful long-term rental strategies or significant owner usage.
Denton Airbnb Minimum Stay Requirements Analysis
Distribution of Listings by Minimum Night Requirement
1 Night
102 listings
40.6% of total
2 Nights
43 listings
17.1% of total
3 Nights
5 listings
2% of total
4-6 Nights
9 listings
3.6% of total
7-29 Nights
38 listings
15.1% of total
30+ Nights
54 listings
21.5% of total
Key Insights
- The most prevalent minimum stay requirement in Denton is 1 Night, adopted by 40.6% of listings. This highlights the market's preference for shorter, flexible bookings.
- A significant segment (21.5%) caters to monthly stays (30+ nights) in Denton, pointing to opportunities in the extended-stay market.
Recommendations
- Align with the market by considering a 1 Night minimum stay, as 40.6% of Denton hosts use this setting.
- Explore offering discounts for stays of 30+ nights to attract the 21.5% of the market seeking extended stays.
- Adjust minimum nights based on seasonality – potentially shorter during low season and longer during peak demand periods in Denton.
Denton Airbnb Cancellation Policy Trends Analysis (2026)
Limited
5 listings
2% of total
Super Strict 30 Days
2 listings
0.8% of total
Flexible
70 listings
27.9% of total
Moderate
70 listings
27.9% of total
Firm
73 listings
29.1% of total
Strict
31 listings
12.4% of total
Cancellation Policy Insights for Denton
- The prevailing Airbnb cancellation policy trend in Denton is Firm, used by 29.1% of listings.
- There's a relatively balanced mix between guest-friendly (55.8%) and stricter (41.5%) policies, offering choices for different guest needs.
Recommendations for Hosts
- Consider adopting a Firm policy to align with the 29.1% market standard in Denton.
- Using a Strict policy might deter some guests, as only 12.4% of listings use it. Evaluate if potential revenue protection outweighs possible lower booking rates.
- Regularly review your cancellation policy against competitors and market demand shifts in Denton.
Denton STR Booking Lead Time Analysis (2026)
Average Booking Lead Time by Month
Booking Lead Time Insights for Denton
- The overall average booking lead time for vacation rentals in Denton is 27 days.
- Guests book furthest in advance for stays during May (average 40 days), likely coinciding with peak travel demand or local events.
- The shortest booking windows occur for stays in February (average 18 days), indicating more last-minute travel plans during this time.
- Seasonally, Fall (32 days avg.) sees the longest lead times, while Winter (26 days avg.) has the shortest, reflecting typical travel planning cycles.
Recommendations for Hosts
- Use the overall average lead time (27 days) as a baseline for your pricing and availability strategy in Denton.
- For May stays, consider implementing length-of-stay discounts or slightly higher rates for bookings made less than 40 days out to capitalize on advance planning.
- Target marketing efforts for the Fall season well in advance (at least 32 days) to capture early planners.
- Monitor your own booking lead times against these Denton averages to identify opportunities for dynamic pricing adjustments.
Popular & Essential Airbnb Amenities in Denton (2026)
Amenity Prevalence
Amenity Insights for Denton
- Essential amenities in Denton that guests expect include: Air conditioning, Wifi, TV, Smoke alarm. Lacking these (any) could significantly impact bookings.
- Popular amenities like Free parking on premises, Heating, Hot water are common but not universal. Offering these can provide a competitive edge.
Recommendations for Hosts
- Ensure your listing includes all essential amenities for Denton: Air conditioning, Wifi, TV, Smoke alarm.
- Prioritize adding missing essentials: Air conditioning, Wifi, TV, Smoke alarm.
- Consider adding popular differentiators like Free parking on premises or Heating to increase appeal.
- Highlight unique or less common amenities you offer (e.g., hot tub, dedicated workspace, EV charger) in your listing description and photos.
- Regularly check competitor amenities in Denton to stay competitive.
Denton Airbnb Guest Demographics & Profile Analysis (2026)
Guest Profile Summary for Denton
- The typical guest profile for Airbnb in Denton consists of primarily domestic travelers (97%), often arriving from nearby Austin, typically belonging to the Post-2000s (Gen Z/Alpha) group (50%), primarily speaking English or Spanish.
- Domestic travelers account for 96.9% of guests.
- Key international markets include United States (96.9%) and United Kingdom (0.6%).
- Top languages spoken are English (67.8%) followed by Spanish (18.6%).
- A significant demographic segment is the Post-2000s (Gen Z/Alpha) group, representing 50% of guests.
Recommendations for Hosts
- Target domestic marketing efforts towards travelers from Austin and Houston.
- Tailor amenities and listing descriptions to appeal to the dominant Post-2000s (Gen Z/Alpha) demographic (e.g., highlight fast WiFi, smart home features, local guides).
- Highlight unique local experiences or amenities relevant to the primary guest profile.
- Consider seasonal promotions aligned with peak travel times for key origin markets.
Nearby Short-Term Rental Market Comparison
How does the Denton Airbnb market stack up against its neighbors? Compare key performance metrics like average monthly revenue, ADR, and occupancy rates in surrounding areas to understand the broader regional STR landscape.
| Market | Active Properties | Monthly Revenue | Daily Rate | Avg. Occupancy |
|---|---|---|---|---|
| Strawn | 27 | $8,233 | $847.64 | 34% |
| Star Harbor | 11 | $5,474 | $741.72 | 33% |
| Valley View | 25 | $5,111 | $484.73 | 39% |
| Bluff Dale | 18 | $4,063 | $411.68 | 29% |
| Red Oak | 17 | $3,978 | $288.35 | 50% |
| DeSoto | 29 | $3,947 | $332.58 | 47% |
| Flower Mound | 79 | $3,760 | $326.24 | 45% |
| Azle | 62 | $3,533 | $323.80 | 41% |
| Westworth Village | 11 | $3,530 | $240.30 | 48% |
| Highland Village | 15 | $3,363 | $345.42 | 48% |