Del Valle Airbnb Market Analysis 2026: Short Term Rental Data & Vacation Rental Statistics in Texas, United States
Is Airbnb profitable in Del Valle in 2026? Explore comprehensive Airbnb analytics for Del Valle, Texas, United States to uncover income potential. This 2026 STR market report for Del Valle, based on AirROI data from February 2025 to January 2026, reveals key trends in the niche market of 88 active listings.
Whether you're considering an Airbnb investment in Del Valle, optimizing your existing vacation rental, or exploring rental arbitrage opportunities, understanding the Del Valle Airbnb data is crucial. Leveraging the low regulation environment is key to maximizing your short term rental income potential. Let's dive into the specifics.
Key Del Valle Airbnb Performance Metrics Overview
Monthly Airbnb Revenue Variations & Income Potential in Del Valle (2026)
Understanding the monthly revenue variations for Airbnb listings in Del Valle is key to maximizing your short term rental income potential. Seasonality significantly impacts earnings. Our analysis, based on data from the past 12 months, shows that the peak revenue month for STRs in Del Valle is typically October, while January often presents the lowest earnings, highlighting opportunities for strategic pricing adjustments during shoulder and low seasons. Explore the typical Airbnb income in Del Valle across different performance tiers:
- Best-in-class properties (Top 10%) achieve $4,439+ monthly, often utilizing dynamic pricing and superior guest experiences.
- Strong performing properties (Top 25%) earn $3,150 or more, indicating effective management and desirable locations/amenities.
- Typical properties (Median) generate around $1,656 per month, representing the average market performance.
- Entry-level properties (Bottom 25%) see earnings around $805, often with potential for optimization.
Average Monthly Airbnb Earnings Trend in Del Valle
Del Valle Airbnb Occupancy Rate Trends (2026)
Maximize your bookings by understanding the Del Valle STR occupancy trends. Seasonal demand shifts significantly influence how often properties are booked. Typically, Marchsees the highest demand (peak season occupancy), while January experiences the lowest (low season). Effective strategies, like adjusting minimum stays or offering promotions, can boost occupancy during slower periods. Here's how different property tiers perform in Del Valle:
- Best-in-class properties (Top 10%) achieve 82%+ occupancy, indicating high desirability and potentially optimized availability.
- Strong performing properties (Top 25%) maintain 66% or higher occupancy, suggesting good market fit and guest satisfaction.
- Typical properties (Median) have an occupancy rate around 40%.
- Entry-level properties (Bottom 25%) average 18% occupancy, potentially facing higher vacancy.
Average Monthly Occupancy Rate Trend in Del Valle
Average Daily Rate (ADR) Airbnb Trends in Del Valle (2026)
Effective short term rental pricing strategy in Del Valle involves understanding monthly ADR fluctuations. The Average Daily Rate (ADR) for Airbnb in Del Valle typically peaks in October and dips lowest during February. Leveraging Airbnb dynamic pricing tools or strategies based on this seasonality can significantly boost revenue. Here's a look at the typical nightly rates achieved:
- Best-in-class properties (Top 10%) command rates of $306+ per night, often due to premium features or locations.
- Strong performing properties (Top 25%) achieve nightly rates of $208 or more.
- Typical properties (Median) charge around $134 per night.
- Entry-level properties (Bottom 25%) earn around $72 per night.
Average Daily Rate (ADR) Trend by Month in Del Valle
Get Live Del Valle Market Intelligence 👇

Explore Real-time Analytics
Airbnb Seasonality Analysis & Trends in Del Valle (2026)
Peak Season (October, March, December)
- Revenue averages $2,702 per month
- Occupancy rates average 46.6%
- Daily rates average $173
Shoulder Season
- Revenue averages $2,078 per month
- Occupancy maintains around 43.3%
- Daily rates hold near $157
Low Season (January, April, August)
- Revenue drops to average $1,706 per month
- Occupancy decreases to average 38.2%
- Daily rates adjust to average $155
Seasonality Insights for Del Valle
- The Airbnb seasonality in Del Valle shows moderate seasonality with distinct peak and low periods. While the sections above show seasonal averages, it's also insightful to look at the extremes:
- During the high season, the absolute peak month showcases Del Valle's highest earning potential, with monthly revenues capable of climbing to $2,955, occupancy reaching a high of 48.6%, and ADRs peaking at $199.
- Conversely, the slowest single month of the year, typically falling within the low season, marks the market's lowest point. In this month, revenue might dip to $1,489, occupancy could drop to 34.9%, and ADRs may adjust down to $146.
- Understanding both the seasonal averages and these monthly peaks and troughs in revenue, occupancy, and ADR is crucial for maximizing your Airbnb profit potential in Del Valle.
Seasonal Strategies for Maximizing Profit
- Peak Season: Maximize revenue through premium pricing and potentially longer minimum stays. Ensure high availability.
- Low Season: Offer competitive pricing, special promotions (e.g., extended stay discounts), and flexible cancellation policies. Target off-season travelers like remote workers or budget-conscious guests.
- Shoulder Seasons: Implement dynamic pricing that balances peak and low rates. Target weekend travelers or specific events. Offer slightly more flexible terms than peak season.
- Regularly analyze your own performance against these Del Valle seasonality benchmarks and adjust your pricing and availability strategy accordingly.
Best Areas for Airbnb Investment in Del Valle (2026)
Exploring the top neighborhoods for short-term rentals in Del Valle? This section highlights key areas, outlining why they are attractive for hosts and guests, along with notable local attractions. Consider these locations based on your target guest profile and investment strategy.
| Neighborhood / Area | Why Host Here? (Target Guests & Appeal) | Key Attractions & Landmarks |
|---|---|---|
| East Del Valle | A growing suburban area with easy access to Austin and the airport. Ideal for families and travelers looking for a peaceful stay close to the city. | Bastrop State Park, Del Valle High School Football Stadium, Luminations at Friend's Tree, Austin-Bergstrom International Airport, McKinney Falls State Park |
| Del Valle Lake | A picturesque area that attracts outdoor enthusiasts and nature lovers. Offers opportunities for water-related activities and relaxation by the water. | Del Valle Regional Park, Lake Walter E. Long, Fishing and boating activities, Scenic picnic areas, Nature trails |
| Mott's Park | A suburban neighborhood with family-friendly amenities. Convenient for those seeking community living while being near Austin's entertainment. | Mott's Park Playground, Community sports fields, Local dining options, Easy access to public transport, Proximity to Austin's attractions |
| Cota | Known for its close proximity to the Circuit of the Americas, a major venue for motorsports events. Perfect for race fans and event-goers. | Circuit of the Americas, Live music events, Motorsports activities, Outdoor activities in nearby parks, Camping opportunities |
| Sunset Valley | A charming area known for its boutique shopping and dining options. Attractive for visitors wanting a quieter atmosphere near South Austin. | Sunset Valley Shopping Center, Local restaurants, Art galleries, Nature trails nearby, Farmers Market |
| Barton Hills | An upscale neighborhood with a great balance of nature and urban living. Close to Zilker Park and downtown Austin, attracting outdoor lovers and city explorers alike. | Zilker Park, Barton Springs Pool, Lady Bird Lake, Austin City Limits Festival, Dining and nightlife on South Lamar |
| Hyde Park | A historic district with a vibrant cultural scene and a diverse community. Highly appealing for tourists seeking local experiences. | Shipe Park, Local coffee shops and eateries, Independent bookstores, Art and music events, Nearby libraries and community centers |
| Mueller | A modern, mixed-use development that combines residential, retail, and green spaces. Great for families and those looking for a contemporary lifestyle. | Mueller Lake Park, Retail shops and restaurants, Community events and markets, Outdoor swimming pool, Walking and biking trails |
Understanding Airbnb License Requirements & STR Laws in Del Valle (2026)
While Del Valle, Texas, United States currently shows low STR regulations, specific Airbnb license requirements might still exist or change. Always verify the latest short term rental regulations and Airbnb license requirements directly with local government authorities for Del Valle to ensure full compliance before hosting.
(Source: AirROI data, 2026, finding no licensed listings among those analyzed)
Top Performing Airbnb Properties in Del Valle (2026)
Benchmark your potential! Explore examples of top-performing Airbnb properties in Del Vallebased on Trailing Twelve Month (TTM) revenue. Analyze their characteristics, revenue, occupancy rate, and ADR to understand what drives success in this market.
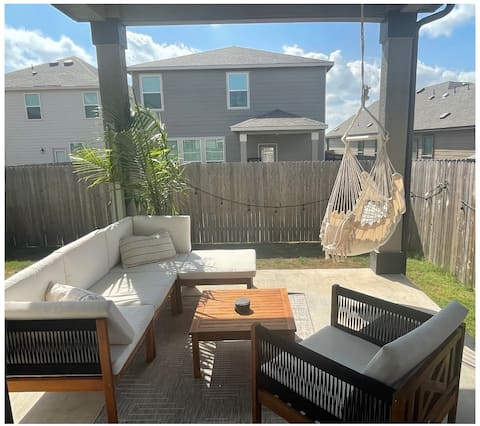
Home in Southeast Austin | Near Airport•COTA•Tesla
Entire Place • 3 bedrooms

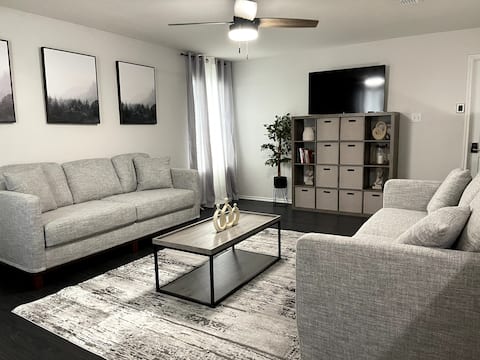
Lux Cozy Home l SE Austin near F1 / COTA / ABIA / Tesla
Entire Place • 4 bedrooms
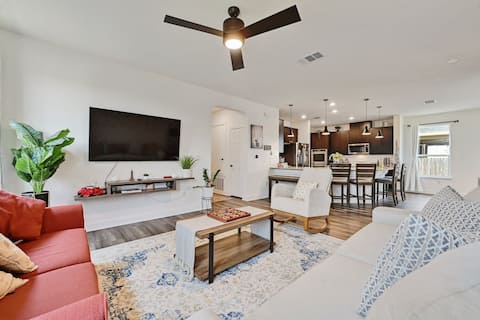
Spacious House: Near COTA, Tesla, ABIA/ Sleeps 16
Entire Place • 4 bedrooms

Luxury 2BD/2BA Next to Airport 6483
Entire Place • 2 bedrooms
Charming home w/EV Charger near COTA,Airport,Tesla
Entire Place • 3 bedrooms

Big 4BR house near COTA & Tesla
Entire Place • 4 bedrooms
Note: Performance varies based on location, size, amenities, seasonality, and management quality. Data reflects the past 12 months.
Top Performing Airbnb Hosts in Del Valle (2026)
Learn from the best! This table showcases top-performing Airbnb hosts in Del Valle based on the number of properties managed and estimated total revenue over the past year. Analyze their scale and performance metrics.
| Host Name | Properties | Grossing Revenue | Stay Reviews | Avg Rating |
|---|---|---|---|---|
| Evonify | 12 | $412,104 | 479 | 4.78/5.0 |
| Jam | 1 | $78,700 | 29 | 4.86/5.0 |
| Andrew | 5 | $75,069 | 448 | 4.77/5.0 |
| Julia | 3 | $72,354 | 129 | 4.89/5.0 |
| Laurent | 1 | $61,623 | 85 | 4.92/5.0 |
| Horacio | 1 | $56,734 | 20 | 4.95/5.0 |
| Diana | 2 | $50,000 | 4 | 5.00/5.0 |
| Aaliya & Riz | 1 | $47,225 | 88 | 5.00/5.0 |
| Waldo | 5 | $46,328 | 23 | 4.60/5.0 |
| Juan | 1 | $46,008 | 23 | 4.96/5.0 |
Analyzing the strategies of top hosts, such as their property selection, pricing, and guest communication, can offer valuable lessons for optimizing your own Airbnb operations in Del Valle.
Dive Deeper: Advanced Del Valle STR Market Data (2026)
Ready to unlock more insights? AirROI provides access to advanced metrics and comprehensive Airbnb data for Del Valle. Explore detailed analytics beyond this report to refine your investment strategy, optimize pricing, and maximize your vacation rental profits.
Explore Advanced MetricsDel Valle Short-Term Rental Market Composition (2026): Property & Room Types
Room Type Distribution
Property Type Distribution
Market Composition Insights for Del Valle
- The Del Valle Airbnb market composition is heavily skewed towards Entire Home/Apt listings, which make up 65.9% of the 88 active rentals. This indicates strong guest preference for privacy and space.
- However, a notable 29.5% share for Private Rooms suggests opportunities for budget-conscious travelers or hosts renting out spare rooms.
- Looking at the property type distribution in Del Valle, House properties are the most common (70.5%), reflecting the local real estate landscape.
- Houses represent a significant 70.5% portion, catering likely to families or larger groups.
- Smaller segments like hotel/boutique (combined 2.3%) offer potential for unique stay experiences.
Del Valle Airbnb Room Capacity Analysis (2026): Bedroom Distribution
Distribution of Listings by Number of Bedrooms
Room Capacity Insights for Del Valle
- The dominant room capacity in Del Valle is 1 bedroom listings, making up 25% of the market. This suggests a strong demand for properties suitable for couples or solo travelers.
- Together, 1 bedroom and 3 bedrooms properties represent 47.7% of the active Airbnb listings in Del Valle, indicating a high concentration in these sizes.
- A significant 34.0% of listings offer 3+ bedrooms, catering to larger groups and families seeking more space in Del Valle.
Del Valle Vacation Rental Guest Capacity Trends (2026)
Distribution of Listings by Guest Capacity
Guest Capacity Insights for Del Valle
- The most common guest capacity trend in Del Valle vacation rentals is listings accommodating 8+ guests (21.6%). This suggests the primary traveler segment is likely larger groups.
- Properties designed for 8+ guests and 2 guests dominate the Del Valle STR market, accounting for 35.2% of listings.
- 34.1% of properties accommodate 6+ guests, serving the market segment for larger families or group travel in Del Valle.
- On average, properties in Del Valle are equipped to host 3.4 guests.
Del Valle Airbnb Booking Patterns (2026): Available vs. Booked Days
Available Days Distribution
Booked Days Distribution
Booking Pattern Insights for Del Valle
- The most common availability pattern in Del Valle falls within the 271-366 days range, representing 51.1% of listings. This suggests many properties have significant open periods on their calendars.
- Approximately 77.2% of listings show high availability (181+ days open annually), indicating potential for increased bookings or specific owner usage patterns.
- For booked days, the 91-180 days range is most frequent in Del Valle (27.3%), reflecting common guest stay durations or potential owner blocking patterns.
- A notable 23.9% of properties secure long booking periods (181+ days booked per year), highlighting successful long-term rental strategies or significant owner usage.
Del Valle Airbnb Minimum Stay Requirements Analysis
Distribution of Listings by Minimum Night Requirement
1 Night
29 listings
33% of total
2 Nights
19 listings
21.6% of total
3 Nights
5 listings
5.7% of total
4-6 Nights
1 listings
1.1% of total
7-29 Nights
11 listings
12.5% of total
30+ Nights
23 listings
26.1% of total
Key Insights
- The most prevalent minimum stay requirement in Del Valle is 1 Night, adopted by 33% of listings. This highlights the market's preference for shorter, flexible bookings.
- A significant segment (26.1%) caters to monthly stays (30+ nights) in Del Valle, pointing to opportunities in the extended-stay market.
Recommendations
- Align with the market by considering a 1 Night minimum stay, as 33% of Del Valle hosts use this setting.
- Explore offering discounts for stays of 30+ nights to attract the 26.1% of the market seeking extended stays.
- Adjust minimum nights based on seasonality – potentially shorter during low season and longer during peak demand periods in Del Valle.
Del Valle Airbnb Cancellation Policy Trends Analysis (2026)
Super Strict 60 Days
4 listings
4.5% of total
Flexible
24 listings
27.3% of total
Moderate
10 listings
11.4% of total
Firm
38 listings
43.2% of total
Strict
12 listings
13.6% of total
Cancellation Policy Insights for Del Valle
- The prevailing Airbnb cancellation policy trend in Del Valle is Firm, used by 43.2% of listings.
- A majority (56.8%) of hosts in Del Valle utilize Firm or Strict policies, indicating a market where hosts prioritize booking security.
Recommendations for Hosts
- Consider adopting a Firm policy to align with the 43.2% market standard in Del Valle.
- Using a Strict policy might deter some guests, as only 13.6% of listings use it. Evaluate if potential revenue protection outweighs possible lower booking rates.
- Regularly review your cancellation policy against competitors and market demand shifts in Del Valle.
Del Valle STR Booking Lead Time Analysis (2026)
Average Booking Lead Time by Month
Booking Lead Time Insights for Del Valle
- The overall average booking lead time for vacation rentals in Del Valle is 34 days.
- Guests book furthest in advance for stays during October (average 84 days), likely coinciding with peak travel demand or local events.
- The shortest booking windows occur for stays in August (average 17 days), indicating more last-minute travel plans during this time.
- Seasonally, Fall (50 days avg.) sees the longest lead times, while Summer (18 days avg.) has the shortest, reflecting typical travel planning cycles.
Recommendations for Hosts
- Use the overall average lead time (34 days) as a baseline for your pricing and availability strategy in Del Valle.
- For October stays, consider implementing length-of-stay discounts or slightly higher rates for bookings made less than 84 days out to capitalize on advance planning.
- Target marketing efforts for the Fall season well in advance (at least 50 days) to capture early planners.
- Monitor your own booking lead times against these Del Valle averages to identify opportunities for dynamic pricing adjustments.
Popular & Essential Airbnb Amenities in Del Valle (2026)
Amenity Prevalence
Amenity Insights for Del Valle
- Essential amenities in Del Valle that guests expect include: Air conditioning, Wifi, Free parking on premises. Lacking these (any) could significantly impact bookings.
- Popular amenities like Smoke alarm, Kitchen, Heating are common but not universal. Offering these can provide a competitive edge.
Recommendations for Hosts
- Ensure your listing includes all essential amenities for Del Valle: Air conditioning, Wifi, Free parking on premises.
- Prioritize adding missing essentials: Wifi, Free parking on premises.
- Consider adding popular differentiators like Smoke alarm or Kitchen to increase appeal.
- Highlight unique or less common amenities you offer (e.g., hot tub, dedicated workspace, EV charger) in your listing description and photos.
- Regularly check competitor amenities in Del Valle to stay competitive.
Del Valle Airbnb Guest Demographics & Profile Analysis (2026)
Guest Profile Summary for Del Valle
- The typical guest profile for Airbnb in Del Valle consists of primarily domestic travelers (91%), often arriving from nearby Houston, typically belonging to the Post-2000s (Gen Z/Alpha) group (50%), primarily speaking English or Spanish.
- Domestic travelers account for 91.4% of guests.
- Key international markets include United States (91.4%) and Mexico (2.8%).
- Top languages spoken are English (61.2%) followed by Spanish (27.5%).
- A significant demographic segment is the Post-2000s (Gen Z/Alpha) group, representing 50% of guests.
Recommendations for Hosts
- Target domestic marketing efforts towards travelers from Houston and San Antonio.
- Tailor amenities and listing descriptions to appeal to the dominant Post-2000s (Gen Z/Alpha) demographic (e.g., highlight fast WiFi, smart home features, local guides).
- Highlight unique local experiences or amenities relevant to the primary guest profile.
- Consider seasonal promotions aligned with peak travel times for key origin markets.
Nearby Short-Term Rental Market Comparison
How does the Del Valle Airbnb market stack up against its neighbors? Compare key performance metrics like average monthly revenue, ADR, and occupancy rates in surrounding areas to understand the broader regional STR landscape.
| Market | Active Properties | Monthly Revenue | Daily Rate | Avg. Occupancy |
|---|---|---|---|---|
| Hudson Bend | 59 | $5,436 | $611.45 | 31% |
| Jonestown | 60 | $5,240 | $513.31 | 32% |
| Gillespie County | 11 | $4,887 | $351.24 | 59% |
| West Lake Hills | 21 | $4,391 | $656.35 | 34% |
| Helotes | 48 | $4,095 | $322.31 | 42% |
| Kingsland | 255 | $4,055 | $564.92 | 27% |
| Cottonwood Shores | 26 | $4,012 | $408.66 | 35% |
| Round Mountain | 17 | $3,781 | $385.24 | 42% |
| Volente | 19 | $3,627 | $462.89 | 30% |
| Dripping Springs | 403 | $3,493 | $389.50 | 32% |