Dallas Airbnb Market Analysis 2026: Short Term Rental Data & Vacation Rental Statistics in Texas, United States
Is Airbnb profitable in Dallas in 2026? Explore comprehensive Airbnb analytics for Dallas, Texas, United States to uncover income potential. This 2026 STR market report for Dallas, based on AirROI data from February 2025 to January 2026, reveals key trends in the bustling market of 4,065 active listings.
Whether you're considering an Airbnb investment in Dallas, optimizing your existing vacation rental, or exploring rental arbitrage opportunities, understanding the Dallas Airbnb data is crucial. Leveraging the low regulation environment is key to maximizing your short term rental income potential. Let's dive into the specifics.
Key Dallas Airbnb Performance Metrics Overview
Monthly Airbnb Revenue Variations & Income Potential in Dallas (2026)
Understanding the monthly revenue variations for Airbnb listings in Dallas is key to maximizing your short term rental income potential. Seasonality significantly impacts earnings. Our analysis, based on data from the past 12 months, shows that the peak revenue month for STRs in Dallas is typically June, while January often presents the lowest earnings, highlighting opportunities for strategic pricing adjustments during shoulder and low seasons. Explore the typical Airbnb income in Dallas across different performance tiers:
- Best-in-class properties (Top 10%) achieve $6,288+ monthly, often utilizing dynamic pricing and superior guest experiences.
- Strong performing properties (Top 25%) earn $4,061 or more, indicating effective management and desirable locations/amenities.
- Typical properties (Median) generate around $2,358 per month, representing the average market performance.
- Entry-level properties (Bottom 25%) see earnings around $1,189, often with potential for optimization.
Average Monthly Airbnb Earnings Trend in Dallas
Dallas Airbnb Occupancy Rate Trends (2026)
Maximize your bookings by understanding the Dallas STR occupancy trends. Seasonal demand shifts significantly influence how often properties are booked. Typically, Marchsees the highest demand (peak season occupancy), while January experiences the lowest (low season). Effective strategies, like adjusting minimum stays or offering promotions, can boost occupancy during slower periods. Here's how different property tiers perform in Dallas:
- Best-in-class properties (Top 10%) achieve 81%+ occupancy, indicating high desirability and potentially optimized availability.
- Strong performing properties (Top 25%) maintain 66% or higher occupancy, suggesting good market fit and guest satisfaction.
- Typical properties (Median) have an occupancy rate around 46%.
- Entry-level properties (Bottom 25%) average 24% occupancy, potentially facing higher vacancy.
Average Monthly Occupancy Rate Trend in Dallas
Average Daily Rate (ADR) Airbnb Trends in Dallas (2026)
Effective short term rental pricing strategy in Dallas involves understanding monthly ADR fluctuations. The Average Daily Rate (ADR) for Airbnb in Dallas typically peaks in November and dips lowest during February. Leveraging Airbnb dynamic pricing tools or strategies based on this seasonality can significantly boost revenue. Here's a look at the typical nightly rates achieved:
- Best-in-class properties (Top 10%) command rates of $384+ per night, often due to premium features or locations.
- Strong performing properties (Top 25%) achieve nightly rates of $251 or more.
- Typical properties (Median) charge around $165 per night.
- Entry-level properties (Bottom 25%) earn around $109 per night.
Average Daily Rate (ADR) Trend by Month in Dallas
Get Live Dallas Market Intelligence 👇

Explore Real-time Analytics
Airbnb Seasonality Analysis & Trends in Dallas (2026)
Peak Season (June, October, December)
- Revenue averages $3,527 per month
- Occupancy rates average 47.3%
- Daily rates average $228
Shoulder Season
- Revenue averages $3,143 per month
- Occupancy maintains around 46.3%
- Daily rates hold near $214
Low Season (January, February, April)
- Revenue drops to average $2,645 per month
- Occupancy decreases to average 43.6%
- Daily rates adjust to average $203
Seasonality Insights for Dallas
- The Airbnb seasonality in Dallas shows moderate seasonality with distinct peak and low periods. While the sections above show seasonal averages, it's also insightful to look at the extremes:
- During the high season, the absolute peak month showcases Dallas's highest earning potential, with monthly revenues capable of climbing to $3,692, occupancy reaching a high of 54.6%, and ADRs peaking at $235.
- Conversely, the slowest single month of the year, typically falling within the low season, marks the market's lowest point. In this month, revenue might dip to $2,532, occupancy could drop to 36.5%, and ADRs may adjust down to $196.
- Understanding both the seasonal averages and these monthly peaks and troughs in revenue, occupancy, and ADR is crucial for maximizing your Airbnb profit potential in Dallas.
Seasonal Strategies for Maximizing Profit
- Peak Season: Maximize revenue through premium pricing and potentially longer minimum stays. Ensure high availability.
- Low Season: Offer competitive pricing, special promotions (e.g., extended stay discounts), and flexible cancellation policies. Target off-season travelers like remote workers or budget-conscious guests.
- Shoulder Seasons: Implement dynamic pricing that balances peak and low rates. Target weekend travelers or specific events. Offer slightly more flexible terms than peak season.
- Regularly analyze your own performance against these Dallas seasonality benchmarks and adjust your pricing and availability strategy accordingly.
Best Areas for Airbnb Investment in Dallas (2026)
Exploring the top neighborhoods for short-term rentals in Dallas? This section highlights key areas, outlining why they are attractive for hosts and guests, along with notable local attractions. Consider these locations based on your target guest profile and investment strategy.
| Neighborhood / Area | Why Host Here? (Target Guests & Appeal) | Key Attractions & Landmarks |
|---|---|---|
| Deep Ellum | Famous for its vibrant street art, live music venues, and nightlife. Attracts both tourists and locals for its unique atmosphere and cultural experiences. | Deep Ellum Arts District, The Bomb Factory, Dallas Street Art, Bishop Arts District, Live Music Venues |
| Bishop Arts District | A trendy neighborhood known for its eclectic shops, restaurants, and art galleries. Ideal for visitors looking for a local experience with a touch of charm and creativity. | Bishop Arts Theatre, Local Shops, Art Galleries, Restaurants, Cafes |
| Uptown | A lively district with upscale shopping, dining, and a youthful vibe. Popular among young professionals and tourists for its modern lifestyle and walkability. | McKinney Avenue, Uptown Park, Katy Trail, Dallas Arts District, Parks |
| Downtown Dallas | The heart of the city, known for its skyscrapers, business centers, and entertainment options. Ideal for business travelers and those exploring the urban environment. | Dealey Plaza, Dallas World Aquarium, Reunion Tower, Klyde Warren Park, Arts District |
| Fair Park | Home to the State Fair of Texas and various museums, Fair Park draws visitors year-round with its cultural events and historical significance. | Dallas Museum of Art, Perot Museum of Nature and Science, Cotton Bowl Stadium, Fair Park, Texas Discovery Gardens |
| Lakewood | A picturesque neighborhood with charming houses, parks, and proximity to White Rock Lake. Attracts families and outdoor enthusiasts for recreational activities. | White Rock Lake, Lakewood Park, Dallas Arboretum and Botanical Garden, Biking Trails, Nature Trails |
| Las Colinas | A master-planned community known for its business facilities, entertainment, and proximity to DFW Airport, making it a prime location for corporate travelers. | Toyota Music Factory, Las Colinas Canals, William Square, Business Centers, Golf Courses |
| North Dallas | A mix of residential charm and suburban convenience, North Dallas is appealing for families and those seeking quieter accommodations with easy city access. | Galleria Dallas, Parks and Recreation, Shopping Centers, Restaurants, Vast Green Spaces |
Understanding Airbnb License Requirements & STR Laws in Dallas (2026)
While Dallas, Texas, United States currently shows low STR regulations, specific Airbnb license requirements might still exist or change. Always verify the latest short term rental regulations and Airbnb license requirements directly with local government authorities for Dallas to ensure full compliance before hosting.
(Source: AirROI data, 2026, based on 0% licensed listings)
Top Performing Airbnb Properties in Dallas (2026)
Benchmark your potential! Explore examples of top-performing Airbnb properties in Dallasbased on Trailing Twelve Month (TTM) revenue. Analyze their characteristics, revenue, occupancy rate, and ADR to understand what drives success in this market.
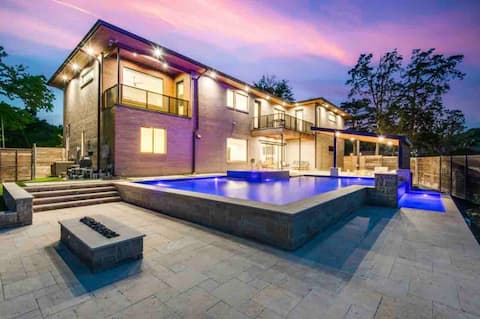
Modern escape w/ pool & hot tub
Entire Place • 6 bedrooms
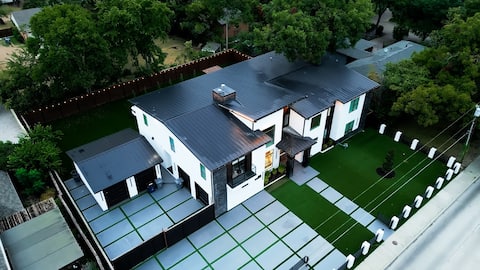
Stunning Dallas Mansion - Luxurious, Spacious, New
Entire Place • 7 bedrooms
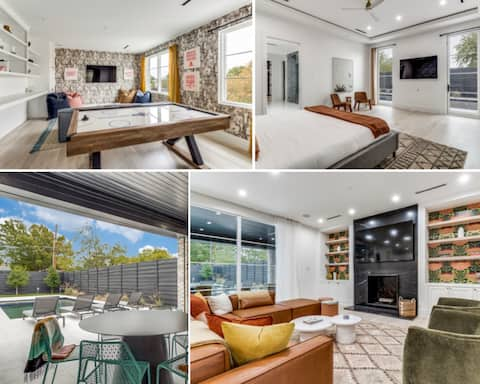
The Mansion at Lover's Lane
Entire Place • 6 bedrooms
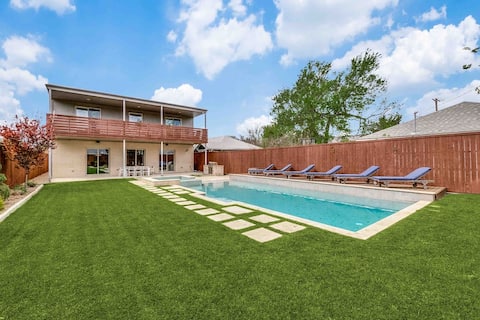
Modern Comfort in Lower Greenville!
Entire Place • 5 bedrooms

A Higher Frequency Off Henderson
Entire Place • 5 bedrooms

Ultra High-End Luxury Villa! Great Dallas Location
Entire Place • 6 bedrooms
Note: Performance varies based on location, size, amenities, seasonality, and management quality. Data reflects the past 12 months.
Top Performing Airbnb Hosts in Dallas (2026)
Learn from the best! This table showcases top-performing Airbnb hosts in Dallas based on the number of properties managed and estimated total revenue over the past year. Analyze their scale and performance metrics.
| Host Name | Properties | Grossing Revenue | Stay Reviews | Avg Rating |
|---|---|---|---|---|
| Kayli | 73 | $2,992,874 | 5872 | 4.88/5.0 |
| Paul | 60 | $2,488,097 | 3676 | 4.94/5.0 |
| Carpediem | 21 | $1,934,914 | 2736 | 4.87/5.0 |
| Paolo | 46 | $1,305,039 | 1601 | 4.43/5.0 |
| Blake | 13 | $1,232,279 | 1244 | 4.84/5.0 |
| Micreyl | 42 | $1,128,890 | 1123 | 4.41/5.0 |
| Jacob | 19 | $1,109,720 | 2063 | 4.88/5.0 |
| Raj | 35 | $1,091,947 | 1445 | 4.85/5.0 |
| Braden | 71 | $1,075,258 | 983 | 4.88/5.0 |
| Grace | 36 | $1,033,971 | 1901 | 4.58/5.0 |
Analyzing the strategies of top hosts, such as their property selection, pricing, and guest communication, can offer valuable lessons for optimizing your own Airbnb operations in Dallas.
Dive Deeper: Advanced Dallas STR Market Data (2026)
Ready to unlock more insights? AirROI provides access to advanced metrics and comprehensive Airbnb data for Dallas. Explore detailed analytics beyond this report to refine your investment strategy, optimize pricing, and maximize your vacation rental profits.
Explore Advanced MetricsDallas Short-Term Rental Market Composition (2026): Property & Room Types
Room Type Distribution
Property Type Distribution
Market Composition Insights for Dallas
- The Dallas Airbnb market composition is heavily skewed towards Entire Home/Apt listings, which make up 90.2% of the 4,065 active rentals. This indicates strong guest preference for privacy and space.
- Looking at the property type distribution in Dallas, Apartment/Condo properties are the most common (49.1%), reflecting the local real estate landscape.
- Houses represent a significant 45.7% portion, catering likely to families or larger groups.
- Smaller segments like hotel/boutique, others, unique stays, outdoor/unique (combined 5.2%) offer potential for unique stay experiences.
Dallas Airbnb Room Capacity Analysis (2026): Bedroom Distribution
Distribution of Listings by Number of Bedrooms
Room Capacity Insights for Dallas
- The dominant room capacity in Dallas is 1 bedroom listings, making up 39.6% of the market. This suggests a strong demand for properties suitable for couples or solo travelers.
- Together, 1 bedroom and 2 bedrooms properties represent 60.6% of the active Airbnb listings in Dallas, indicating a high concentration in these sizes.
- A significant 28.9% of listings offer 3+ bedrooms, catering to larger groups and families seeking more space in Dallas.
Dallas Vacation Rental Guest Capacity Trends (2026)
Distribution of Listings by Guest Capacity
Guest Capacity Insights for Dallas
- The most common guest capacity trend in Dallas vacation rentals is listings accommodating 8+ guests (24.7%). This suggests the primary traveler segment is likely larger groups.
- Properties designed for 8+ guests and 2 guests dominate the Dallas STR market, accounting for 44.5% of listings.
- 39.7% of properties accommodate 6+ guests, serving the market segment for larger families or group travel in Dallas.
- On average, properties in Dallas are equipped to host 4.5 guests.
Dallas Airbnb Booking Patterns (2026): Available vs. Booked Days
Available Days Distribution
Booked Days Distribution
Booking Pattern Insights for Dallas
- The most common availability pattern in Dallas falls within the 271-366 days range, representing 40.7% of listings. This suggests many properties have significant open periods on their calendars.
- Approximately 76.5% of listings show high availability (181+ days open annually), indicating potential for increased bookings or specific owner usage patterns.
- For booked days, the 91-180 days range is most frequent in Dallas (36.1%), reflecting common guest stay durations or potential owner blocking patterns.
- A notable 25.1% of properties secure long booking periods (181+ days booked per year), highlighting successful long-term rental strategies or significant owner usage.
Dallas Airbnb Minimum Stay Requirements Analysis
Distribution of Listings by Minimum Night Requirement
1 Night
1020 listings
25.1% of total
2 Nights
807 listings
19.9% of total
3 Nights
176 listings
4.3% of total
4-6 Nights
169 listings
4.2% of total
7-29 Nights
459 listings
11.3% of total
30+ Nights
1434 listings
35.3% of total
Key Insights
- The most prevalent minimum stay requirement in Dallas is 30+ Nights, adopted by 35.3% of listings. This highlights the market's preference for longer commitments.
- A significant segment (35.3%) caters to monthly stays (30+ nights) in Dallas, pointing to opportunities in the extended-stay market.
Recommendations
- Align with the market by considering a 30+ Nights minimum stay, as 35.3% of Dallas hosts use this setting.
- If feasible, allowing 1-night stays, especially midweek or during low season, could capture last-minute bookings, as only 25.1% currently do.
- Explore offering discounts for stays of 30+ nights to attract the 35.3% of the market seeking extended stays.
- Adjust minimum nights based on seasonality – potentially shorter during low season and longer during peak demand periods in Dallas.
Dallas Airbnb Cancellation Policy Trends Analysis (2026)
Limited
91 listings
2.3% of total
Super Strict 30 Days
69 listings
1.7% of total
Super Strict 60 Days
99 listings
2.4% of total
Flexible
575 listings
14.2% of total
Moderate
1080 listings
26.7% of total
Firm
1354 listings
33.5% of total
Strict
774 listings
19.1% of total
Cancellation Policy Insights for Dallas
- The prevailing Airbnb cancellation policy trend in Dallas is Firm, used by 33.5% of listings.
- A majority (52.6%) of hosts in Dallas utilize Firm or Strict policies, indicating a market where hosts prioritize booking security.
Recommendations for Hosts
- Consider adopting a Firm policy to align with the 33.5% market standard in Dallas.
- Regularly review your cancellation policy against competitors and market demand shifts in Dallas.
Dallas STR Booking Lead Time Analysis (2026)
Average Booking Lead Time by Month
Booking Lead Time Insights for Dallas
- The overall average booking lead time for vacation rentals in Dallas is 26 days.
- Guests book furthest in advance for stays during June (average 36 days), likely coinciding with peak travel demand or local events.
- The shortest booking windows occur for stays in August (average 23 days), indicating more last-minute travel plans during this time.
- Seasonally, Fall (31 days avg.) sees the longest lead times, while Winter (25 days avg.) has the shortest, reflecting typical travel planning cycles.
Recommendations for Hosts
- Use the overall average lead time (26 days) as a baseline for your pricing and availability strategy in Dallas.
- Target marketing efforts for the Fall season well in advance (at least 31 days) to capture early planners.
- Monitor your own booking lead times against these Dallas averages to identify opportunities for dynamic pricing adjustments.
Popular & Essential Airbnb Amenities in Dallas (2026)
Amenity Prevalence
Amenity Insights for Dallas
- Essential amenities in Dallas that guests expect include: Wifi, Air conditioning, TV, Smoke alarm, Kitchen, Heating. Lacking these (any) could significantly impact bookings.
- Popular amenities like Free parking on premises, Hot water, Washer are common but not universal. Offering these can provide a competitive edge.
Recommendations for Hosts
- Ensure your listing includes all essential amenities for Dallas: Wifi, Air conditioning, TV, Smoke alarm, Kitchen, Heating.
- Prioritize adding missing essentials: Wifi, Air conditioning, TV, Smoke alarm, Kitchen, Heating.
- Consider adding popular differentiators like Free parking on premises or Hot water to increase appeal.
- Highlight unique or less common amenities you offer (e.g., hot tub, dedicated workspace, EV charger) in your listing description and photos.
- Regularly check competitor amenities in Dallas to stay competitive.
Dallas Airbnb Guest Demographics & Profile Analysis (2026)
Guest Profile Summary for Dallas
- The typical guest profile for Airbnb in Dallas consists of primarily domestic travelers (92%), often arriving from nearby Dallas, typically belonging to the Post-2000s (Gen Z/Alpha) group (50%), primarily speaking English or Spanish.
- Domestic travelers account for 92.1% of guests.
- Key international markets include United States (92.1%) and Canada (1.1%).
- Top languages spoken are English (67%) followed by Spanish (18.4%).
- A significant demographic segment is the Post-2000s (Gen Z/Alpha) group, representing 50% of guests.
Recommendations for Hosts
- Target domestic marketing efforts towards travelers from Dallas and Houston.
- Tailor amenities and listing descriptions to appeal to the dominant Post-2000s (Gen Z/Alpha) demographic (e.g., highlight fast WiFi, smart home features, local guides).
- Highlight unique local experiences or amenities relevant to the primary guest profile.
- Consider seasonal promotions aligned with peak travel times for key origin markets.
Nearby Short-Term Rental Market Comparison
How does the Dallas Airbnb market stack up against its neighbors? Compare key performance metrics like average monthly revenue, ADR, and occupancy rates in surrounding areas to understand the broader regional STR landscape.
| Market | Active Properties | Monthly Revenue | Daily Rate | Avg. Occupancy |
|---|---|---|---|---|
| Star Harbor | 11 | $5,474 | $741.72 | 33% |
| Valley View | 25 | $5,111 | $484.73 | 39% |
| Bluff Dale | 18 | $4,063 | $411.68 | 29% |
| Red Oak | 17 | $3,978 | $288.35 | 50% |
| DeSoto | 29 | $3,947 | $332.58 | 47% |
| Holly Lake Ranch | 11 | $3,836 | $358.93 | 36% |
| Flower Mound | 79 | $3,760 | $326.24 | 45% |
| Azle | 62 | $3,533 | $323.80 | 41% |
| Westworth Village | 11 | $3,530 | $240.30 | 48% |
| Highland Village | 15 | $3,363 | $345.42 | 48% |