Crowley Airbnb Market Analysis 2026: Short Term Rental Data & Vacation Rental Statistics in Texas, United States
Is Airbnb profitable in Crowley in 2026? Explore comprehensive Airbnb analytics for Crowley, Texas, United States to uncover income potential. This 2026 STR market report for Crowley, based on AirROI data from February 2025 to January 2026, reveals key trends in the niche market of 27 active listings.
Whether you're considering an Airbnb investment in Crowley, optimizing your existing vacation rental, or exploring rental arbitrage opportunities, understanding the Crowley Airbnb data is crucial. Leveraging the low regulation environment is key to maximizing your short term rental income potential. Let's dive into the specifics.
Key Crowley Airbnb Performance Metrics Overview
Monthly Airbnb Revenue Variations & Income Potential in Crowley (2026)
Understanding the monthly revenue variations for Airbnb listings in Crowley is key to maximizing your short term rental income potential. Seasonality significantly impacts earnings. Our analysis, based on data from the past 12 months, shows that the peak revenue month for STRs in Crowley is typically July, while January often presents the lowest earnings, highlighting opportunities for strategic pricing adjustments during shoulder and low seasons. Explore the typical Airbnb income in Crowley across different performance tiers:
- Best-in-class properties (Top 10%) achieve $6,572+ monthly, often utilizing dynamic pricing and superior guest experiences.
- Strong performing properties (Top 25%) earn $4,290 or more, indicating effective management and desirable locations/amenities.
- Typical properties (Median) generate around $2,504 per month, representing the average market performance.
- Entry-level properties (Bottom 25%) see earnings around $1,474, often with potential for optimization.
Average Monthly Airbnb Earnings Trend in Crowley
Crowley Airbnb Occupancy Rate Trends (2026)
Maximize your bookings by understanding the Crowley STR occupancy trends. Seasonal demand shifts significantly influence how often properties are booked. Typically, Julysees the highest demand (peak season occupancy), while January experiences the lowest (low season). Effective strategies, like adjusting minimum stays or offering promotions, can boost occupancy during slower periods. Here's how different property tiers perform in Crowley:
- Best-in-class properties (Top 10%) achieve 83%+ occupancy, indicating high desirability and potentially optimized availability.
- Strong performing properties (Top 25%) maintain 65% or higher occupancy, suggesting good market fit and guest satisfaction.
- Typical properties (Median) have an occupancy rate around 54%.
- Entry-level properties (Bottom 25%) average 30% occupancy, potentially facing higher vacancy.
Average Monthly Occupancy Rate Trend in Crowley
Average Daily Rate (ADR) Airbnb Trends in Crowley (2026)
Effective short term rental pricing strategy in Crowley involves understanding monthly ADR fluctuations. The Average Daily Rate (ADR) for Airbnb in Crowley typically peaks in November and dips lowest during February. Leveraging Airbnb dynamic pricing tools or strategies based on this seasonality can significantly boost revenue. Here's a look at the typical nightly rates achieved:
- Best-in-class properties (Top 10%) command rates of $315+ per night, often due to premium features or locations.
- Strong performing properties (Top 25%) achieve nightly rates of $264 or more.
- Typical properties (Median) charge around $179 per night.
- Entry-level properties (Bottom 25%) earn around $75 per night.
Average Daily Rate (ADR) Trend by Month in Crowley
Get Live Crowley Market Intelligence 👇

Explore Real-time Analytics
Airbnb Seasonality Analysis & Trends in Crowley (2026)
Peak Season (July, June, October)
- Revenue averages $4,239 per month
- Occupancy rates average 64.1%
- Daily rates average $182
Shoulder Season
- Revenue averages $3,156 per month
- Occupancy maintains around 49.5%
- Daily rates hold near $178
Low Season (January, February, September)
- Revenue drops to average $1,918 per month
- Occupancy decreases to average 35.1%
- Daily rates adjust to average $179
Seasonality Insights for Crowley
- The Airbnb seasonality in Crowley shows highly seasonal trends requiring careful strategy. While the sections above show seasonal averages, it's also insightful to look at the extremes:
- During the high season, the absolute peak month showcases Crowley's highest earning potential, with monthly revenues capable of climbing to $4,645, occupancy reaching a high of 70.6%, and ADRs peaking at $201.
- Conversely, the slowest single month of the year, typically falling within the low season, marks the market's lowest point. In this month, revenue might dip to $1,406, occupancy could drop to 26.0%, and ADRs may adjust down to $164.
- Understanding both the seasonal averages and these monthly peaks and troughs in revenue, occupancy, and ADR is crucial for maximizing your Airbnb profit potential in Crowley.
Seasonal Strategies for Maximizing Profit
- Peak Season: Maximize revenue through premium pricing and potentially longer minimum stays. Ensure high availability.
- Low Season: Offer competitive pricing, special promotions (e.g., extended stay discounts), and flexible cancellation policies. Target off-season travelers like remote workers or budget-conscious guests.
- Shoulder Seasons: Implement dynamic pricing that balances peak and low rates. Target weekend travelers or specific events. Offer slightly more flexible terms than peak season.
- Regularly analyze your own performance against these Crowley seasonality benchmarks and adjust your pricing and availability strategy accordingly.
Best Areas for Airbnb Investment in Crowley (2026)
Exploring the top neighborhoods for short-term rentals in Crowley? This section highlights key areas, outlining why they are attractive for hosts and guests, along with notable local attractions. Consider these locations based on your target guest profile and investment strategy.
| Neighborhood / Area | Why Host Here? (Target Guests & Appeal) | Key Attractions & Landmarks |
|---|---|---|
| Crowley Center | The heart of Crowley, featuring local shops, dining, and community events. A preferred location for families and visitors looking to experience the local culture. | Crowley Community Center, Crowley Historical Society, Local parks and playgrounds, Farmers Market, Various dining options |
| South Crowley | A suburban area known for its quieter residential feel, appealing to visitors seeking a retreat from larger city life while still being close to Fort Worth attractions. | Local parks, Residential neighborhoods, Quiet cafes, Community events |
| North Crowley | Close proximity to major highways and Fort Worth, making it a convenient location for travelers and those visiting local attractions. | Access to highways, Local shopping centers, Nearby theaters, Fort Worth Zoo and Museum District |
| Eagle Mountain Lake | Only a short drive from Crowley, this area offers beautiful lake views and outdoor activities, attracting nature lovers and families. | Eagle Mountain Lake, Boat rentals, Fishing, Picnic areas, Hiking trails |
| Wichita Falls | A bit further but known for its waterfalls and parks, it provides a unique destination for visitors looking to explore north Texas. | Wichita Falls, Lakeside parks, Riverside trails, Local art galleries, Botanic Garden |
| Burleson | Adjacent to Crowley, Burleson has growing amenities and serves as a convenient stop for visitors to the greater Fort Worth area. | Old Town Burleson, Shopping districts, Dining options, Parks and recreation areas |
| Fort Worth Historic District | Just a short drive from Crowley, this area is rich in history and culture, perfect for tourists wanting a historical experience. | Fort Worth Stockyards, Sundance Square, Kimbell Art Museum, Fort Worth Zoo, Cultural district |
| Benbrook Lake | Offering outdoor activities and a scenic retreat, this area attracts visitors looking for recreation and nature adventures. | Benbrook Lake, Fishing spots, Hiking and biking trails, Picnic areas, Camping |
Understanding Airbnb License Requirements & STR Laws in Crowley (2026)
While Crowley, Texas, United States currently shows low STR regulations, specific Airbnb license requirements might still exist or change. Always verify the latest short term rental regulations and Airbnb license requirements directly with local government authorities for Crowley to ensure full compliance before hosting.
(Source: AirROI data, 2026, finding no licensed listings among those analyzed)
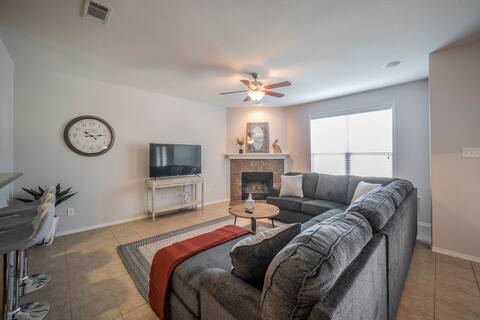
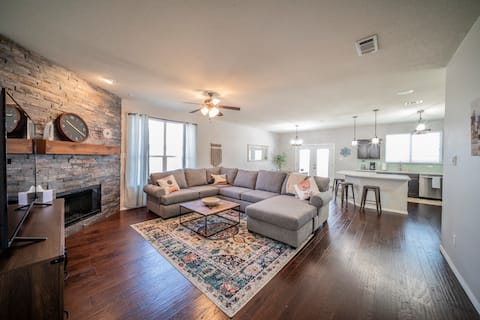
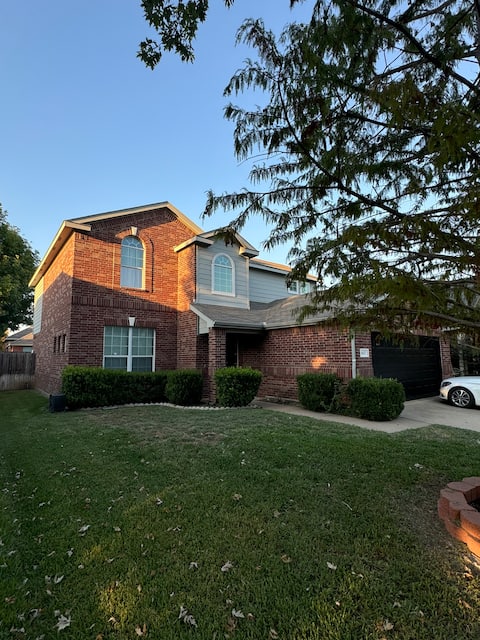
Top Performing Airbnb Properties in Crowley (2026)
Benchmark your potential! Explore examples of top-performing Airbnb properties in Crowleybased on Trailing Twelve Month (TTM) revenue. Analyze their characteristics, revenue, occupancy rate, and ADR to understand what drives success in this market.

Home near Ft.Worth with Backyard Oasis
Entire Place • 4 bedrooms

Private Heated Pool, Hot Tub, Yard, FirePit
Entire Place • 4 bedrooms
Fully equipped Getaway w/ All NEW Furnishings
Entire Place • 4 bedrooms
Bright and Fresh Bungalow - Perfect for Families!
Entire Place • 3 bedrooms
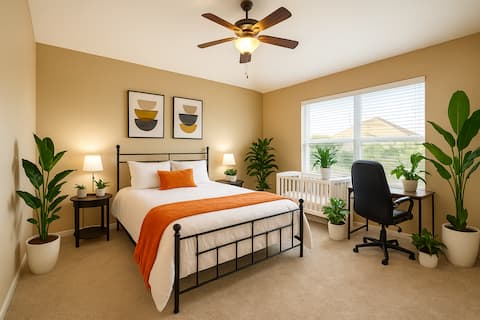
One level home, Foosball, Crib, Office space, Yard
Entire Place • 3 bedrooms
Family fun Haven
Entire Place • 4 bedrooms
Note: Performance varies based on location, size, amenities, seasonality, and management quality. Data reflects the past 12 months.
Top Performing Airbnb Hosts in Crowley (2026)
Learn from the best! This table showcases top-performing Airbnb hosts in Crowley based on the number of properties managed and estimated total revenue over the past year. Analyze their scale and performance metrics.
| Host Name | Properties | Grossing Revenue | Stay Reviews | Avg Rating |
|---|---|---|---|---|
| Shok | 2 | $94,028 | 145 | 4.96/5.0 |
| Tessa | 1 | $64,997 | 166 | 4.89/5.0 |
| A Real Home Away | 2 | $57,253 | 18 | 5.00/5.0 |
| Aaron | 1 | $52,666 | 66 | 4.80/5.0 |
| Nile | 1 | $50,425 | 45 | 4.56/5.0 |
| Sobha | 1 | $42,590 | 12 | 4.67/5.0 |
| Judith | 1 | $39,617 | 54 | 4.93/5.0 |
| Michelle | 1 | $34,967 | 173 | 4.97/5.0 |
| Paul | 1 | $30,581 | 21 | 4.90/5.0 |
| Karen | 1 | $25,217 | 69 | 4.81/5.0 |
Analyzing the strategies of top hosts, such as their property selection, pricing, and guest communication, can offer valuable lessons for optimizing your own Airbnb operations in Crowley.
Dive Deeper: Advanced Crowley STR Market Data (2026)
Ready to unlock more insights? AirROI provides access to advanced metrics and comprehensive Airbnb data for Crowley. Explore detailed analytics beyond this report to refine your investment strategy, optimize pricing, and maximize your vacation rental profits.
Explore Advanced MetricsCrowley Short-Term Rental Market Composition (2026): Property & Room Types
Room Type Distribution
Property Type Distribution
Market Composition Insights for Crowley
- The Crowley Airbnb market composition is heavily skewed towards Entire Home/Apt listings, which make up 74.1% of the 27 active rentals. This indicates strong guest preference for privacy and space.
- Looking at the property type distribution in Crowley, House properties are the most common (88.9%), reflecting the local real estate landscape.
- Houses represent a significant 88.9% portion, catering likely to families or larger groups.
- Smaller segments like hotel/boutique (combined 3.7%) offer potential for unique stay experiences.
Crowley Airbnb Room Capacity Analysis (2026): Bedroom Distribution
Distribution of Listings by Number of Bedrooms
Room Capacity Insights for Crowley
- The dominant room capacity in Crowley is 4 bedrooms listings, making up 33.3% of the market. This suggests a strong demand for properties suitable for families or small groups.
- Together, 4 bedrooms and 3 bedrooms properties represent 62.9% of the active Airbnb listings in Crowley, indicating a high concentration in these sizes.
- A significant 66.6% of listings offer 3+ bedrooms, catering to larger groups and families seeking more space in Crowley.
Crowley Vacation Rental Guest Capacity Trends (2026)
Distribution of Listings by Guest Capacity
Guest Capacity Insights for Crowley
- The most common guest capacity trend in Crowley vacation rentals is listings accommodating 8+ guests (40.7%). This suggests the primary traveler segment is likely larger groups.
- Properties designed for 8+ guests and 6 guests dominate the Crowley STR market, accounting for 66.6% of listings.
- 70.3% of properties accommodate 6+ guests, serving the market segment for larger families or group travel in Crowley.
- On average, properties in Crowley are equipped to host 5.3 guests.
Crowley Airbnb Booking Patterns (2026): Available vs. Booked Days
Available Days Distribution
Booked Days Distribution
Booking Pattern Insights for Crowley
- The most common availability pattern in Crowley falls within the 271-366 days range, representing 40.7% of listings. This suggests many properties have significant open periods on their calendars.
- Approximately 70.3% of listings show high availability (181+ days open annually), indicating potential for increased bookings or specific owner usage patterns.
- For booked days, the 91-180 days range is most frequent in Crowley (29.6%), reflecting common guest stay durations or potential owner blocking patterns.
- A notable 29.6% of properties secure long booking periods (181+ days booked per year), highlighting successful long-term rental strategies or significant owner usage.
Crowley Airbnb Minimum Stay Requirements Analysis
Distribution of Listings by Minimum Night Requirement
1 Night
5 listings
18.5% of total
2 Nights
3 listings
11.1% of total
3 Nights
3 listings
11.1% of total
4-6 Nights
2 listings
7.4% of total
7-29 Nights
5 listings
18.5% of total
30+ Nights
9 listings
33.3% of total
Key Insights
- The most prevalent minimum stay requirement in Crowley is 30+ Nights, adopted by 33.3% of listings. This highlights the market's preference for longer commitments.
- A significant segment (33.3%) caters to monthly stays (30+ nights) in Crowley, pointing to opportunities in the extended-stay market.
Recommendations
- Align with the market by considering a 30+ Nights minimum stay, as 33.3% of Crowley hosts use this setting.
- If feasible, allowing 1-night stays, especially midweek or during low season, could capture last-minute bookings, as only 18.5% currently do.
- Explore offering discounts for stays of 30+ nights to attract the 33.3% of the market seeking extended stays.
- Adjust minimum nights based on seasonality – potentially shorter during low season and longer during peak demand periods in Crowley.
Crowley Airbnb Cancellation Policy Trends Analysis (2026)
Flexible
6 listings
23.1% of total
Moderate
7 listings
26.9% of total
Firm
12 listings
46.2% of total
Strict
1 listings
3.8% of total
Cancellation Policy Insights for Crowley
- The prevailing Airbnb cancellation policy trend in Crowley is Firm, used by 46.2% of listings.
- There's a relatively balanced mix between guest-friendly (50.0%) and stricter (50.0%) policies, offering choices for different guest needs.
- Strict cancellation policies are quite rare (3.8%), potentially making listings with this policy less competitive unless justified by high demand or property type.
Recommendations for Hosts
- Consider adopting a Firm policy to align with the 46.2% market standard in Crowley.
- Using a Strict policy might deter some guests, as only 3.8% of listings use it. Evaluate if potential revenue protection outweighs possible lower booking rates.
- Regularly review your cancellation policy against competitors and market demand shifts in Crowley.
Crowley STR Booking Lead Time Analysis (2026)
Average Booking Lead Time by Month
Booking Lead Time Insights for Crowley
- The overall average booking lead time for vacation rentals in Crowley is 22 days.
- Guests book furthest in advance for stays during December (average 45 days), likely coinciding with peak travel demand or local events.
- The shortest booking windows occur for stays in February (average 15 days), indicating more last-minute travel plans during this time.
- Seasonally, Summer (34 days avg.) sees the longest lead times, while Spring (25 days avg.) has the shortest, reflecting typical travel planning cycles.
Recommendations for Hosts
- Use the overall average lead time (22 days) as a baseline for your pricing and availability strategy in Crowley.
- For December stays, consider implementing length-of-stay discounts or slightly higher rates for bookings made less than 45 days out to capitalize on advance planning.
- Target marketing efforts for the Summer season well in advance (at least 34 days) to capture early planners.
- Monitor your own booking lead times against these Crowley averages to identify opportunities for dynamic pricing adjustments.
Popular & Essential Airbnb Amenities in Crowley (2026)
Amenity Prevalence
Amenity Insights for Crowley
- Essential amenities in Crowley that guests expect include: Air conditioning, Wifi. Lacking these (any) could significantly impact bookings.
- Popular amenities like Heating, TV, Hot water are common but not universal. Offering these can provide a competitive edge.
Recommendations for Hosts
- Ensure your listing includes all essential amenities for Crowley: Air conditioning, Wifi.
- Consider adding popular differentiators like Heating or TV to increase appeal.
- Highlight unique or less common amenities you offer (e.g., hot tub, dedicated workspace, EV charger) in your listing description and photos.
- Regularly check competitor amenities in Crowley to stay competitive.
Crowley Airbnb Guest Demographics & Profile Analysis (2026)
Guest Profile Summary for Crowley
- The typical guest profile for Airbnb in Crowley consists of primarily domestic travelers (97%), often arriving from nearby Fort Worth, typically belonging to the Post-2000s (Gen Z/Alpha) group (50%), primarily speaking English or Spanish.
- Domestic travelers account for 96.8% of guests.
- Key international markets include United States (96.8%) and Canada (1.3%).
- Top languages spoken are English (71%) followed by Spanish (20.4%).
- A significant demographic segment is the Post-2000s (Gen Z/Alpha) group, representing 50% of guests.
Recommendations for Hosts
- Target domestic marketing efforts towards travelers from Fort Worth and San Antonio.
- Tailor amenities and listing descriptions to appeal to the dominant Post-2000s (Gen Z/Alpha) demographic (e.g., highlight fast WiFi, smart home features, local guides).
- Highlight unique local experiences or amenities relevant to the primary guest profile.
- Consider seasonal promotions aligned with peak travel times for key origin markets.
Nearby Short-Term Rental Market Comparison
How does the Crowley Airbnb market stack up against its neighbors? Compare key performance metrics like average monthly revenue, ADR, and occupancy rates in surrounding areas to understand the broader regional STR landscape.
| Market | Active Properties | Monthly Revenue | Daily Rate | Avg. Occupancy |
|---|---|---|---|---|
| Strawn | 27 | $8,233 | $847.64 | 34% |
| Star Harbor | 11 | $5,474 | $741.72 | 33% |
| Valley View | 25 | $5,111 | $484.73 | 39% |
| Bluff Dale | 18 | $4,063 | $411.68 | 29% |
| Red Oak | 17 | $3,978 | $288.35 | 50% |
| DeSoto | 29 | $3,947 | $332.58 | 47% |
| Flower Mound | 79 | $3,760 | $326.24 | 45% |
| Azle | 62 | $3,533 | $323.80 | 41% |
| Westworth Village | 11 | $3,530 | $240.30 | 48% |
| Highland Village | 15 | $3,363 | $345.42 | 48% |