Cottonwood Shores Airbnb Market Analysis 2026: Short Term Rental Data & Vacation Rental Statistics in Texas, United States
Is Airbnb profitable in Cottonwood Shores in 2026? Explore comprehensive Airbnb analytics for Cottonwood Shores, Texas, United States to uncover income potential. This 2026 STR market report for Cottonwood Shores, based on AirROI data from February 2025 to January 2026, reveals key trends in the niche market of 26 active listings.
Whether you're considering an Airbnb investment in Cottonwood Shores, optimizing your existing vacation rental, or exploring rental arbitrage opportunities, understanding the Cottonwood Shores Airbnb data is crucial. Leveraging the low regulation environment is key to maximizing your short term rental income potential. Let's dive into the specifics.
Key Cottonwood Shores Airbnb Performance Metrics Overview
Monthly Airbnb Revenue Variations & Income Potential in Cottonwood Shores (2026)
Understanding the monthly revenue variations for Airbnb listings in Cottonwood Shores is key to maximizing your short term rental income potential. Seasonality significantly impacts earnings. Our analysis, based on data from the past 12 months, shows that the peak revenue month for STRs in Cottonwood Shores is typically June, while February often presents the lowest earnings, highlighting opportunities for strategic pricing adjustments during shoulder and low seasons. Explore the typical Airbnb income in Cottonwood Shores across different performance tiers:
- Best-in-class properties (Top 10%) achieve $14,049+ monthly, often utilizing dynamic pricing and superior guest experiences.
- Strong performing properties (Top 25%) earn $5,774 or more, indicating effective management and desirable locations/amenities.
- Typical properties (Median) generate around $3,289 per month, representing the average market performance.
- Entry-level properties (Bottom 25%) see earnings around $1,548, often with potential for optimization.
Average Monthly Airbnb Earnings Trend in Cottonwood Shores
Cottonwood Shores Airbnb Occupancy Rate Trends (2026)
Maximize your bookings by understanding the Cottonwood Shores STR occupancy trends. Seasonal demand shifts significantly influence how often properties are booked. Typically, Junesees the highest demand (peak season occupancy), while September experiences the lowest (low season). Effective strategies, like adjusting minimum stays or offering promotions, can boost occupancy during slower periods. Here's how different property tiers perform in Cottonwood Shores:
- Best-in-class properties (Top 10%) achieve 76%+ occupancy, indicating high desirability and potentially optimized availability.
- Strong performing properties (Top 25%) maintain 54% or higher occupancy, suggesting good market fit and guest satisfaction.
- Typical properties (Median) have an occupancy rate around 34%.
- Entry-level properties (Bottom 25%) average 17% occupancy, potentially facing higher vacancy.
Average Monthly Occupancy Rate Trend in Cottonwood Shores
Average Daily Rate (ADR) Airbnb Trends in Cottonwood Shores (2026)
Effective short term rental pricing strategy in Cottonwood Shores involves understanding monthly ADR fluctuations. The Average Daily Rate (ADR) for Airbnb in Cottonwood Shores typically peaks in June and dips lowest during February. Leveraging Airbnb dynamic pricing tools or strategies based on this seasonality can significantly boost revenue. Here's a look at the typical nightly rates achieved:
- Best-in-class properties (Top 10%) command rates of $914+ per night, often due to premium features or locations.
- Strong performing properties (Top 25%) achieve nightly rates of $411 or more.
- Typical properties (Median) charge around $251 per night.
- Entry-level properties (Bottom 25%) earn around $188 per night.
Average Daily Rate (ADR) Trend by Month in Cottonwood Shores
Get Live Cottonwood Shores Market Intelligence 👇

Explore Real-time Analytics
Airbnb Seasonality Analysis & Trends in Cottonwood Shores (2026)
Peak Season (June, May, July)
- Revenue averages $7,160 per month
- Occupancy rates average 44.0%
- Daily rates average $421
Shoulder Season
- Revenue averages $5,117 per month
- Occupancy maintains around 37.7%
- Daily rates hold near $405
Low Season (January, February, April)
- Revenue drops to average $3,043 per month
- Occupancy decreases to average 34.1%
- Daily rates adjust to average $350
Seasonality Insights for Cottonwood Shores
- The Airbnb seasonality in Cottonwood Shores shows highly seasonal trends requiring careful strategy. While the sections above show seasonal averages, it's also insightful to look at the extremes:
- During the high season, the absolute peak month showcases Cottonwood Shores's highest earning potential, with monthly revenues capable of climbing to $7,955, occupancy reaching a high of 45.9%, and ADRs peaking at $436.
- Conversely, the slowest single month of the year, typically falling within the low season, marks the market's lowest point. In this month, revenue might dip to $2,335, occupancy could drop to 29.8%, and ADRs may adjust down to $316.
- Understanding both the seasonal averages and these monthly peaks and troughs in revenue, occupancy, and ADR is crucial for maximizing your Airbnb profit potential in Cottonwood Shores.
Seasonal Strategies for Maximizing Profit
- Peak Season: Maximize revenue through premium pricing and potentially longer minimum stays. Ensure high availability.
- Low Season: Offer competitive pricing, special promotions (e.g., extended stay discounts), and flexible cancellation policies. Target off-season travelers like remote workers or budget-conscious guests.
- Shoulder Seasons: Implement dynamic pricing that balances peak and low rates. Target weekend travelers or specific events. Offer slightly more flexible terms than peak season.
- Regularly analyze your own performance against these Cottonwood Shores seasonality benchmarks and adjust your pricing and availability strategy accordingly.
Best Areas for Airbnb Investment in Cottonwood Shores (2026)
Exploring the top neighborhoods for short-term rentals in Cottonwood Shores? This section highlights key areas, outlining why they are attractive for hosts and guests, along with notable local attractions. Consider these locations based on your target guest profile and investment strategy.
| Neighborhood / Area | Why Host Here? (Target Guests & Appeal) | Key Attractions & Landmarks |
|---|---|---|
| Lakefront Area | Scenic area along Lake Marble Falls, perfect for visitors seeking outdoor recreation and relaxation by the water. Ideal for families and nature lovers. | Lake Marble Falls, Waterfront Parks, Fishing and boating, Hiking trails, Picnic areas |
| Cottonwood Shores Park | A community park that attracts families and visitors looking to enjoy outdoor activities, making it a great spot for short-term rentals. | Playgrounds, Sports facilities, Walking trails, Picnic spots |
| Hill Country Wine Region | Famous for its vineyards and wineries, attracting tourists interested in wine tours and tastings. Perfect for couples and wine enthusiasts. | Wine tours, Tasting rooms, Beautiful vineyards, Local dining options, Scenic drives |
| Marble Falls Downtown | The heart of Marble Falls, featuring local shops, restaurants, and cultural events. It's attractive for visitors looking to experience local charm. | Local shops, Dining options, Festivals, Live music, Art galleries |
| Horseshoe Bay | Known for its resorts and golf courses, it draws in visitors looking for a luxurious experience near the water. Popular with vacationers and golf lovers. | Golf courses, Luxury resorts, Lake activities, Spa and wellness centers |
| Balcones Canyonlands | A natural area with hiking and birdwatching opportunities, appealing to outdoor enthusiasts and nature lovers seeking tranquility and adventure. | Hiking trails, Birdwatching, Wildlife observation, Scenic views |
| Longhorn Cavern State Park | A unique geological attraction that appeals to tourists interested in beauty and nature, great for family outings and educational trips. | Cave tours, Historic sites, Scenic picnic areas |
| Local Restaurants and Cafes | Cottonwood Shores and nearby Marble Falls have a collection of eateries that attract food lovers. Convenient for guests looking to explore local cuisine. | Local cuisine, Food festivals, Dine-in experiences, Bakeries |
Understanding Airbnb License Requirements & STR Laws in Cottonwood Shores (2026)
While Cottonwood Shores, Texas, United States currently shows low STR regulations, specific Airbnb license requirements might still exist or change. Always verify the latest short term rental regulations and Airbnb license requirements directly with local government authorities for Cottonwood Shores to ensure full compliance before hosting.
(Source: AirROI data, 2026, finding no licensed listings among those analyzed)
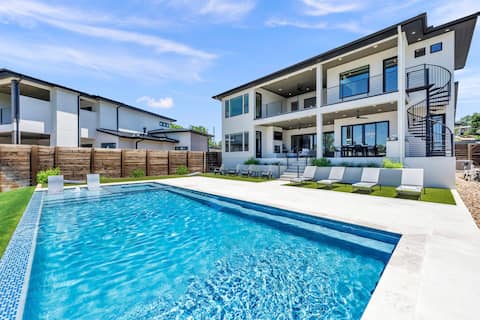
Top Performing Airbnb Properties in Cottonwood Shores (2026)
Benchmark your potential! Explore examples of top-performing Airbnb properties in Cottonwood Shoresbased on Trailing Twelve Month (TTM) revenue. Analyze their characteristics, revenue, occupancy rate, and ADR to understand what drives success in this market.
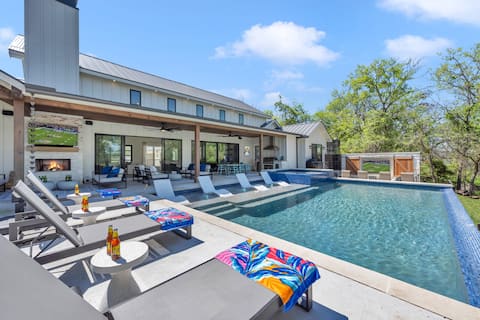
Lakeview Landing | Concierge Services
Entire Place • 6 bedrooms
The Captain's Cove at 110 | Concierge Services
Entire Place • 4 bedrooms

Luxury 7BR Villa w/ Pool, Hot Tub & Near Lake LBJ
Entire Place • 7 bedrooms

Captain's Cove Retreat | Concierge Services
Entire Place • 4 bedrooms

Pet-Friendly Lake House w/ Sunset Views & Kayaks
Entire Place • 3 bedrooms
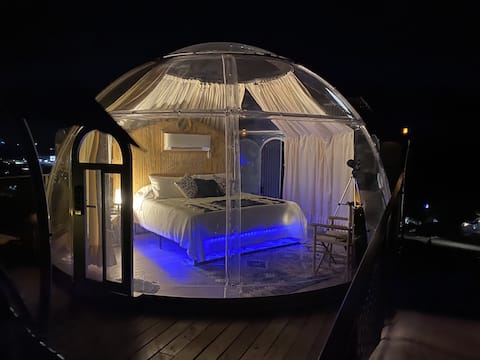
Retreat on the Hill: Stardome Suite Epic 360 Views
Entire Place • 1 bedroom
Note: Performance varies based on location, size, amenities, seasonality, and management quality. Data reflects the past 12 months.
Top Performing Airbnb Hosts in Cottonwood Shores (2026)
Learn from the best! This table showcases top-performing Airbnb hosts in Cottonwood Shores based on the number of properties managed and estimated total revenue over the past year. Analyze their scale and performance metrics.
| Host Name | Properties | Grossing Revenue | Stay Reviews | Avg Rating |
|---|---|---|---|---|
| Horseshoe Bay Living | 3 | $490,100 | 70 | 4.95/5.0 |
| Brooks | 1 | $149,023 | 13 | 5.00/5.0 |
| Sonia | 4 | $111,912 | 51 | 4.88/5.0 |
| Sonia | 5 | $102,276 | 123 | 4.80/5.0 |
| Hana | 1 | $76,603 | 107 | 4.92/5.0 |
| LaRae | 1 | $60,076 | 230 | 4.98/5.0 |
| Joshua | 1 | $52,474 | 93 | 4.85/5.0 |
| Grand Welcome Austin And Highl | 3 | $48,464 | 10 | 4.67/5.0 |
| Diana | 1 | $46,083 | 54 | 5.00/5.0 |
| Angela | 1 | $35,222 | 116 | 4.92/5.0 |
Analyzing the strategies of top hosts, such as their property selection, pricing, and guest communication, can offer valuable lessons for optimizing your own Airbnb operations in Cottonwood Shores.
Dive Deeper: Advanced Cottonwood Shores STR Market Data (2026)
Ready to unlock more insights? AirROI provides access to advanced metrics and comprehensive Airbnb data for Cottonwood Shores. Explore detailed analytics beyond this report to refine your investment strategy, optimize pricing, and maximize your vacation rental profits.
Explore Advanced MetricsCottonwood Shores Short-Term Rental Market Composition (2026): Property & Room Types
Room Type Distribution
Property Type Distribution
Market Composition Insights for Cottonwood Shores
- The Cottonwood Shores Airbnb market composition is heavily skewed towards Entire Home/Apt listings, which make up 100% of the 26 active rentals. This indicates strong guest preference for privacy and space.
- Looking at the property type distribution in Cottonwood Shores, House properties are the most common (57.7%), reflecting the local real estate landscape.
- Houses represent a significant 57.7% portion, catering likely to families or larger groups.
- Smaller segments like apartment/condo (combined 3.8%) offer potential for unique stay experiences.
Cottonwood Shores Airbnb Room Capacity Analysis (2026): Bedroom Distribution
Distribution of Listings by Number of Bedrooms
Room Capacity Insights for Cottonwood Shores
- The dominant room capacity in Cottonwood Shores is 1 bedroom listings, making up 34.6% of the market. This suggests a strong demand for properties suitable for couples or solo travelers.
- Together, 1 bedroom and 3 bedrooms properties represent 65.4% of the active Airbnb listings in Cottonwood Shores, indicating a high concentration in these sizes.
- A significant 50.0% of listings offer 3+ bedrooms, catering to larger groups and families seeking more space in Cottonwood Shores.
Cottonwood Shores Vacation Rental Guest Capacity Trends (2026)
Distribution of Listings by Guest Capacity
Guest Capacity Insights for Cottonwood Shores
- The most common guest capacity trend in Cottonwood Shores vacation rentals is listings accommodating 8+ guests (42.3%). This suggests the primary traveler segment is likely larger groups.
- Properties designed for 8+ guests and 2 guests dominate the Cottonwood Shores STR market, accounting for 65.4% of listings.
- 57.7% of properties accommodate 6+ guests, serving the market segment for larger families or group travel in Cottonwood Shores.
- On average, properties in Cottonwood Shores are equipped to host 5.5 guests.
Cottonwood Shores Airbnb Booking Patterns (2026): Available vs. Booked Days
Available Days Distribution
Booked Days Distribution
Booking Pattern Insights for Cottonwood Shores
- The most common availability pattern in Cottonwood Shores falls within the 271-366 days range, representing 57.7% of listings. This suggests many properties have significant open periods on their calendars.
- Approximately 80.8% of listings show high availability (181+ days open annually), indicating potential for increased bookings or specific owner usage patterns.
- For booked days, the 31-90 days range is most frequent in Cottonwood Shores (34.6%), reflecting common guest stay durations or potential owner blocking patterns.
- A notable 19.2% of properties secure long booking periods (181+ days booked per year), highlighting successful long-term rental strategies or significant owner usage.
Cottonwood Shores Airbnb Minimum Stay Requirements Analysis
Distribution of Listings by Minimum Night Requirement
1 Night
10 listings
38.5% of total
2 Nights
9 listings
34.6% of total
30+ Nights
7 listings
26.9% of total
Key Insights
- The most prevalent minimum stay requirement in Cottonwood Shores is 1 Night, adopted by 38.5% of listings. This highlights the market's preference for shorter, flexible bookings.
- A strong majority (73.1%) of the Cottonwood Shores Airbnb data shows acceptance of very short stays (1-2 nights), indicating a dynamic, high-turnover market.
- A significant segment (26.9%) caters to monthly stays (30+ nights) in Cottonwood Shores, pointing to opportunities in the extended-stay market.
Recommendations
- Align with the market by considering a 1 Night minimum stay, as 38.5% of Cottonwood Shores hosts use this setting.
- Explore offering discounts for stays of 30+ nights to attract the 26.9% of the market seeking extended stays.
- Adjust minimum nights based on seasonality – potentially shorter during low season and longer during peak demand periods in Cottonwood Shores.
Cottonwood Shores Airbnb Cancellation Policy Trends Analysis (2026)
Limited
1 listings
3.8% of total
Flexible
4 listings
15.4% of total
Moderate
4 listings
15.4% of total
Firm
10 listings
38.5% of total
Strict
7 listings
26.9% of total
Cancellation Policy Insights for Cottonwood Shores
- The prevailing Airbnb cancellation policy trend in Cottonwood Shores is Firm, used by 38.5% of listings.
- A majority (65.4%) of hosts in Cottonwood Shores utilize Firm or Strict policies, indicating a market where hosts prioritize booking security.
Recommendations for Hosts
- Consider adopting a Firm policy to align with the 38.5% market standard in Cottonwood Shores.
- Regularly review your cancellation policy against competitors and market demand shifts in Cottonwood Shores.
Cottonwood Shores STR Booking Lead Time Analysis (2026)
Average Booking Lead Time by Month
Booking Lead Time Insights for Cottonwood Shores
- The overall average booking lead time for vacation rentals in Cottonwood Shores is 49 days.
- Guests book furthest in advance for stays during September (average 56 days), likely coinciding with peak travel demand or local events.
- The shortest booking windows occur for stays in December (average 30 days), indicating more last-minute travel plans during this time.
- Seasonally, Fall (54 days avg.) sees the longest lead times, while Summer (39 days avg.) has the shortest, reflecting typical travel planning cycles.
Recommendations for Hosts
- Use the overall average lead time (49 days) as a baseline for your pricing and availability strategy in Cottonwood Shores.
- Target marketing efforts for the Fall season well in advance (at least 54 days) to capture early planners.
- Monitor your own booking lead times against these Cottonwood Shores averages to identify opportunities for dynamic pricing adjustments.
Popular & Essential Airbnb Amenities in Cottonwood Shores (2026)
Amenity Prevalence
Amenity Insights for Cottonwood Shores
- Essential amenities in Cottonwood Shores that guests expect include: Microwave, Air conditioning, Hot water, Shampoo, Bed linens, Wifi, Refrigerator. Lacking these (any) could significantly impact bookings.
- Popular amenities like Essentials, Coffee maker, Smoke alarm are common but not universal. Offering these can provide a competitive edge.
Recommendations for Hosts
- Ensure your listing includes all essential amenities for Cottonwood Shores: Microwave, Air conditioning, Hot water, Shampoo, Bed linens, Wifi, Refrigerator.
- Prioritize adding missing essentials: Shampoo, Bed linens, Wifi, Refrigerator.
- Consider adding popular differentiators like Essentials or Coffee maker to increase appeal.
- Highlight unique or less common amenities you offer (e.g., hot tub, dedicated workspace, EV charger) in your listing description and photos.
- Regularly check competitor amenities in Cottonwood Shores to stay competitive.
Cottonwood Shores Airbnb Guest Demographics & Profile Analysis (2026)
Guest Profile Summary for Cottonwood Shores
- The typical guest profile for Airbnb in Cottonwood Shores consists of primarily domestic travelers (99%), often arriving from nearby Austin, typically belonging to the Post-2000s (Gen Z/Alpha) group (50%), primarily speaking English or Spanish.
- Domestic travelers account for 99.4% of guests.
- Key international markets include United States (99.4%) and Canada (0.6%).
- Top languages spoken are English (73.2%) followed by Spanish (21.1%).
- A significant demographic segment is the Post-2000s (Gen Z/Alpha) group, representing 50% of guests.
Recommendations for Hosts
- Target domestic marketing efforts towards travelers from Austin and San Antonio.
- Tailor amenities and listing descriptions to appeal to the dominant Post-2000s (Gen Z/Alpha) demographic (e.g., highlight fast WiFi, smart home features, local guides).
- Highlight unique local experiences or amenities relevant to the primary guest profile.
- Consider seasonal promotions aligned with peak travel times for key origin markets.
Nearby Short-Term Rental Market Comparison
How does the Cottonwood Shores Airbnb market stack up against its neighbors? Compare key performance metrics like average monthly revenue, ADR, and occupancy rates in surrounding areas to understand the broader regional STR landscape.
| Market | Active Properties | Monthly Revenue | Daily Rate | Avg. Occupancy |
|---|---|---|---|---|
| Hudson Bend | 59 | $5,436 | $611.45 | 31% |
| Jonestown | 60 | $5,240 | $513.31 | 32% |
| Gillespie County | 11 | $4,887 | $351.24 | 59% |
| West Lake Hills | 21 | $4,391 | $656.35 | 34% |
| Helotes | 48 | $4,095 | $322.31 | 42% |
| Kingsland | 255 | $4,055 | $564.92 | 27% |
| Round Mountain | 17 | $3,781 | $385.24 | 42% |
| Volente | 19 | $3,627 | $462.89 | 30% |
| Dripping Springs | 403 | $3,493 | $389.50 | 32% |
| Briarcliff | 34 | $3,429 | $422.87 | 28% |