Corsicana Airbnb Market Analysis 2026: Short Term Rental Data & Vacation Rental Statistics in Texas, United States
Is Airbnb profitable in Corsicana in 2026? Explore comprehensive Airbnb analytics for Corsicana, Texas, United States to uncover income potential. This 2026 STR market report for Corsicana, based on AirROI data from February 2025 to January 2026, reveals key trends in the niche market of 31 active listings.
Whether you're considering an Airbnb investment in Corsicana, optimizing your existing vacation rental, or exploring rental arbitrage opportunities, understanding the Corsicana Airbnb data is crucial. Leveraging the low regulation environment is key to maximizing your short term rental income potential. Let's dive into the specifics.
Key Corsicana Airbnb Performance Metrics Overview
Monthly Airbnb Revenue Variations & Income Potential in Corsicana (2026)
Understanding the monthly revenue variations for Airbnb listings in Corsicana is key to maximizing your short term rental income potential. Seasonality significantly impacts earnings. Our analysis, based on data from the past 12 months, shows that the peak revenue month for STRs in Corsicana is typically July, while February often presents the lowest earnings, highlighting opportunities for strategic pricing adjustments during shoulder and low seasons. Explore the typical Airbnb income in Corsicana across different performance tiers:
- Best-in-class properties (Top 10%) achieve $5,885+ monthly, often utilizing dynamic pricing and superior guest experiences.
- Strong performing properties (Top 25%) earn $3,399 or more, indicating effective management and desirable locations/amenities.
- Typical properties (Median) generate around $1,978 per month, representing the average market performance.
- Entry-level properties (Bottom 25%) see earnings around $1,056, often with potential for optimization.
Average Monthly Airbnb Earnings Trend in Corsicana
Corsicana Airbnb Occupancy Rate Trends (2026)
Maximize your bookings by understanding the Corsicana STR occupancy trends. Seasonal demand shifts significantly influence how often properties are booked. Typically, Junesees the highest demand (peak season occupancy), while November experiences the lowest (low season). Effective strategies, like adjusting minimum stays or offering promotions, can boost occupancy during slower periods. Here's how different property tiers perform in Corsicana:
- Best-in-class properties (Top 10%) achieve 85%+ occupancy, indicating high desirability and potentially optimized availability.
- Strong performing properties (Top 25%) maintain 63% or higher occupancy, suggesting good market fit and guest satisfaction.
- Typical properties (Median) have an occupancy rate around 41%.
- Entry-level properties (Bottom 25%) average 22% occupancy, potentially facing higher vacancy.
Average Monthly Occupancy Rate Trend in Corsicana
Average Daily Rate (ADR) Airbnb Trends in Corsicana (2026)
Effective short term rental pricing strategy in Corsicana involves understanding monthly ADR fluctuations. The Average Daily Rate (ADR) for Airbnb in Corsicana typically peaks in October and dips lowest during April. Leveraging Airbnb dynamic pricing tools or strategies based on this seasonality can significantly boost revenue. Here's a look at the typical nightly rates achieved:
- Best-in-class properties (Top 10%) command rates of $311+ per night, often due to premium features or locations.
- Strong performing properties (Top 25%) achieve nightly rates of $229 or more.
- Typical properties (Median) charge around $155 per night.
- Entry-level properties (Bottom 25%) earn around $99 per night.
Average Daily Rate (ADR) Trend by Month in Corsicana
Get Live Corsicana Market Intelligence 👇

Explore Real-time Analytics
Airbnb Seasonality Analysis & Trends in Corsicana (2026)
Peak Season (July, June, January)
- Revenue averages $3,432 per month
- Occupancy rates average 50.7%
- Daily rates average $172
Shoulder Season
- Revenue averages $2,643 per month
- Occupancy maintains around 43.8%
- Daily rates hold near $183
Low Season (February, April, May)
- Revenue drops to average $1,776 per month
- Occupancy decreases to average 38.8%
- Daily rates adjust to average $148
Seasonality Insights for Corsicana
- The Airbnb seasonality in Corsicana shows highly seasonal trends requiring careful strategy. While the sections above show seasonal averages, it's also insightful to look at the extremes:
- During the high season, the absolute peak month showcases Corsicana's highest earning potential, with monthly revenues capable of climbing to $3,513, occupancy reaching a high of 58.4%, and ADRs peaking at $203.
- Conversely, the slowest single month of the year, typically falling within the low season, marks the market's lowest point. In this month, revenue might dip to $1,605, occupancy could drop to 34.1%, and ADRs may adjust down to $146.
- Understanding both the seasonal averages and these monthly peaks and troughs in revenue, occupancy, and ADR is crucial for maximizing your Airbnb profit potential in Corsicana.
Seasonal Strategies for Maximizing Profit
- Peak Season: Maximize revenue through premium pricing and potentially longer minimum stays. Ensure high availability.
- Low Season: Offer competitive pricing, special promotions (e.g., extended stay discounts), and flexible cancellation policies. Target off-season travelers like remote workers or budget-conscious guests.
- Shoulder Seasons: Implement dynamic pricing that balances peak and low rates. Target weekend travelers or specific events. Offer slightly more flexible terms than peak season.
- Regularly analyze your own performance against these Corsicana seasonality benchmarks and adjust your pricing and availability strategy accordingly.
Best Areas for Airbnb Investment in Corsicana (2026)
Exploring the top neighborhoods for short-term rentals in Corsicana? This section highlights key areas, outlining why they are attractive for hosts and guests, along with notable local attractions. Consider these locations based on your target guest profile and investment strategy.
| Neighborhood / Area | Why Host Here? (Target Guests & Appeal) | Key Attractions & Landmarks |
|---|---|---|
| Historic Downtown Corsicana | Charming area with a rich history, featuring unique shops and cafes. Ideal for visitors wanting to explore local culture and history, with events held throughout the year. | Corsicana Cultural Arts District, Navarro County Courthouse, Leslie Greening Park, Corsicana Historic District, The Palace Theatre |
| Lake Halbert | Beautiful natural area perfect for outdoor enthusiasts. Offers fishing, boating, and camping opportunities, appealing to families and nature lovers visiting Corsicana. | Lake Halbert Park, Fishing and boating activities, Nature trails, Picnic areas |
| Corsicana Community Park | Popular recreational area that draws families and athletes. Great for those looking for outdoor fun and activities, such as sports and picnics. | Sports fields, Walking trails, Playground, Picnic spots, Corsicana's annual events |
| Highway 287 | Strategically located highway offering quick access to Dallas and Fort Worth. Great for travelers seeking a stopover or transit accommodations as they travel through Texas. | Variety of shopping and dining options, Quick access to major routes, Convenient for passing travelers |
| Navarro Mills Lake | Offers a scenic escape with plentiful fishing, boating, and outdoor activities. Ideal for guests looking for a peaceful retreat from city life. | Fishing spots, Camping areas, Hiking trails, Picnic facilities |
| Dining District | Home to some of the best dining spots in Corsicana. Attracts food lovers and tourists interested in local cuisine and dining experiences. | Popular restaurants, Food festivals, Local cafes, Culinary events |
| Corsicana Arts District | Active area showcasing local art and culture. Attracts those interested in the arts, history, and unique local experiences. | Art galleries, Local art events, Community art festivals, Art walks |
| Parks and Recreation Areas | Corsicana is known for its beautiful parks which offer a range of outdoor activities. Ideal for family gatherings, picnics, and outdoor fun. | Corsicana City Park, Cypress Creek Park, Walking trails, Playground equipment |
Understanding Airbnb License Requirements & STR Laws in Corsicana (2026)
While Corsicana, Texas, United States currently shows low STR regulations, specific Airbnb license requirements might still exist or change. Always verify the latest short term rental regulations and Airbnb license requirements directly with local government authorities for Corsicana to ensure full compliance before hosting.
(Source: AirROI data, 2026, finding no licensed listings among those analyzed)
Top Performing Airbnb Properties in Corsicana (2026)
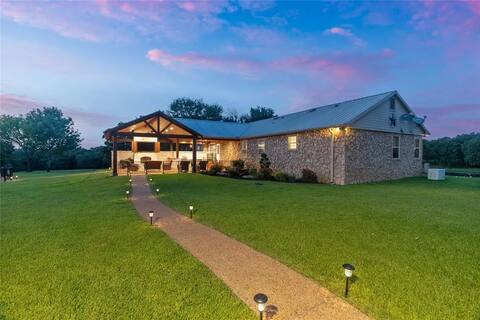
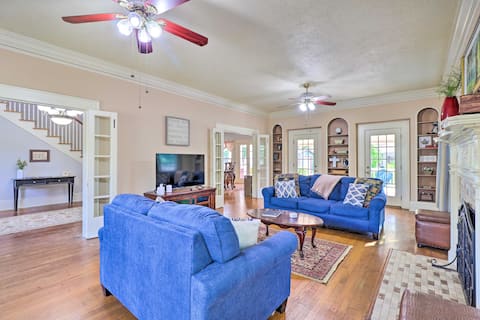
Benchmark your potential! Explore examples of top-performing Airbnb properties in Corsicanabased on Trailing Twelve Month (TTM) revenue. Analyze their characteristics, revenue, occupancy rate, and ADR to understand what drives success in this market.
Los Angeles Ranch
Entire Place • 4 bedrooms
King Size Comfort in Rustic Ranch Hideaway
Entire Place • 4 bedrooms
1920s Corsicana Home: Group Getaway Near Downtown!
Entire Place • 4 bedrooms

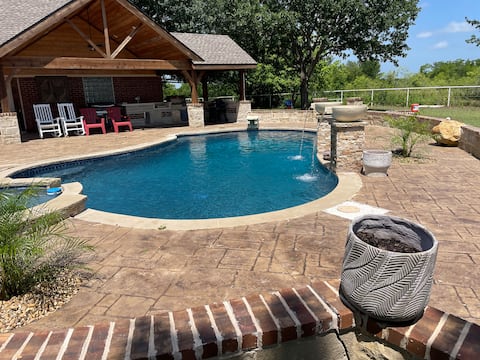
Tranquil Lakefront Retreat Boat Dock Fish Fire pit
Entire Place • 2 bedrooms

Eve’s Landing 6-Bed Oasis with Media & Game Room
Entire Place • 4 bedrooms

Lakeshore Escape (Pool & Lake) 2 KING BED sleeps 8
Entire Place • 2 bedrooms
Note: Performance varies based on location, size, amenities, seasonality, and management quality. Data reflects the past 12 months.
Top Performing Airbnb Hosts in Corsicana (2026)
Learn from the best! This table showcases top-performing Airbnb hosts in Corsicana based on the number of properties managed and estimated total revenue over the past year. Analyze their scale and performance metrics.
| Host Name | Properties | Grossing Revenue | Stay Reviews | Avg Rating |
|---|---|---|---|---|
| Alejandro | 1 | $95,071 | 48 | 4.85/5.0 |
| The Woods RV And Cabin Resort | 2 | $62,615 | 15 | 4.92/5.0 |
| Betina | 4 | $50,714 | 418 | 4.91/5.0 |
| Kathleen | 2 | $48,347 | 108 | 4.96/5.0 |
| Evolve | 1 | $41,745 | 44 | 4.84/5.0 |
| Green | 1 | $37,900 | 46 | 4.80/5.0 |
| Vendi | 1 | $34,989 | 20 | 4.85/5.0 |
| Guerly | 3 | $33,764 | 101 | 4.71/5.0 |
| Jason | 1 | $33,562 | 46 | 4.98/5.0 |
| Susie | 1 | $32,322 | 125 | 4.98/5.0 |
Analyzing the strategies of top hosts, such as their property selection, pricing, and guest communication, can offer valuable lessons for optimizing your own Airbnb operations in Corsicana.
Dive Deeper: Advanced Corsicana STR Market Data (2026)
Ready to unlock more insights? AirROI provides access to advanced metrics and comprehensive Airbnb data for Corsicana. Explore detailed analytics beyond this report to refine your investment strategy, optimize pricing, and maximize your vacation rental profits.
Explore Advanced MetricsCorsicana Short-Term Rental Market Composition (2026): Property & Room Types
Room Type Distribution
Property Type Distribution
Market Composition Insights for Corsicana
- The Corsicana Airbnb market composition is heavily skewed towards Entire Home/Apt listings, which make up 96.8% of the 31 active rentals. This indicates strong guest preference for privacy and space.
- Looking at the property type distribution in Corsicana, House properties are the most common (54.8%), reflecting the local real estate landscape.
- Houses represent a significant 54.8% portion, catering likely to families or larger groups.
- Smaller segments like others (combined 3.2%) offer potential for unique stay experiences.
Corsicana Airbnb Room Capacity Analysis (2026): Bedroom Distribution
Distribution of Listings by Number of Bedrooms
Room Capacity Insights for Corsicana
- The dominant room capacity in Corsicana is 2 bedrooms listings, making up 38.7% of the market. This suggests a strong demand for properties suitable for couples or solo travelers.
- Together, 2 bedrooms and 3 bedrooms properties represent 58.1% of the active Airbnb listings in Corsicana, indicating a high concentration in these sizes.
- A significant 38.7% of listings offer 3+ bedrooms, catering to larger groups and families seeking more space in Corsicana.
Corsicana Vacation Rental Guest Capacity Trends (2026)
Distribution of Listings by Guest Capacity
Guest Capacity Insights for Corsicana
- The most common guest capacity trend in Corsicana vacation rentals is listings accommodating 8+ guests (29%). This suggests the primary traveler segment is likely larger groups.
- Properties designed for 8+ guests and 6 guests dominate the Corsicana STR market, accounting for 51.6% of listings.
- 54.8% of properties accommodate 6+ guests, serving the market segment for larger families or group travel in Corsicana.
- On average, properties in Corsicana are equipped to host 5.3 guests.
Corsicana Airbnb Booking Patterns (2026): Available vs. Booked Days
Available Days Distribution
Booked Days Distribution
Booking Pattern Insights for Corsicana
- The most common availability pattern in Corsicana falls within the 181-270 days range, representing 67.7% of listings. This suggests many properties have significant open periods on their calendars.
- Approximately 87.1% of listings show high availability (181+ days open annually), indicating potential for increased bookings or specific owner usage patterns.
- For booked days, the 91-180 days range is most frequent in Corsicana (67.7%), reflecting common guest stay durations or potential owner blocking patterns.
- A notable 12.9% of properties secure long booking periods (181+ days booked per year), highlighting successful long-term rental strategies or significant owner usage.
Corsicana Airbnb Minimum Stay Requirements Analysis
Distribution of Listings by Minimum Night Requirement
1 Night
13 listings
41.9% of total
2 Nights
12 listings
38.7% of total
4-6 Nights
1 listings
3.2% of total
7-29 Nights
2 listings
6.5% of total
30+ Nights
3 listings
9.7% of total
Key Insights
- The most prevalent minimum stay requirement in Corsicana is 1 Night, adopted by 41.9% of listings. This highlights the market's preference for shorter, flexible bookings.
- A strong majority (80.6%) of the Corsicana Airbnb data shows acceptance of very short stays (1-2 nights), indicating a dynamic, high-turnover market.
Recommendations
- Align with the market by considering a 1 Night minimum stay, as 41.9% of Corsicana hosts use this setting.
- Explore offering discounts for stays of 30+ nights to attract the 9.7% of the market seeking extended stays.
- Adjust minimum nights based on seasonality – potentially shorter during low season and longer during peak demand periods in Corsicana.
Corsicana Airbnb Cancellation Policy Trends Analysis (2026)
Flexible
4 listings
12.9% of total
Moderate
7 listings
22.6% of total
Firm
12 listings
38.7% of total
Strict
8 listings
25.8% of total
Cancellation Policy Insights for Corsicana
- The prevailing Airbnb cancellation policy trend in Corsicana is Firm, used by 38.7% of listings.
- A majority (64.5%) of hosts in Corsicana utilize Firm or Strict policies, indicating a market where hosts prioritize booking security.
Recommendations for Hosts
- Consider adopting a Firm policy to align with the 38.7% market standard in Corsicana.
- Regularly review your cancellation policy against competitors and market demand shifts in Corsicana.
Corsicana STR Booking Lead Time Analysis (2026)
Average Booking Lead Time by Month
Booking Lead Time Insights for Corsicana
- The overall average booking lead time for vacation rentals in Corsicana is 27 days.
- Guests book furthest in advance for stays during May (average 52 days), likely coinciding with peak travel demand or local events.
- The shortest booking windows occur for stays in February (average 7 days), indicating more last-minute travel plans during this time.
- Seasonally, Fall (31 days avg.) sees the longest lead times, while Winter (16 days avg.) has the shortest, reflecting typical travel planning cycles.
Recommendations for Hosts
- Use the overall average lead time (27 days) as a baseline for your pricing and availability strategy in Corsicana.
- For May stays, consider implementing length-of-stay discounts or slightly higher rates for bookings made less than 52 days out to capitalize on advance planning.
- During February, focus on last-minute booking availability and promotions, as guests book with very short notice (7 days avg.).
- Target marketing efforts for the Fall season well in advance (at least 31 days) to capture early planners.
- Monitor your own booking lead times against these Corsicana averages to identify opportunities for dynamic pricing adjustments.
Popular & Essential Airbnb Amenities in Corsicana (2026)
Amenity Prevalence
Amenity Insights for Corsicana
- Essential amenities in Corsicana that guests expect include: TV, Air conditioning. Lacking these (any) could significantly impact bookings.
- Popular amenities like Smoke alarm, Free parking on premises, Heating are common but not universal. Offering these can provide a competitive edge.
- Warning: Wifi is not universally provided but is considered essential globally. Ensure reliable Wifi is offered.
Recommendations for Hosts
- Ensure your listing includes all essential amenities for Corsicana: TV, Air conditioning.
- Prioritize adding missing essentials: TV, Air conditioning.
- Consider adding popular differentiators like Smoke alarm or Free parking on premises to increase appeal.
- Highlight unique or less common amenities you offer (e.g., hot tub, dedicated workspace, EV charger) in your listing description and photos.
- Regularly check competitor amenities in Corsicana to stay competitive.
Corsicana Airbnb Guest Demographics & Profile Analysis (2026)
Guest Profile Summary for Corsicana
- The typical guest profile for Airbnb in Corsicana consists of primarily domestic travelers (98%), often arriving from nearby Dallas, typically belonging to the Post-2000s (Gen Z/Alpha) group (50%), primarily speaking English or Spanish.
- Domestic travelers account for 97.8% of guests.
- Key international markets include United States (97.8%) and Germany (0.9%).
- Top languages spoken are English (77.4%) followed by Spanish (12.1%).
- A significant demographic segment is the Post-2000s (Gen Z/Alpha) group, representing 50% of guests.
Recommendations for Hosts
- Target domestic marketing efforts towards travelers from Dallas and Houston.
- Tailor amenities and listing descriptions to appeal to the dominant Post-2000s (Gen Z/Alpha) demographic (e.g., highlight fast WiFi, smart home features, local guides).
- Highlight unique local experiences or amenities relevant to the primary guest profile.
- Consider seasonal promotions aligned with peak travel times for key origin markets.
Nearby Short-Term Rental Market Comparison
How does the Corsicana Airbnb market stack up against its neighbors? Compare key performance metrics like average monthly revenue, ADR, and occupancy rates in surrounding areas to understand the broader regional STR landscape.
| Market | Active Properties | Monthly Revenue | Daily Rate | Avg. Occupancy |
|---|---|---|---|---|
| Star Harbor | 11 | $5,474 | $741.72 | 33% |
| Valley View | 25 | $5,111 | $484.73 | 39% |
| Bluff Dale | 18 | $4,063 | $411.68 | 29% |
| Red Oak | 17 | $3,978 | $288.35 | 50% |
| DeSoto | 29 | $3,947 | $332.58 | 47% |
| Holly Lake Ranch | 11 | $3,836 | $358.93 | 36% |
| Flower Mound | 79 | $3,760 | $326.24 | 45% |
| Azle | 62 | $3,533 | $323.80 | 41% |
| Westworth Village | 11 | $3,530 | $240.30 | 48% |
| Highland Village | 15 | $3,363 | $345.42 | 48% |