Conroe Airbnb Market Analysis 2026: Short Term Rental Data & Vacation Rental Statistics in Texas, United States
Is Airbnb profitable in Conroe in 2026? Explore comprehensive Airbnb analytics for Conroe, Texas, United States to uncover income potential. This 2026 STR market report for Conroe, based on AirROI data from February 2025 to January 2026, reveals key trends in the market of 337 active listings.
Whether you're considering an Airbnb investment in Conroe, optimizing your existing vacation rental, or exploring rental arbitrage opportunities, understanding the Conroe Airbnb data is crucial. Leveraging the low regulation environment is key to maximizing your short term rental income potential. Let's dive into the specifics.
Key Conroe Airbnb Performance Metrics Overview
Monthly Airbnb Revenue Variations & Income Potential in Conroe (2026)
Understanding the monthly revenue variations for Airbnb listings in Conroe is key to maximizing your short term rental income potential. Seasonality significantly impacts earnings. Our analysis, based on data from the past 12 months, shows that the peak revenue month for STRs in Conroe is typically July, while January often presents the lowest earnings, highlighting opportunities for strategic pricing adjustments during shoulder and low seasons. Explore the typical Airbnb income in Conroe across different performance tiers:
- Best-in-class properties (Top 10%) achieve $5,898+ monthly, often utilizing dynamic pricing and superior guest experiences.
- Strong performing properties (Top 25%) earn $3,772 or more, indicating effective management and desirable locations/amenities.
- Typical properties (Median) generate around $2,162 per month, representing the average market performance.
- Entry-level properties (Bottom 25%) see earnings around $1,047, often with potential for optimization.
Average Monthly Airbnb Earnings Trend in Conroe
Conroe Airbnb Occupancy Rate Trends (2026)
Maximize your bookings by understanding the Conroe STR occupancy trends. Seasonal demand shifts significantly influence how often properties are booked. Typically, Marchsees the highest demand (peak season occupancy), while January experiences the lowest (low season). Effective strategies, like adjusting minimum stays or offering promotions, can boost occupancy during slower periods. Here's how different property tiers perform in Conroe:
- Best-in-class properties (Top 10%) achieve 77%+ occupancy, indicating high desirability and potentially optimized availability.
- Strong performing properties (Top 25%) maintain 60% or higher occupancy, suggesting good market fit and guest satisfaction.
- Typical properties (Median) have an occupancy rate around 40%.
- Entry-level properties (Bottom 25%) average 22% occupancy, potentially facing higher vacancy.
Average Monthly Occupancy Rate Trend in Conroe
Average Daily Rate (ADR) Airbnb Trends in Conroe (2026)
Effective short term rental pricing strategy in Conroe involves understanding monthly ADR fluctuations. The Average Daily Rate (ADR) for Airbnb in Conroe typically peaks in December and dips lowest during February. Leveraging Airbnb dynamic pricing tools or strategies based on this seasonality can significantly boost revenue. Here's a look at the typical nightly rates achieved:
- Best-in-class properties (Top 10%) command rates of $382+ per night, often due to premium features or locations.
- Strong performing properties (Top 25%) achieve nightly rates of $261 or more.
- Typical properties (Median) charge around $178 per night.
- Entry-level properties (Bottom 25%) earn around $116 per night.
Average Daily Rate (ADR) Trend by Month in Conroe
Get Live Conroe Market Intelligence 👇

Explore Real-time Analytics
Airbnb Seasonality Analysis & Trends in Conroe (2026)
Peak Season (July, June, October)
- Revenue averages $3,414 per month
- Occupancy rates average 45.5%
- Daily rates average $221
Shoulder Season
- Revenue averages $2,970 per month
- Occupancy maintains around 42.9%
- Daily rates hold near $216
Low Season (January, February, April)
- Revenue drops to average $2,200 per month
- Occupancy decreases to average 38.1%
- Daily rates adjust to average $204
Seasonality Insights for Conroe
- The Airbnb seasonality in Conroe shows moderate seasonality with distinct peak and low periods. While the sections above show seasonal averages, it's also insightful to look at the extremes:
- During the high season, the absolute peak month showcases Conroe's highest earning potential, with monthly revenues capable of climbing to $3,837, occupancy reaching a high of 51.2%, and ADRs peaking at $234.
- Conversely, the slowest single month of the year, typically falling within the low season, marks the market's lowest point. In this month, revenue might dip to $2,005, occupancy could drop to 28.8%, and ADRs may adjust down to $190.
- Understanding both the seasonal averages and these monthly peaks and troughs in revenue, occupancy, and ADR is crucial for maximizing your Airbnb profit potential in Conroe.
Seasonal Strategies for Maximizing Profit
- Peak Season: Maximize revenue through premium pricing and potentially longer minimum stays. Ensure high availability.
- Low Season: Offer competitive pricing, special promotions (e.g., extended stay discounts), and flexible cancellation policies. Target off-season travelers like remote workers or budget-conscious guests.
- Shoulder Seasons: Implement dynamic pricing that balances peak and low rates. Target weekend travelers or specific events. Offer slightly more flexible terms than peak season.
- Regularly analyze your own performance against these Conroe seasonality benchmarks and adjust your pricing and availability strategy accordingly.
Best Areas for Airbnb Investment in Conroe (2026)
Exploring the top neighborhoods for short-term rentals in Conroe? This section highlights key areas, outlining why they are attractive for hosts and guests, along with notable local attractions. Consider these locations based on your target guest profile and investment strategy.
| Neighborhood / Area | Why Host Here? (Target Guests & Appeal) | Key Attractions & Landmarks |
|---|---|---|
| Lake Conroe | A popular destination for those seeking recreational water activities and beautiful lake views. Ideal for families and groups looking to stay near the water for fishing, boating, and relaxing. | Lake Conroe, Stewart Creek Park, Sam Houston National Forest, Lake Livingston State Park, Waterpoint Marina |
| Old Town Conroe | A charming historic district filled with shops, restaurants, and entertainment options. Attracts visitors looking for a quaint, small-town experience with access to local culture and festivals. | Crighton Theatre, Conroe Art Gallery, Local bars and restaurants, Conroe Downtown Historic District |
| Montgomery | Located just a short drive from Conroe, this area is known for its small-town charm and proximity to Lake Conroe. Appeals to visitors seeking a quieter retreat with access to outdoor activities. | Historic Montgomery, Lake Conroe, Nikki's Place, Walden Yacht Club |
| Market Street | An upscale shopping and dining destination in nearby The Woodlands, which draws visitors for its luxury retail and gourmet dining experiences. | Market Street shopping center, The Woodlands Waterway, Woodlands Mall, Cynthia Woods Mitchell Pavilion |
| Conroe Regional Medical Center | An area that attracts many travelers for medical reasons, including those accompanying patients, making short-term rentals in demand. | Conroe Regional Medical Center, Nearby hotels and accommodations, Restaurants and cafes |
| Texas Renaissance Festival | This annual event attracts thousands of visitors, creating a huge demand for short-term rentals in the area during October and November. | Texas Renaissance Festival grounds, Arts and crafts booths, Live entertainment, Themed dining options |
| Sam Houston National Forest | Offering outdoor activities like hiking and camping, this area is ideal for those who want a nature-filled getaway, attracting outdoor enthusiasts and families. | Hiking trails, Campgrounds, Wildlife viewing, Lake Livingston access |
| The Woodlands | A master-planned community close to Conroe, known for its shopping, dining, and business facilities, making it a prime location for Airbnb hosts targeting both leisure and business travelers. | The Woodlands Mall, The Pavilion, The Woodlands Waterway, Adventure Cove |
Understanding Airbnb License Requirements & STR Laws in Conroe (2026)
While Conroe, Texas, United States currently shows low STR regulations, specific Airbnb license requirements might still exist or change. Always verify the latest short term rental regulations and Airbnb license requirements directly with local government authorities for Conroe to ensure full compliance before hosting.
(Source: AirROI data, 2026, based on 1% licensed listings)
Top Performing Airbnb Properties in Conroe (2026)
Benchmark your potential! Explore examples of top-performing Airbnb properties in Conroebased on Trailing Twelve Month (TTM) revenue. Analyze their characteristics, revenue, occupancy rate, and ADR to understand what drives success in this market.
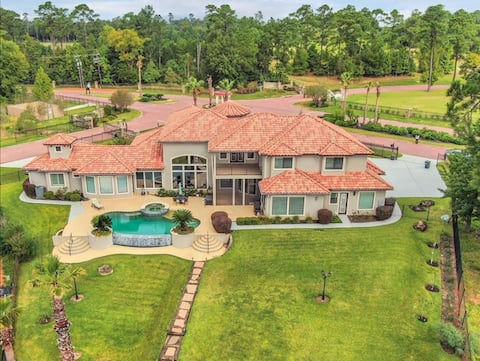
Lake Conroe Waterfront 5BR, Pool/Spa, Boat to Rent
Entire Place • 5 bedrooms
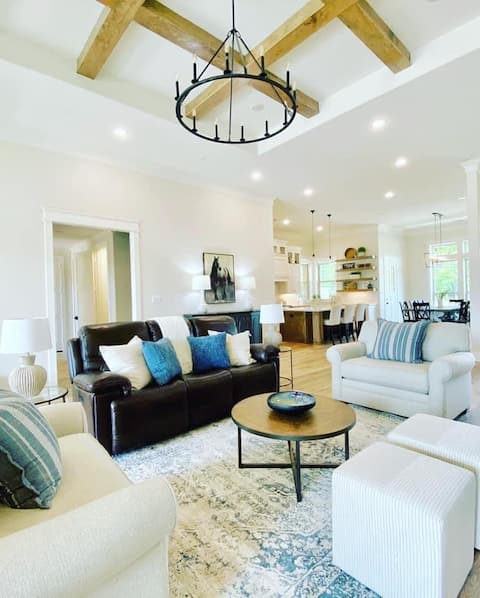
Luxury Retreat-Modern Farmhouse on 5 Acres w/Pool
Entire Place • 5 bedrooms
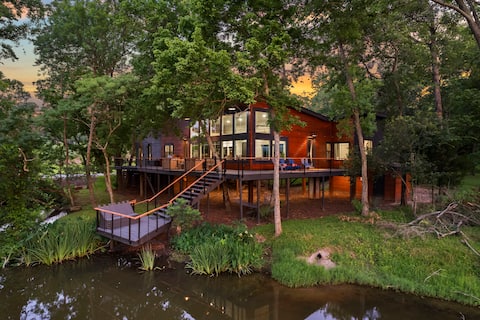
Lux Treehouse: Lake, Views, Gameroom, Kayaks, SUPs
Entire Place • 4 bedrooms

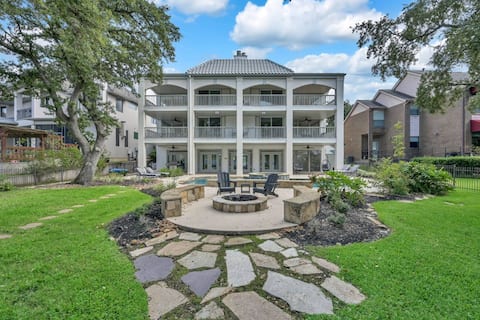
Luxury Farm Stay with Pool - Perfect For Groups
Entire Place • 5 bedrooms
Lux Retreat | Heated Pool, Spa & Ren Fest Nearby
Entire Place • 4 bedrooms

Lakeside Oasis on Golf Course w/ private pool
Entire Place • 4 bedrooms
Note: Performance varies based on location, size, amenities, seasonality, and management quality. Data reflects the past 12 months.
Top Performing Airbnb Hosts in Conroe (2026)
Learn from the best! This table showcases top-performing Airbnb hosts in Conroe based on the number of properties managed and estimated total revenue over the past year. Analyze their scale and performance metrics.
| Host Name | Properties | Grossing Revenue | Stay Reviews | Avg Rating |
|---|---|---|---|---|
| Bonnie | 4 | $366,318 | 372 | 4.94/5.0 |
| Evolve | 14 | $300,820 | 275 | 4.67/5.0 |
| Maria | 1 | $253,846 | 55 | 4.98/5.0 |
| Amy Rogers | 4 | $235,921 | 117 | 4.94/5.0 |
| Giovanni | 6 | $222,713 | 133 | 4.83/5.0 |
| Rachel | 2 | $211,271 | 186 | 4.96/5.0 |
| Levi Homes | 5 | $178,407 | 167 | 4.77/5.0 |
| Saleem | 3 | $170,137 | 182 | 4.79/5.0 |
| Alexis | 4 | $148,053 | 210 | 4.92/5.0 |
| Elise Lyn | 2 | $118,006 | 206 | 4.89/5.0 |
Analyzing the strategies of top hosts, such as their property selection, pricing, and guest communication, can offer valuable lessons for optimizing your own Airbnb operations in Conroe.
Dive Deeper: Advanced Conroe STR Market Data (2026)
Ready to unlock more insights? AirROI provides access to advanced metrics and comprehensive Airbnb data for Conroe. Explore detailed analytics beyond this report to refine your investment strategy, optimize pricing, and maximize your vacation rental profits.
Explore Advanced MetricsConroe Short-Term Rental Market Composition (2026): Property & Room Types
Room Type Distribution
Property Type Distribution
Market Composition Insights for Conroe
- The Conroe Airbnb market composition is heavily skewed towards Entire Home/Apt listings, which make up 92.6% of the 337 active rentals. This indicates strong guest preference for privacy and space.
- Looking at the property type distribution in Conroe, House properties are the most common (79.8%), reflecting the local real estate landscape.
- Houses represent a significant 79.8% portion, catering likely to families or larger groups.
- Smaller segments like hotel/boutique, outdoor/unique, others, unique stays (combined 9.0%) offer potential for unique stay experiences.
Conroe Airbnb Room Capacity Analysis (2026): Bedroom Distribution
Distribution of Listings by Number of Bedrooms
Room Capacity Insights for Conroe
- The dominant room capacity in Conroe is 3 bedrooms listings, making up 33.5% of the market. This suggests a strong demand for properties suitable for families or small groups.
- Together, 3 bedrooms and 4 bedrooms properties represent 52.5% of the active Airbnb listings in Conroe, indicating a high concentration in these sizes.
- A significant 60.8% of listings offer 3+ bedrooms, catering to larger groups and families seeking more space in Conroe.
Conroe Vacation Rental Guest Capacity Trends (2026)
Distribution of Listings by Guest Capacity
Guest Capacity Insights for Conroe
- The most common guest capacity trend in Conroe vacation rentals is listings accommodating 8+ guests (44.5%). This suggests the primary traveler segment is likely larger groups.
- Properties designed for 8+ guests and 6 guests dominate the Conroe STR market, accounting for 62.0% of listings.
- 68.2% of properties accommodate 6+ guests, serving the market segment for larger families or group travel in Conroe.
- On average, properties in Conroe are equipped to host 5.8 guests.
Conroe Airbnb Booking Patterns (2026): Available vs. Booked Days
Available Days Distribution
Booked Days Distribution
Booking Pattern Insights for Conroe
- The most common availability pattern in Conroe falls within the 271-366 days range, representing 40.4% of listings. This suggests many properties have significant open periods on their calendars.
- Approximately 78.4% of listings show high availability (181+ days open annually), indicating potential for increased bookings or specific owner usage patterns.
- For booked days, the 91-180 days range is most frequent in Conroe (38.3%), reflecting common guest stay durations or potential owner blocking patterns.
- A notable 22.9% of properties secure long booking periods (181+ days booked per year), highlighting successful long-term rental strategies or significant owner usage.
Conroe Airbnb Minimum Stay Requirements Analysis
Distribution of Listings by Minimum Night Requirement
1 Night
63 listings
18.7% of total
2 Nights
141 listings
41.8% of total
3 Nights
13 listings
3.9% of total
4-6 Nights
9 listings
2.7% of total
7-29 Nights
16 listings
4.7% of total
30+ Nights
95 listings
28.2% of total
Key Insights
- The most prevalent minimum stay requirement in Conroe is 2 Nights, adopted by 41.8% of listings. This highlights the market's preference for shorter, flexible bookings.
- A strong majority (60.5%) of the Conroe Airbnb data shows acceptance of very short stays (1-2 nights), indicating a dynamic, high-turnover market.
- A significant segment (28.2%) caters to monthly stays (30+ nights) in Conroe, pointing to opportunities in the extended-stay market.
Recommendations
- Align with the market by considering a 2 Nights minimum stay, as 41.8% of Conroe hosts use this setting.
- If feasible, allowing 1-night stays, especially midweek or during low season, could capture last-minute bookings, as only 18.7% currently do.
- A 2-night minimum appears standard (41.8%). Consider this for weekends or peak periods.
- Explore offering discounts for stays of 30+ nights to attract the 28.2% of the market seeking extended stays.
- Adjust minimum nights based on seasonality – potentially shorter during low season and longer during peak demand periods in Conroe.
Conroe Airbnb Cancellation Policy Trends Analysis (2026)
Super Strict 30 Days
1 listings
0.3% of total
Limited
8 listings
2.4% of total
Flexible
78 listings
23.1% of total
Moderate
87 listings
25.8% of total
Firm
114 listings
33.8% of total
Strict
49 listings
14.5% of total
Cancellation Policy Insights for Conroe
- The prevailing Airbnb cancellation policy trend in Conroe is Firm, used by 33.8% of listings.
- There's a relatively balanced mix between guest-friendly (48.9%) and stricter (48.3%) policies, offering choices for different guest needs.
Recommendations for Hosts
- Consider adopting a Firm policy to align with the 33.8% market standard in Conroe.
- Using a Strict policy might deter some guests, as only 14.5% of listings use it. Evaluate if potential revenue protection outweighs possible lower booking rates.
- Regularly review your cancellation policy against competitors and market demand shifts in Conroe.
Conroe STR Booking Lead Time Analysis (2026)
Average Booking Lead Time by Month
Booking Lead Time Insights for Conroe
- The overall average booking lead time for vacation rentals in Conroe is 30 days.
- Guests book furthest in advance for stays during November (average 51 days), likely coinciding with peak travel demand or local events.
- The shortest booking windows occur for stays in March (average 24 days), indicating more last-minute travel plans during this time.
- Seasonally, Fall (40 days avg.) sees the longest lead times, while Spring (31 days avg.) has the shortest, reflecting typical travel planning cycles.
Recommendations for Hosts
- Use the overall average lead time (30 days) as a baseline for your pricing and availability strategy in Conroe.
- For November stays, consider implementing length-of-stay discounts or slightly higher rates for bookings made less than 51 days out to capitalize on advance planning.
- Target marketing efforts for the Fall season well in advance (at least 40 days) to capture early planners.
- Monitor your own booking lead times against these Conroe averages to identify opportunities for dynamic pricing adjustments.
Popular & Essential Airbnb Amenities in Conroe (2026)
Amenity Prevalence
Amenity Insights for Conroe
- Essential amenities in Conroe that guests expect include: Air conditioning, Wifi, TV, Smoke alarm, Free parking on premises. Lacking these (any) could significantly impact bookings.
- Popular amenities like Heating, Kitchen, Hot water are common but not universal. Offering these can provide a competitive edge.
Recommendations for Hosts
- Ensure your listing includes all essential amenities for Conroe: Air conditioning, Wifi, TV, Smoke alarm, Free parking on premises.
- Prioritize adding missing essentials: Air conditioning, Wifi, TV, Smoke alarm, Free parking on premises.
- Consider adding popular differentiators like Heating or Kitchen to increase appeal.
- Highlight unique or less common amenities you offer (e.g., hot tub, dedicated workspace, EV charger) in your listing description and photos.
- Regularly check competitor amenities in Conroe to stay competitive.
Conroe Airbnb Guest Demographics & Profile Analysis (2026)
Guest Profile Summary for Conroe
- The typical guest profile for Airbnb in Conroe consists of primarily domestic travelers (95%), often arriving from nearby Houston, typically belonging to the Post-2000s (Gen Z/Alpha) group (50%), primarily speaking English or Spanish.
- Domestic travelers account for 94.7% of guests.
- Key international markets include United States (94.7%) and Canada (1.7%).
- Top languages spoken are English (71.6%) followed by Spanish (19.1%).
- A significant demographic segment is the Post-2000s (Gen Z/Alpha) group, representing 50% of guests.
Recommendations for Hosts
- Target domestic marketing efforts towards travelers from Houston and Austin.
- Tailor amenities and listing descriptions to appeal to the dominant Post-2000s (Gen Z/Alpha) demographic (e.g., highlight fast WiFi, smart home features, local guides).
- Highlight unique local experiences or amenities relevant to the primary guest profile.
- Consider seasonal promotions aligned with peak travel times for key origin markets.
Nearby Short-Term Rental Market Comparison
How does the Conroe Airbnb market stack up against its neighbors? Compare key performance metrics like average monthly revenue, ADR, and occupancy rates in surrounding areas to understand the broader regional STR landscape.
| Market | Active Properties | Monthly Revenue | Daily Rate | Avg. Occupancy |
|---|---|---|---|---|
| Fairfield | 10 | $4,761 | $360.96 | 42% |
| Jamaica Beach | 199 | $3,774 | $394.20 | 37% |
| Crystal Beach | 143 | $3,768 | $408.48 | 35% |
| Bolivar Peninsula | 913 | $3,311 | $396.49 | 34% |
| Columbus | 17 | $3,218 | $413.88 | 29% |
| Deer Park | 14 | $3,208 | $228.63 | 51% |
| Schulenburg | 25 | $3,157 | $349.06 | 31% |
| Chappell Hill | 11 | $2,947 | $509.72 | 31% |
| Streetman | 20 | $2,898 | $336.71 | 32% |
| Seabrook | 54 | $2,872 | $263.19 | 39% |