Buda Airbnb Market Analysis 2026: Short Term Rental Data & Vacation Rental Statistics in Texas, United States
Is Airbnb profitable in Buda in 2026? Explore comprehensive Airbnb analytics for Buda, Texas, United States to uncover income potential. This 2026 STR market report for Buda, based on AirROI data from February 2025 to January 2026, reveals key trends in the niche market of 66 active listings.
Whether you're considering an Airbnb investment in Buda, optimizing your existing vacation rental, or exploring rental arbitrage opportunities, understanding the Buda Airbnb data is crucial. Leveraging the low regulation environment is key to maximizing your short term rental income potential. Let's dive into the specifics.
Key Buda Airbnb Performance Metrics Overview
Monthly Airbnb Revenue Variations & Income Potential in Buda (2026)
Understanding the monthly revenue variations for Airbnb listings in Buda is key to maximizing your short term rental income potential. Seasonality significantly impacts earnings. Our analysis, based on data from the past 12 months, shows that the peak revenue month for STRs in Buda is typically October, while January often presents the lowest earnings, highlighting opportunities for strategic pricing adjustments during shoulder and low seasons. Explore the typical Airbnb income in Buda across different performance tiers:
- Best-in-class properties (Top 10%) achieve $6,269+ monthly, often utilizing dynamic pricing and superior guest experiences.
- Strong performing properties (Top 25%) earn $3,490 or more, indicating effective management and desirable locations/amenities.
- Typical properties (Median) generate around $1,981 per month, representing the average market performance.
- Entry-level properties (Bottom 25%) see earnings around $852, often with potential for optimization.
Average Monthly Airbnb Earnings Trend in Buda
Buda Airbnb Occupancy Rate Trends (2026)
Maximize your bookings by understanding the Buda STR occupancy trends. Seasonal demand shifts significantly influence how often properties are booked. Typically, Julysees the highest demand (peak season occupancy), while January experiences the lowest (low season). Effective strategies, like adjusting minimum stays or offering promotions, can boost occupancy during slower periods. Here's how different property tiers perform in Buda:
- Best-in-class properties (Top 10%) achieve 77%+ occupancy, indicating high desirability and potentially optimized availability.
- Strong performing properties (Top 25%) maintain 59% or higher occupancy, suggesting good market fit and guest satisfaction.
- Typical properties (Median) have an occupancy rate around 34%.
- Entry-level properties (Bottom 25%) average 16% occupancy, potentially facing higher vacancy.
Average Monthly Occupancy Rate Trend in Buda
Average Daily Rate (ADR) Airbnb Trends in Buda (2026)
Effective short term rental pricing strategy in Buda involves understanding monthly ADR fluctuations. The Average Daily Rate (ADR) for Airbnb in Buda typically peaks in October and dips lowest during February. Leveraging Airbnb dynamic pricing tools or strategies based on this seasonality can significantly boost revenue. Here's a look at the typical nightly rates achieved:
- Best-in-class properties (Top 10%) command rates of $404+ per night, often due to premium features or locations.
- Strong performing properties (Top 25%) achieve nightly rates of $264 or more.
- Typical properties (Median) charge around $176 per night.
- Entry-level properties (Bottom 25%) earn around $107 per night.
Average Daily Rate (ADR) Trend by Month in Buda
Get Live Buda Market Intelligence 👇

Explore Real-time Analytics
Airbnb Seasonality Analysis & Trends in Buda (2026)
Peak Season (October, July, November)
- Revenue averages $3,881 per month
- Occupancy rates average 41.7%
- Daily rates average $247
Shoulder Season
- Revenue averages $2,967 per month
- Occupancy maintains around 39.1%
- Daily rates hold near $226
Low Season (January, February, September)
- Revenue drops to average $2,183 per month
- Occupancy decreases to average 34.6%
- Daily rates adjust to average $228
Seasonality Insights for Buda
- The Airbnb seasonality in Buda shows highly seasonal trends requiring careful strategy. While the sections above show seasonal averages, it's also insightful to look at the extremes:
- During the high season, the absolute peak month showcases Buda's highest earning potential, with monthly revenues capable of climbing to $4,134, occupancy reaching a high of 44.1%, and ADRs peaking at $271.
- Conversely, the slowest single month of the year, typically falling within the low season, marks the market's lowest point. In this month, revenue might dip to $1,895, occupancy could drop to 30.0%, and ADRs may adjust down to $211.
- Understanding both the seasonal averages and these monthly peaks and troughs in revenue, occupancy, and ADR is crucial for maximizing your Airbnb profit potential in Buda.
Seasonal Strategies for Maximizing Profit
- Peak Season: Maximize revenue through premium pricing and potentially longer minimum stays. Ensure high availability.
- Low Season: Offer competitive pricing, special promotions (e.g., extended stay discounts), and flexible cancellation policies. Target off-season travelers like remote workers or budget-conscious guests.
- Shoulder Seasons: Implement dynamic pricing that balances peak and low rates. Target weekend travelers or specific events. Offer slightly more flexible terms than peak season.
- Regularly analyze your own performance against these Buda seasonality benchmarks and adjust your pricing and availability strategy accordingly.
Best Areas for Airbnb Investment in Buda (2026)
Exploring the top neighborhoods for short-term rentals in Buda? This section highlights key areas, outlining why they are attractive for hosts and guests, along with notable local attractions. Consider these locations based on your target guest profile and investment strategy.
| Neighborhood / Area | Why Host Here? (Target Guests & Appeal) | Key Attractions & Landmarks |
|---|---|---|
| Lake Travis | A popular destination for water activities, nature enthusiasts, and families. Known for its stunning views, recreational areas, and luxury homes, making it an attractive spot for tourists seeking relaxation and adventure. | Lake Travis, Hamilton Pool Preserve, Pace Bend Park, Windy Point Park, Lakeside Park |
| Buda Historic District | This area boasts charm and character with its historical buildings and small-town atmosphere. Ideal for travelers looking to explore local businesses, restaurants, and community events. | Buda City Park, Historic Buda Depot, Buda Farmers Market, Cypress Creek, Downtown Buda |
| Cabela's Area | Close to the popular Cabela's retail store, this area attracts outdoor enthusiasts and families looking for adventure activities such as fishing, hiking, and camping. | Cabela's, Buda City Park, Cheatham Street Warehouse, Stagecoach Park |
| South Buda | A growing area with new developments, appealing to families and visitors wanting a more suburban feel while still being close to Austin's attractions. | Buda Mill & Grain, Buda Sportsplex, South Park Meadows, Local restaurants and shops |
| Copperas Cove Road | Offers access to both scenic views and a growing community appeal, catering to visitors looking for a quiet stay with nature views yet proximity to city life. | Emerald Point Park, Local trails, Parks and recreation areas |
| Buda Greenbelt | Known for its beautiful trails and parks, this area attracts fitness enthusiasts and families looking for outdoor activities and nature walks. | Buda Greenbelt, Local bike trails, Parks, Nature reserves |
| Austin's South Side | Just a short drive to Austin, this area is attractive for those wanting easy access to the vibrant culture, music, and dining Austin offers, without the high costs of downtown. | Barton Springs Pool, Zilker Park, South Congress Avenue |
| Texas Hill Country | A bit further out, but renowned for its scenic beauty, wineries, and outdoor activities, attracting tourists looking for a countryside getaway. | Wineries, Hiking trails, Natural swimming holes, Scenic drives |
Understanding Airbnb License Requirements & STR Laws in Buda (2026)
While Buda, Texas, United States currently shows low STR regulations, specific Airbnb license requirements might still exist or change. Always verify the latest short term rental regulations and Airbnb license requirements directly with local government authorities for Buda to ensure full compliance before hosting.
(Source: AirROI data, 2026, finding no licensed listings among those analyzed)
Top Performing Airbnb Properties in Buda (2026)
Benchmark your potential! Explore examples of top-performing Airbnb properties in Budabased on Trailing Twelve Month (TTM) revenue. Analyze their characteristics, revenue, occupancy rate, and ADR to understand what drives success in this market.
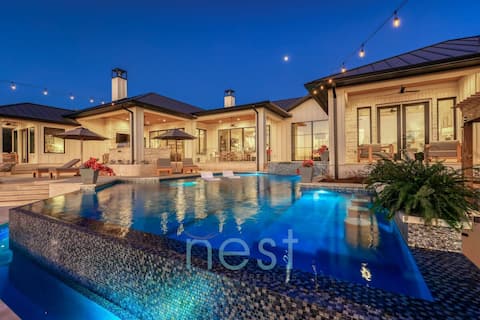
Infinity Pool | Hot Tub | Pool Table | Fire Pit |
Entire Place • 6 bedrooms
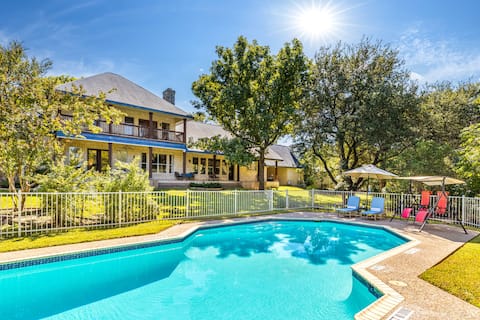
Town & Country: Pool_FirePit_Ping Pong_Basketball
Entire Place • 5 bedrooms

FREE LIMO • Pool • Jacuzzi • Game Room • Sleeps 26
Entire Place • 5 bedrooms

Family/Friend Getaway - Jacuzzi Spa - Peaceful
Entire Place • 4 bedrooms
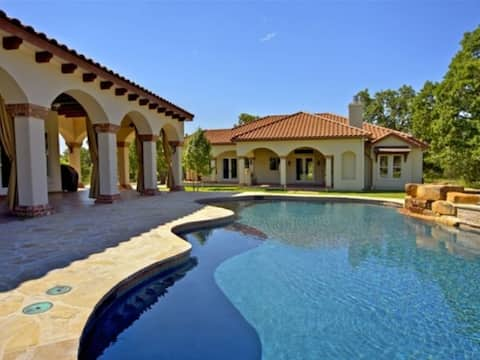
Luxury Hill Country Estate
Entire Place • 6 bedrooms
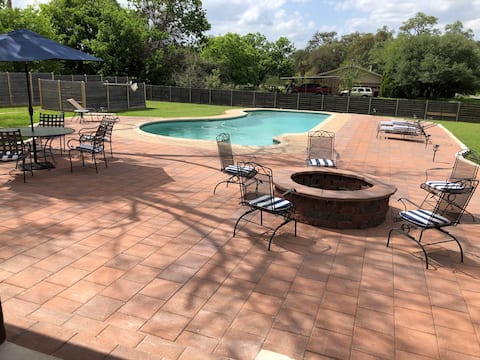
4-Bedroom retreat with Pool & Firepit Space
Entire Place • 4 bedrooms
Note: Performance varies based on location, size, amenities, seasonality, and management quality. Data reflects the past 12 months.
Top Performing Airbnb Hosts in Buda (2026)
Learn from the best! This table showcases top-performing Airbnb hosts in Buda based on the number of properties managed and estimated total revenue over the past year. Analyze their scale and performance metrics.
| Host Name | Properties | Grossing Revenue | Stay Reviews | Avg Rating |
|---|---|---|---|---|
| Tracey | 1 | $174,384 | 7 | 5.00/5.0 |
| Marian | 1 | $141,810 | 86 | 4.98/5.0 |
| Sally | 1 | $138,370 | 105 | 4.83/5.0 |
| Natalina | 1 | $89,760 | 64 | 4.98/5.0 |
| Jennifer Lynn | 1 | $68,593 | 107 | 4.79/5.0 |
| Buda Place RV Resort | 7 | $62,673 | 335 | 4.89/5.0 |
| Linda | 1 | $61,885 | 101 | 4.87/5.0 |
| Jenna | 1 | $58,899 | 45 | 4.98/5.0 |
| Daryl | 2 | $55,033 | 169 | 4.86/5.0 |
| Bear Family | 1 | $48,820 | 46 | 4.89/5.0 |
Analyzing the strategies of top hosts, such as their property selection, pricing, and guest communication, can offer valuable lessons for optimizing your own Airbnb operations in Buda.
Dive Deeper: Advanced Buda STR Market Data (2026)
Ready to unlock more insights? AirROI provides access to advanced metrics and comprehensive Airbnb data for Buda. Explore detailed analytics beyond this report to refine your investment strategy, optimize pricing, and maximize your vacation rental profits.
Explore Advanced MetricsBuda Short-Term Rental Market Composition (2026): Property & Room Types
Room Type Distribution
Property Type Distribution
Market Composition Insights for Buda
- The Buda Airbnb market composition is heavily skewed towards Entire Home/Apt listings, which make up 80.3% of the 66 active rentals. This indicates strong guest preference for privacy and space.
- Looking at the property type distribution in Buda, House properties are the most common (72.7%), reflecting the local real estate landscape.
- Houses represent a significant 72.7% portion, catering likely to families or larger groups.
- The presence of 6.1% Hotel/Boutique listings indicates integration with traditional hospitality.
- Smaller segments like apartment/condo, unique stays (combined 3.0%) offer potential for unique stay experiences.
Buda Airbnb Room Capacity Analysis (2026): Bedroom Distribution
Distribution of Listings by Number of Bedrooms
Room Capacity Insights for Buda
- The dominant room capacity in Buda is 1 bedroom listings, making up 25.8% of the market. This suggests a strong demand for properties suitable for couples or solo travelers.
- Together, 1 bedroom and 3 bedrooms properties represent 50.0% of the active Airbnb listings in Buda, indicating a high concentration in these sizes.
- A significant 50.0% of listings offer 3+ bedrooms, catering to larger groups and families seeking more space in Buda.
Buda Vacation Rental Guest Capacity Trends (2026)
Distribution of Listings by Guest Capacity
Guest Capacity Insights for Buda
- The most common guest capacity trend in Buda vacation rentals is listings accommodating 8+ guests (30.3%). This suggests the primary traveler segment is likely larger groups.
- Properties designed for 8+ guests and 6 guests dominate the Buda STR market, accounting for 51.5% of listings.
- 53.0% of properties accommodate 6+ guests, serving the market segment for larger families or group travel in Buda.
- On average, properties in Buda are equipped to host 4.9 guests.
Buda Airbnb Booking Patterns (2026): Available vs. Booked Days
Available Days Distribution
Booked Days Distribution
Booking Pattern Insights for Buda
- The most common availability pattern in Buda falls within the 271-366 days range, representing 66.7% of listings. This suggests many properties have significant open periods on their calendars.
- Approximately 83.4% of listings show high availability (181+ days open annually), indicating potential for increased bookings or specific owner usage patterns.
- For booked days, the 31-90 days range is most frequent in Buda (42.4%), reflecting common guest stay durations or potential owner blocking patterns.
- A notable 16.7% of properties secure long booking periods (181+ days booked per year), highlighting successful long-term rental strategies or significant owner usage.
Buda Airbnb Minimum Stay Requirements Analysis
Distribution of Listings by Minimum Night Requirement
1 Night
19 listings
28.8% of total
2 Nights
27 listings
40.9% of total
3 Nights
2 listings
3% of total
4-6 Nights
2 listings
3% of total
7-29 Nights
4 listings
6.1% of total
30+ Nights
12 listings
18.2% of total
Key Insights
- The most prevalent minimum stay requirement in Buda is 2 Nights, adopted by 40.9% of listings. This highlights the market's preference for shorter, flexible bookings.
- A strong majority (69.7%) of the Buda Airbnb data shows acceptance of very short stays (1-2 nights), indicating a dynamic, high-turnover market.
- A significant segment (18.2%) caters to monthly stays (30+ nights) in Buda, pointing to opportunities in the extended-stay market.
Recommendations
- Align with the market by considering a 2 Nights minimum stay, as 40.9% of Buda hosts use this setting.
- If feasible, allowing 1-night stays, especially midweek or during low season, could capture last-minute bookings, as only 28.8% currently do.
- Explore offering discounts for stays of 30+ nights to attract the 18.2% of the market seeking extended stays.
- Adjust minimum nights based on seasonality – potentially shorter during low season and longer during peak demand periods in Buda.
Buda Airbnb Cancellation Policy Trends Analysis (2026)
Super Strict 30 Days
2 listings
3% of total
Super Strict 60 Days
1 listings
1.5% of total
Flexible
22 listings
33.3% of total
Moderate
14 listings
21.2% of total
Firm
25 listings
37.9% of total
Strict
2 listings
3% of total
Cancellation Policy Insights for Buda
- The prevailing Airbnb cancellation policy trend in Buda is Firm, used by 37.9% of listings.
- There's a relatively balanced mix between guest-friendly (54.5%) and stricter (40.9%) policies, offering choices for different guest needs.
- Strict cancellation policies are quite rare (3%), potentially making listings with this policy less competitive unless justified by high demand or property type.
Recommendations for Hosts
- Consider adopting a Firm policy to align with the 37.9% market standard in Buda.
- Using a Strict policy might deter some guests, as only 3% of listings use it. Evaluate if potential revenue protection outweighs possible lower booking rates.
- Regularly review your cancellation policy against competitors and market demand shifts in Buda.
Buda STR Booking Lead Time Analysis (2026)
Average Booking Lead Time by Month
Booking Lead Time Insights for Buda
- The overall average booking lead time for vacation rentals in Buda is 39 days.
- Guests book furthest in advance for stays during October (average 94 days), likely coinciding with peak travel demand or local events.
- The shortest booking windows occur for stays in February (average 23 days), indicating more last-minute travel plans during this time.
- Seasonally, Fall (62 days avg.) sees the longest lead times, while Winter (32 days avg.) has the shortest, reflecting typical travel planning cycles.
Recommendations for Hosts
- Use the overall average lead time (39 days) as a baseline for your pricing and availability strategy in Buda.
- For October stays, consider implementing length-of-stay discounts or slightly higher rates for bookings made less than 94 days out to capitalize on advance planning.
- Target marketing efforts for the Fall season well in advance (at least 62 days) to capture early planners.
- Monitor your own booking lead times against these Buda averages to identify opportunities for dynamic pricing adjustments.
Popular & Essential Airbnb Amenities in Buda (2026)
Amenity Prevalence
Amenity Insights for Buda
- Essential amenities in Buda that guests expect include: Air conditioning, Free parking on premises, Smoke alarm, Hot water, Heating. Lacking these (any) could significantly impact bookings.
- Popular amenities like TV, Refrigerator, Coffee maker are common but not universal. Offering these can provide a competitive edge.
Recommendations for Hosts
- Ensure your listing includes all essential amenities for Buda: Air conditioning, Free parking on premises, Smoke alarm, Hot water, Heating.
- Prioritize adding missing essentials: Free parking on premises, Smoke alarm, Hot water, Heating.
- Consider adding popular differentiators like TV or Refrigerator to increase appeal.
- Highlight unique or less common amenities you offer (e.g., hot tub, dedicated workspace, EV charger) in your listing description and photos.
- Regularly check competitor amenities in Buda to stay competitive.
Buda Airbnb Guest Demographics & Profile Analysis (2026)
Guest Profile Summary for Buda
- The typical guest profile for Airbnb in Buda consists of primarily domestic travelers (98%), often arriving from nearby Houston, typically belonging to the Post-2000s (Gen Z/Alpha) group (50%), primarily speaking English or Spanish.
- Domestic travelers account for 98.1% of guests.
- Key international markets include United States (98.1%) and United Kingdom (0.5%).
- Top languages spoken are English (70.2%) followed by Spanish (20.9%).
- A significant demographic segment is the Post-2000s (Gen Z/Alpha) group, representing 50% of guests.
Recommendations for Hosts
- Target domestic marketing efforts towards travelers from Houston and Austin.
- Tailor amenities and listing descriptions to appeal to the dominant Post-2000s (Gen Z/Alpha) demographic (e.g., highlight fast WiFi, smart home features, local guides).
- Highlight unique local experiences or amenities relevant to the primary guest profile.
- Consider seasonal promotions aligned with peak travel times for key origin markets.
Nearby Short-Term Rental Market Comparison
How does the Buda Airbnb market stack up against its neighbors? Compare key performance metrics like average monthly revenue, ADR, and occupancy rates in surrounding areas to understand the broader regional STR landscape.
| Market | Active Properties | Monthly Revenue | Daily Rate | Avg. Occupancy |
|---|---|---|---|---|
| Hudson Bend | 59 | $5,436 | $611.45 | 31% |
| Jonestown | 60 | $5,240 | $513.31 | 32% |
| Gillespie County | 11 | $4,887 | $351.24 | 59% |
| West Lake Hills | 21 | $4,391 | $656.35 | 34% |
| Helotes | 48 | $4,095 | $322.31 | 42% |
| Kingsland | 255 | $4,055 | $564.92 | 27% |
| Cottonwood Shores | 26 | $4,012 | $408.66 | 35% |
| Round Mountain | 17 | $3,781 | $385.24 | 42% |
| Volente | 19 | $3,627 | $462.89 | 30% |
| Dripping Springs | 403 | $3,493 | $389.50 | 32% |