Brownsville Airbnb Market Analysis 2026: Short Term Rental Data & Vacation Rental Statistics in Texas, United States
Is Airbnb profitable in Brownsville in 2026? Explore comprehensive Airbnb analytics for Brownsville, Texas, United States to uncover income potential. This 2026 STR market report for Brownsville, based on AirROI data from February 2025 to January 2026, reveals key trends in the market of 409 active listings.
Whether you're considering an Airbnb investment in Brownsville, optimizing your existing vacation rental, or exploring rental arbitrage opportunities, understanding the Brownsville Airbnb data is crucial. Leveraging the low regulation environment is key to maximizing your short term rental income potential. Let's dive into the specifics.
Key Brownsville Airbnb Performance Metrics Overview
Monthly Airbnb Revenue Variations & Income Potential in Brownsville (2026)
Understanding the monthly revenue variations for Airbnb listings in Brownsville is key to maximizing your short term rental income potential. Seasonality significantly impacts earnings. Our analysis, based on data from the past 12 months, shows that the peak revenue month for STRs in Brownsville is typically July, while January often presents the lowest earnings, highlighting opportunities for strategic pricing adjustments during shoulder and low seasons. Explore the typical Airbnb income in Brownsville across different performance tiers:
- Best-in-class properties (Top 10%) achieve $3,722+ monthly, often utilizing dynamic pricing and superior guest experiences.
- Strong performing properties (Top 25%) earn $2,345 or more, indicating effective management and desirable locations/amenities.
- Typical properties (Median) generate around $1,377 per month, representing the average market performance.
- Entry-level properties (Bottom 25%) see earnings around $674, often with potential for optimization.
Average Monthly Airbnb Earnings Trend in Brownsville
Brownsville Airbnb Occupancy Rate Trends (2026)
Maximize your bookings by understanding the Brownsville STR occupancy trends. Seasonal demand shifts significantly influence how often properties are booked. Typically, Julysees the highest demand (peak season occupancy), while January experiences the lowest (low season). Effective strategies, like adjusting minimum stays or offering promotions, can boost occupancy during slower periods. Here's how different property tiers perform in Brownsville:
- Best-in-class properties (Top 10%) achieve 81%+ occupancy, indicating high desirability and potentially optimized availability.
- Strong performing properties (Top 25%) maintain 63% or higher occupancy, suggesting good market fit and guest satisfaction.
- Typical properties (Median) have an occupancy rate around 40%.
- Entry-level properties (Bottom 25%) average 20% occupancy, potentially facing higher vacancy.
Average Monthly Occupancy Rate Trend in Brownsville
Average Daily Rate (ADR) Airbnb Trends in Brownsville (2026)
Effective short term rental pricing strategy in Brownsville involves understanding monthly ADR fluctuations. The Average Daily Rate (ADR) for Airbnb in Brownsville typically peaks in September and dips lowest during February. Leveraging Airbnb dynamic pricing tools or strategies based on this seasonality can significantly boost revenue. Here's a look at the typical nightly rates achieved:
- Best-in-class properties (Top 10%) command rates of $213+ per night, often due to premium features or locations.
- Strong performing properties (Top 25%) achieve nightly rates of $156 or more.
- Typical properties (Median) charge around $110 per night.
- Entry-level properties (Bottom 25%) earn around $81 per night.
Average Daily Rate (ADR) Trend by Month in Brownsville
Get Live Brownsville Market Intelligence 👇

Explore Real-time Analytics
Airbnb Seasonality Analysis & Trends in Brownsville (2026)
Peak Season (July, June, August)
- Revenue averages $2,190 per month
- Occupancy rates average 49.6%
- Daily rates average $130
Shoulder Season
- Revenue averages $1,716 per month
- Occupancy maintains around 44.1%
- Daily rates hold near $127
Low Season (January, October, November)
- Revenue drops to average $1,454 per month
- Occupancy decreases to average 33.6%
- Daily rates adjust to average $134
Seasonality Insights for Brownsville
- The Airbnb seasonality in Brownsville shows moderate seasonality with distinct peak and low periods. While the sections above show seasonal averages, it's also insightful to look at the extremes:
- During the high season, the absolute peak month showcases Brownsville's highest earning potential, with monthly revenues capable of climbing to $2,411, occupancy reaching a high of 53.4%, and ADRs peaking at $137.
- Conversely, the slowest single month of the year, typically falling within the low season, marks the market's lowest point. In this month, revenue might dip to $1,317, occupancy could drop to 33.0%, and ADRs may adjust down to $120.
- Understanding both the seasonal averages and these monthly peaks and troughs in revenue, occupancy, and ADR is crucial for maximizing your Airbnb profit potential in Brownsville.
Seasonal Strategies for Maximizing Profit
- Peak Season: Maximize revenue through premium pricing and potentially longer minimum stays. Ensure high availability.
- Low Season: Offer competitive pricing, special promotions (e.g., extended stay discounts), and flexible cancellation policies. Target off-season travelers like remote workers or budget-conscious guests.
- Shoulder Seasons: Implement dynamic pricing that balances peak and low rates. Target weekend travelers or specific events. Offer slightly more flexible terms than peak season.
- Regularly analyze your own performance against these Brownsville seasonality benchmarks and adjust your pricing and availability strategy accordingly.
Best Areas for Airbnb Investment in Brownsville (2026)
Exploring the top neighborhoods for short-term rentals in Brownsville? This section highlights key areas, outlining why they are attractive for hosts and guests, along with notable local attractions. Consider these locations based on your target guest profile and investment strategy.
| Neighborhood / Area | Why Host Here? (Target Guests & Appeal) | Key Attractions & Landmarks |
|---|---|---|
| Downtown Brownsville | The heart of Brownsville, featuring a mix of historical sites, cultural attractions, and local businesses. Ideal for tourists wanting to experience the local flavor and events. | Historic Brownsville Museum, Children's Museum, Gladys Porter Zoo, Federal Courthouse, Brownsville Market Square |
| Sunrise Mall | A major retail area with shopping, dining, and entertainment options. This area attracts both local shoppers and visitors, making it a prime spot for Airbnb hosting. | Sunrise Mall, Cinemark Movies 10, restaurants, shopping outlets, Coffeeshops |
| Resaca de la Palma State Park | A natural oasis within the city, perfect for nature lovers and outdoor enthusiasts. Popular for birdwatching and walking trails, appealing for visitors seeking adventure and relaxation. | State park trails, Biking paths, Birdwatching, Picnic areas, Nature center |
| Southmost | A residential neighborhood that offers a unique cultural experience. Close to local attractions and is increasingly popular among budget travelers looking for authentic experiences. | Brownsville Sports Park, Southmost Community Park, Local eateries, Cultural festivals |
| Bayview | A charming area known for its quiet, rural vibe and proximity to nature. Great for visitors looking to escape the city hustle while being close to Brownsville's attractions. | Bayview Nature Park, Laguna Atascosa National Wildlife Refuge, Local farms, Fishing spots |
| Palo Alto | A historical area rich in culture and local heritage. It offers a glimpse into the history of the region and is suitable for educational trips and historical tourism. | Palo Alto Battlefield National Historical Park, Historic monuments, Cultural tours |
| East Brownsville | A growing area that offers a mix of residential and commercial spaces. Close to local parks and amenities, it is appealing to families and longer-term visitors. | Parque Cultural La Ciudad, Civic Park, Shopping centers, Restaurants |
| West Brownsville | A developing area with potential for growth, featuring new amenities and attractions. It is ideal for investors looking to tap into the evolving market of Brownsville. | Local parks, Shopping plazas, Community centers, Upcoming developments |
Understanding Airbnb License Requirements & STR Laws in Brownsville (2026)
While Brownsville, Texas, United States currently shows low STR regulations, specific Airbnb license requirements might still exist or change. Always verify the latest short term rental regulations and Airbnb license requirements directly with local government authorities for Brownsville to ensure full compliance before hosting.
(Source: AirROI data, 2026, based on 0% licensed listings)
Top Performing Airbnb Properties in Brownsville (2026)
Benchmark your potential! Explore examples of top-performing Airbnb properties in Brownsvillebased on Trailing Twelve Month (TTM) revenue. Analyze their characteristics, revenue, occupancy rate, and ADR to understand what drives success in this market.

Luxe Mansion: Cinema • Pool/Hot Tub • Game • Space
Entire Place • 6 bedrooms
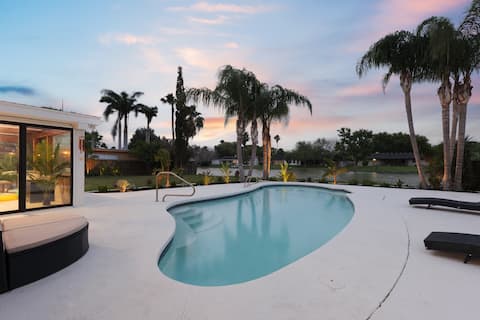
Stunning Waterfront Oasis w/ Pool + Game Room!
Entire Place • 4 bedrooms

La Casa Resaca-waterfront XL Pool w/slide*near SPI
Entire Place • 3 bedrooms

Home w/ Pool & Arcade. Only 30 miles to SpaceX!
Entire Place • 3 bedrooms
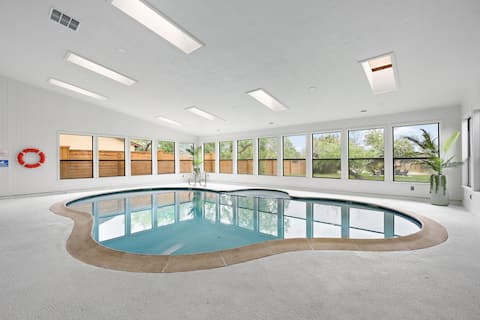
Ultra Luxury; Indoor Pool, Waterfront, Kayaks! +
Entire Place • 4 bedrooms

Ultimate Family Fun 4BR Waterfront Home w/ Pool!
Entire Place • 4 bedrooms
Note: Performance varies based on location, size, amenities, seasonality, and management quality. Data reflects the past 12 months.
Top Performing Airbnb Hosts in Brownsville (2026)
Learn from the best! This table showcases top-performing Airbnb hosts in Brownsville based on the number of properties managed and estimated total revenue over the past year. Analyze their scale and performance metrics.
| Host Name | Properties | Grossing Revenue | Stay Reviews | Avg Rating |
|---|---|---|---|---|
| Maya | 3 | $213,050 | 425 | 4.92/5.0 |
| Ali | 11 | $199,113 | 175 | 4.83/5.0 |
| Roberto | 14 | $154,519 | 86 | 4.87/5.0 |
| Christian | 8 | $150,405 | 370 | 4.84/5.0 |
| Omar | 1 | $135,159 | 34 | 4.97/5.0 |
| Yoyis | 9 | $109,105 | 42 | 4.93/5.0 |
| Elena | 4 | $106,437 | 463 | 4.88/5.0 |
| Evolve | 5 | $105,748 | 148 | 4.74/5.0 |
| Raúl | 10 | $103,623 | 262 | 4.91/5.0 |
| Susana Jessica | 2 | $92,777 | 69 | 4.81/5.0 |
Analyzing the strategies of top hosts, such as their property selection, pricing, and guest communication, can offer valuable lessons for optimizing your own Airbnb operations in Brownsville.
Dive Deeper: Advanced Brownsville STR Market Data (2026)
Ready to unlock more insights? AirROI provides access to advanced metrics and comprehensive Airbnb data for Brownsville. Explore detailed analytics beyond this report to refine your investment strategy, optimize pricing, and maximize your vacation rental profits.
Explore Advanced MetricsBrownsville Short-Term Rental Market Composition (2026): Property & Room Types
Room Type Distribution
Property Type Distribution
Market Composition Insights for Brownsville
- The Brownsville Airbnb market composition is heavily skewed towards Entire Home/Apt listings, which make up 91.7% of the 409 active rentals. This indicates strong guest preference for privacy and space.
- Looking at the property type distribution in Brownsville, House properties are the most common (56%), reflecting the local real estate landscape.
- Houses represent a significant 56% portion, catering likely to families or larger groups.
- Smaller segments like others, outdoor/unique, hotel/boutique (combined 8.8%) offer potential for unique stay experiences.
Brownsville Airbnb Room Capacity Analysis (2026): Bedroom Distribution
Distribution of Listings by Number of Bedrooms
Room Capacity Insights for Brownsville
- The dominant room capacity in Brownsville is 2 bedrooms listings, making up 29.3% of the market. This suggests a strong demand for properties suitable for couples or solo travelers.
- Together, 2 bedrooms and 3 bedrooms properties represent 57.2% of the active Airbnb listings in Brownsville, indicating a high concentration in these sizes.
- A significant 38.2% of listings offer 3+ bedrooms, catering to larger groups and families seeking more space in Brownsville.
Brownsville Vacation Rental Guest Capacity Trends (2026)
Distribution of Listings by Guest Capacity
Guest Capacity Insights for Brownsville
- The most common guest capacity trend in Brownsville vacation rentals is listings accommodating 4 guests (22.7%). This suggests the primary traveler segment is likely small families or groups.
- Properties designed for 4 guests and 6 guests dominate the Brownsville STR market, accounting for 43.5% of listings.
- 45.5% of properties accommodate 6+ guests, serving the market segment for larger families or group travel in Brownsville.
- On average, properties in Brownsville are equipped to host 4.8 guests.
Brownsville Airbnb Booking Patterns (2026): Available vs. Booked Days
Available Days Distribution
Booked Days Distribution
Booking Pattern Insights for Brownsville
- The most common availability pattern in Brownsville falls within the 271-366 days range, representing 46.7% of listings. This suggests many properties have significant open periods on their calendars.
- Approximately 80.7% of listings show high availability (181+ days open annually), indicating potential for increased bookings or specific owner usage patterns.
- For booked days, the 91-180 days range is most frequent in Brownsville (35.7%), reflecting common guest stay durations or potential owner blocking patterns.
- A notable 20.5% of properties secure long booking periods (181+ days booked per year), highlighting successful long-term rental strategies or significant owner usage.
Brownsville Airbnb Minimum Stay Requirements Analysis
Distribution of Listings by Minimum Night Requirement
1 Night
118 listings
28.9% of total
2 Nights
145 listings
35.5% of total
3 Nights
27 listings
6.6% of total
4-6 Nights
17 listings
4.2% of total
7-29 Nights
16 listings
3.9% of total
30+ Nights
86 listings
21% of total
Key Insights
- The most prevalent minimum stay requirement in Brownsville is 2 Nights, adopted by 35.5% of listings. This highlights the market's preference for shorter, flexible bookings.
- A strong majority (64.4%) of the Brownsville Airbnb data shows acceptance of very short stays (1-2 nights), indicating a dynamic, high-turnover market.
- A significant segment (21%) caters to monthly stays (30+ nights) in Brownsville, pointing to opportunities in the extended-stay market.
Recommendations
- Align with the market by considering a 2 Nights minimum stay, as 35.5% of Brownsville hosts use this setting.
- If feasible, allowing 1-night stays, especially midweek or during low season, could capture last-minute bookings, as only 28.9% currently do.
- Explore offering discounts for stays of 30+ nights to attract the 21% of the market seeking extended stays.
- Adjust minimum nights based on seasonality – potentially shorter during low season and longer during peak demand periods in Brownsville.
Brownsville Airbnb Cancellation Policy Trends Analysis (2026)
Super Strict 30 Days
1 listings
0.2% of total
Limited
1 listings
0.2% of total
Flexible
153 listings
37.4% of total
Moderate
112 listings
27.4% of total
Firm
101 listings
24.7% of total
Strict
41 listings
10% of total
Cancellation Policy Insights for Brownsville
- The prevailing Airbnb cancellation policy trend in Brownsville is Flexible, used by 37.4% of listings.
- There's a relatively balanced mix between guest-friendly (64.8%) and stricter (34.7%) policies, offering choices for different guest needs.
Recommendations for Hosts
- Consider adopting a Flexible policy to align with the 37.4% market standard in Brownsville.
- Using a Strict policy might deter some guests, as only 10% of listings use it. Evaluate if potential revenue protection outweighs possible lower booking rates.
- Regularly review your cancellation policy against competitors and market demand shifts in Brownsville.
Brownsville STR Booking Lead Time Analysis (2026)
Average Booking Lead Time by Month
Booking Lead Time Insights for Brownsville
- The overall average booking lead time for vacation rentals in Brownsville is 19 days.
- Guests book furthest in advance for stays during July (average 27 days), likely coinciding with peak travel demand or local events.
- The shortest booking windows occur for stays in August (average 15 days), indicating more last-minute travel plans during this time.
- Seasonally, Summer (21 days avg.) sees the longest lead times, while Spring (18 days avg.) has the shortest, reflecting typical travel planning cycles.
Recommendations for Hosts
- Use the overall average lead time (19 days) as a baseline for your pricing and availability strategy in Brownsville.
- Target marketing efforts for the Summer season well in advance (at least 21 days) to capture early planners.
- Monitor your own booking lead times against these Brownsville averages to identify opportunities for dynamic pricing adjustments.
Popular & Essential Airbnb Amenities in Brownsville (2026)
Amenity Prevalence
Amenity Insights for Brownsville
- Essential amenities in Brownsville that guests expect include: Air conditioning, Wifi, TV, Free parking on premises. Lacking these (any) could significantly impact bookings.
- Popular amenities like Kitchen, Smoke alarm, Heating are common but not universal. Offering these can provide a competitive edge.
Recommendations for Hosts
- Ensure your listing includes all essential amenities for Brownsville: Air conditioning, Wifi, TV, Free parking on premises.
- Prioritize adding missing essentials: Air conditioning, Wifi, TV, Free parking on premises.
- Consider adding popular differentiators like Kitchen or Smoke alarm to increase appeal.
- Highlight unique or less common amenities you offer (e.g., hot tub, dedicated workspace, EV charger) in your listing description and photos.
- Regularly check competitor amenities in Brownsville to stay competitive.
Brownsville Airbnb Guest Demographics & Profile Analysis (2026)
Guest Profile Summary for Brownsville
- The typical guest profile for Airbnb in Brownsville consists of primarily domestic travelers (89%), often arriving from nearby Houston, typically belonging to the Post-2000s (Gen Z/Alpha) group (50%), primarily speaking English or Spanish.
- Domestic travelers account for 89.3% of guests.
- Key international markets include United States (89.3%) and Mexico (7.7%).
- Top languages spoken are English (53.7%) followed by Spanish (40%).
- A significant demographic segment is the Post-2000s (Gen Z/Alpha) group, representing 50% of guests.
Recommendations for Hosts
- Target domestic marketing efforts towards travelers from Houston and San Antonio.
- Tailor amenities and listing descriptions to appeal to the dominant Post-2000s (Gen Z/Alpha) demographic (e.g., highlight fast WiFi, smart home features, local guides).
- Highlight unique local experiences or amenities relevant to the primary guest profile.
- Consider seasonal promotions aligned with peak travel times for key origin markets.
Nearby Short-Term Rental Market Comparison
How does the Brownsville Airbnb market stack up against its neighbors? Compare key performance metrics like average monthly revenue, ADR, and occupancy rates in surrounding areas to understand the broader regional STR landscape.
| Market | Active Properties | Monthly Revenue | Daily Rate | Avg. Occupancy |
|---|---|---|---|---|
| South Padre Island | 2,347 | $2,957 | $341.64 | 36% |
| Port Mansfield | 29 | $2,788 | $374.59 | 32% |
| Alton | 13 | $2,484 | $392.58 | 23% |
| Rio Hondo | 46 | $2,381 | $309.67 | 31% |
| Port Isabel | 249 | $2,138 | $253.87 | 38% |
| La Feria | 12 | $1,810 | $138.16 | 45% |
| Rancho Viejo | 26 | $1,586 | $156.87 | 38% |
| Laguna Vista | 95 | $1,551 | $242.35 | 35% |
| Harlingen | 127 | $1,446 | $139.11 | 43% |
| Mission | 136 | $1,334 | $150.02 | 36% |